Cities with the Lowest Poverty Level Among Single Males in Washington
RELATED REPORTS & OPTIONS
Lowest Poverty | Single Male
Washington
Compare Cities
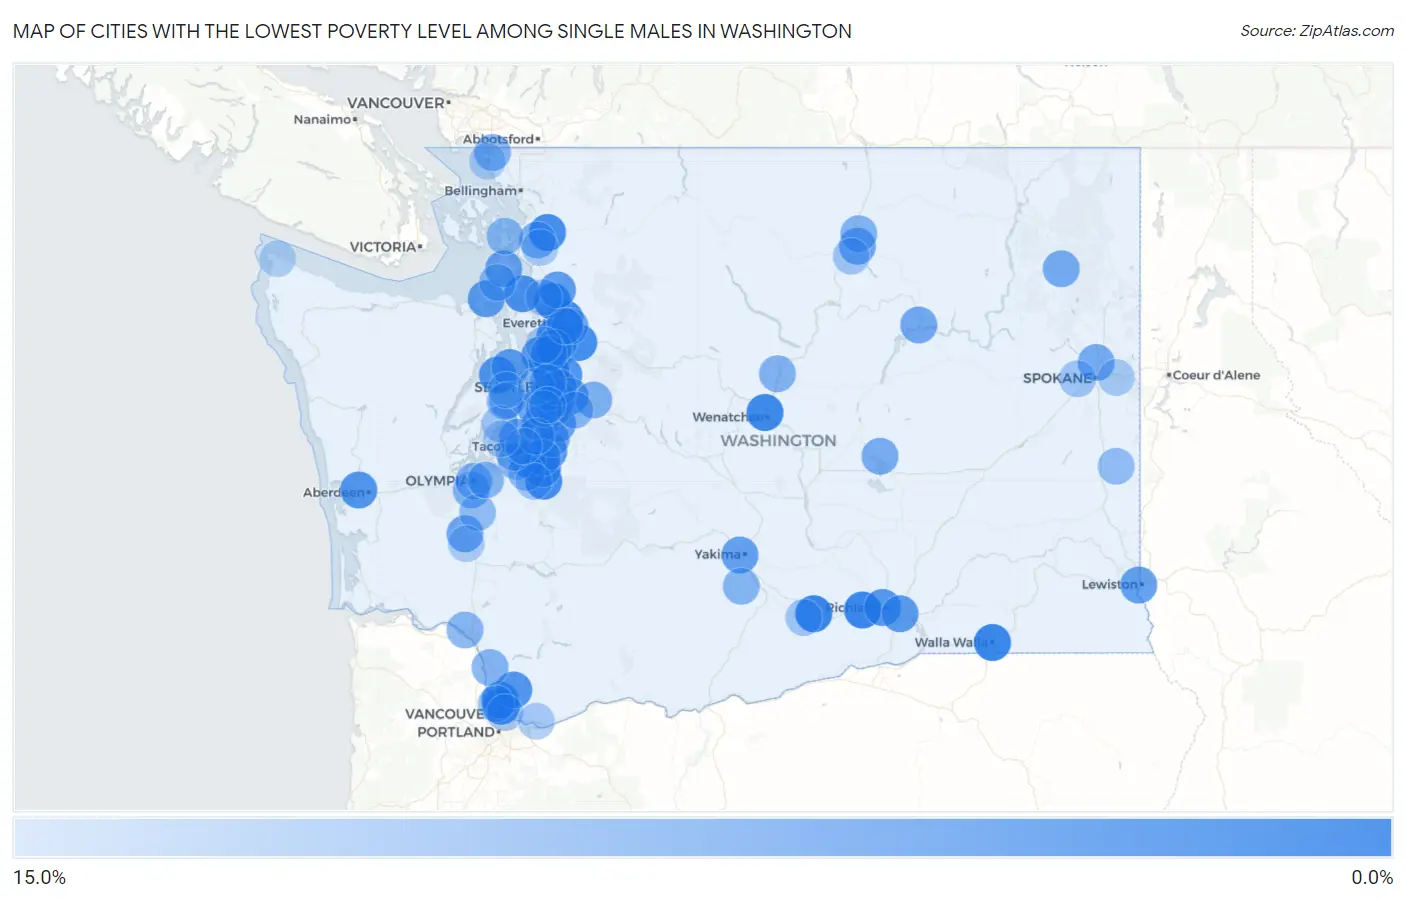
Map of Cities with the Lowest Poverty Level Among Single Males in Washington
15.0%
0.0%
Cities with the Lowest Poverty Level Among Single Males in Washington
| City | Single Male Poverty | vs State | vs National | |
| 1. | Grandview | 0.98% | 9.3%(-8.28)#1 | 12.4%(-11.5)#33 |
| 2. | Kenmore | 1.1% | 9.3%(-8.15)#2 | 12.4%(-11.3)#52 |
| 3. | Walla Walla | 1.2% | 9.3%(-8.04)#3 | 12.4%(-11.2)#59 |
| 4. | Benton City | 1.2% | 9.3%(-8.03)#4 | 12.4%(-11.2)#60 |
| 5. | Lake Stevens | 1.3% | 9.3%(-7.91)#5 | 12.4%(-11.1)#75 |
| 6. | Wenatchee | 1.5% | 9.3%(-7.74)#6 | 12.4%(-10.9)#107 |
| 7. | Marysville | 1.8% | 9.3%(-7.42)#7 | 12.4%(-10.6)#151 |
| 8. | Bothell | 2.1% | 9.3%(-7.18)#8 | 12.4%(-10.4)#185 |
| 9. | Sedro Woolley | 2.3% | 9.3%(-6.97)#9 | 12.4%(-10.1)#236 |
| 10. | Monroe | 2.3% | 9.3%(-6.94)#10 | 12.4%(-10.1)#240 |
| 11. | Hazel Dell | 2.4% | 9.3%(-6.89)#11 | 12.4%(-10.1)#250 |
| 12. | Graham | 2.4% | 9.3%(-6.88)#12 | 12.4%(-10.1)#251 |
| 13. | Eastmont | 2.5% | 9.3%(-6.78)#13 | 12.4%(-9.95)#266 |
| 14. | Camano | 2.9% | 9.3%(-6.36)#14 | 12.4%(-9.54)#336 |
| 15. | South Hill | 3.3% | 9.3%(-5.96)#15 | 12.4%(-9.13)#416 |
| 16. | Salmon Creek | 3.4% | 9.3%(-5.91)#16 | 12.4%(-9.08)#428 |
| 17. | Silverdale | 3.4% | 9.3%(-5.88)#17 | 12.4%(-9.05)#435 |
| 18. | Redmond | 3.5% | 9.3%(-5.80)#18 | 12.4%(-8.97)#452 |
| 19. | Hoquiam | 3.5% | 9.3%(-5.75)#19 | 12.4%(-8.93)#459 |
| 20. | Kirkland | 3.6% | 9.3%(-5.64)#20 | 12.4%(-8.81)#494 |
| 21. | Battle Ground | 3.7% | 9.3%(-5.56)#21 | 12.4%(-8.73)#509 |
| 22. | Mountlake Terrace | 3.7% | 9.3%(-5.52)#22 | 12.4%(-8.70)#514 |
| 23. | Richland | 3.8% | 9.3%(-5.44)#23 | 12.4%(-8.61)#533 |
| 24. | Sumner | 4.0% | 9.3%(-5.26)#24 | 12.4%(-8.44)#576 |
| 25. | Suquamish | 4.3% | 9.3%(-5.01)#25 | 12.4%(-8.18)#643 |
| 26. | Silver Firs | 4.3% | 9.3%(-4.96)#26 | 12.4%(-8.13)#656 |
| 27. | Pasco | 4.3% | 9.3%(-4.92)#27 | 12.4%(-8.10)#660 |
| 28. | Burien | 4.4% | 9.3%(-4.83)#28 | 12.4%(-8.00)#684 |
| 29. | Port Townsend | 4.5% | 9.3%(-4.80)#29 | 12.4%(-7.98)#692 |
| 30. | Arlington | 4.7% | 9.3%(-4.59)#30 | 12.4%(-7.76)#750 |
| 31. | Issaquah | 4.7% | 9.3%(-4.54)#31 | 12.4%(-7.71)#770 |
| 32. | Kent | 5.0% | 9.3%(-4.28)#32 | 12.4%(-7.45)#828 |
| 33. | Ruston | 5.0% | 9.3%(-4.26)#33 | 12.4%(-7.44)#840 |
| 34. | Clarkston | 5.0% | 9.3%(-4.23)#34 | 12.4%(-7.40)#850 |
| 35. | Yakima | 5.3% | 9.3%(-3.95)#35 | 12.4%(-7.12)#919 |
| 36. | Midland | 5.3% | 9.3%(-3.92)#36 | 12.4%(-7.09)#926 |
| 37. | Oak Harbor | 5.5% | 9.3%(-3.77)#37 | 12.4%(-6.95)#963 |
| 38. | Des Moines | 5.8% | 9.3%(-3.44)#38 | 12.4%(-6.61)#1,041 |
| 39. | Renton | 6.2% | 9.3%(-3.09)#39 | 12.4%(-6.26)#1,139 |
| 40. | Centralia | 6.4% | 9.3%(-2.90)#40 | 12.4%(-6.07)#1,193 |
| 41. | Omak | 6.5% | 9.3%(-2.81)#41 | 12.4%(-5.98)#1,208 |
| 42. | Everett | 6.5% | 9.3%(-2.78)#42 | 12.4%(-5.95)#1,219 |
| 43. | Coulee Dam | 6.5% | 9.3%(-2.74)#43 | 12.4%(-5.91)#1,230 |
| 44. | Country Homes | 7.0% | 9.3%(-2.31)#44 | 12.4%(-5.48)#1,366 |
| 45. | Chewelah | 7.1% | 9.3%(-2.20)#45 | 12.4%(-5.38)#1,398 |
| 46. | Auburn | 7.1% | 9.3%(-2.18)#46 | 12.4%(-5.35)#1,403 |
| 47. | Moses Lake North | 7.2% | 9.3%(-2.05)#47 | 12.4%(-5.22)#1,446 |
| 48. | Burlington | 7.3% | 9.3%(-1.93)#48 | 12.4%(-5.10)#1,480 |
| 49. | Parkwood | 7.4% | 9.3%(-1.86)#49 | 12.4%(-5.03)#1,490 |
| 50. | Mill Creek East | 7.5% | 9.3%(-1.81)#50 | 12.4%(-4.98)#1,508 |
| 51. | Newcastle | 7.5% | 9.3%(-1.72)#51 | 12.4%(-4.89)#1,535 |
| 52. | Tumwater | 7.9% | 9.3%(-1.39)#52 | 12.4%(-4.56)#1,641 |
| 53. | Snoqualmie | 8.0% | 9.3%(-1.26)#53 | 12.4%(-4.44)#1,681 |
| 54. | Mercer Island | 8.0% | 9.3%(-1.24)#54 | 12.4%(-4.41)#1,693 |
| 55. | Bellevue | 8.1% | 9.3%(-1.17)#55 | 12.4%(-4.34)#1,712 |
| 56. | Blaine | 8.2% | 9.3%(-1.10)#56 | 12.4%(-4.27)#1,729 |
| 57. | Entiat | 8.3% | 9.3%(-0.929)#57 | 12.4%(-4.10)#1,794 |
| 58. | Riverside | 8.3% | 9.3%(-0.929)#58 | 12.4%(-4.10)#1,809 |
| 59. | Olympia | 8.4% | 9.3%(-0.869)#59 | 12.4%(-4.04)#1,823 |
| 60. | Woodland | 8.5% | 9.3%(-0.716)#60 | 12.4%(-3.89)#1,858 |
| 61. | Longview | 8.7% | 9.3%(-0.611)#61 | 12.4%(-3.78)#1,892 |
| 62. | Harrah | 8.7% | 9.3%(-0.567)#62 | 12.4%(-3.74)#1,907 |
| 63. | Bothell West | 8.7% | 9.3%(-0.552)#63 | 12.4%(-3.72)#1,910 |
| 64. | Lakewood | 8.8% | 9.3%(-0.512)#64 | 12.4%(-3.68)#1,915 |
| 65. | Mirrormont | 8.9% | 9.3%(-0.374)#65 | 12.4%(-3.55)#1,953 |
| 66. | Seattle | 9.1% | 9.3%(-0.211)#66 | 12.4%(-3.38)#1,991 |
| 67. | Anacortes | 9.2% | 9.3%(-0.084)#67 | 12.4%(-3.26)#2,056 |
| 68. | Medina | 9.3% | 9.3%(-0.003)#68 | 12.4%(-3.18)#2,075 |
| 69. | Coupeville | 9.3% | 9.3%(-0.003)#69 | 12.4%(-3.18)#2,076 |
| 70. | Puyallup | 9.4% | 9.3%(+0.102)#70 | 12.4%(-3.07)#2,092 |
| 71. | Lake Shore | 9.5% | 9.3%(+0.261)#71 | 12.4%(-2.91)#2,137 |
| 72. | East Port Orchard | 9.9% | 9.3%(+0.597)#72 | 12.4%(-2.58)#2,234 |
| 73. | Spanaway | 9.9% | 9.3%(+0.673)#73 | 12.4%(-2.50)#2,253 |
| 74. | Tenino | 10.0% | 9.3%(+0.737)#74 | 12.4%(-2.44)#2,283 |
| 75. | Oakesdale | 10.0% | 9.3%(+0.737)#75 | 12.4%(-2.44)#2,313 |
| 76. | Tukwila | 10.1% | 9.3%(+0.835)#76 | 12.4%(-2.34)#2,343 |
| 77. | University Place | 10.3% | 9.3%(+1.00)#77 | 12.4%(-2.17)#2,382 |
| 78. | Bunk Foss | 10.3% | 9.3%(+1.08)#78 | 12.4%(-2.09)#2,398 |
| 79. | Airway Heights | 10.9% | 9.3%(+1.64)#79 | 12.4%(-1.53)#2,559 |
| 80. | Mabton | 11.0% | 9.3%(+1.70)#80 | 12.4%(-1.48)#2,581 |
| 81. | Federal Way | 11.0% | 9.3%(+1.73)#81 | 12.4%(-1.44)#2,593 |
| 82. | Vancouver | 11.0% | 9.3%(+1.78)#82 | 12.4%(-1.39)#2,610 |
| 83. | Elk Plain | 11.1% | 9.3%(+1.85)#83 | 12.4%(-1.32)#2,621 |
| 84. | Okanogan | 11.1% | 9.3%(+1.85)#84 | 12.4%(-1.32)#2,624 |
| 85. | Wauna | 11.2% | 9.3%(+1.97)#85 | 12.4%(-1.20)#2,694 |
| 86. | Tacoma | 11.6% | 9.3%(+2.36)#86 | 12.4%(-0.813)#2,801 |
| 87. | Spokane Valley | 11.8% | 9.3%(+2.53)#87 | 12.4%(-0.643)#2,868 |
| 88. | Washougal | 11.9% | 9.3%(+2.62)#88 | 12.4%(-0.554)#2,891 |
| 89. | Mount Vernon | 12.1% | 9.3%(+2.80)#89 | 12.4%(-0.371)#2,936 |
| 90. | Chehalis | 12.2% | 9.3%(+2.92)#90 | 12.4%(-0.250)#2,964 |
| 91. | Lake Goodwin | 12.2% | 9.3%(+2.96)#91 | 12.4%(-0.213)#2,975 |
| 92. | Artondale | 12.3% | 9.3%(+3.02)#92 | 12.4%(-0.155)#2,988 |
| 93. | Birch Bay | 12.3% | 9.3%(+3.05)#93 | 12.4%(-0.122)#2,996 |
| 94. | Bryn Mawr Skyway | 12.5% | 9.3%(+3.24)#94 | 12.4%(+0.065)#3,037 |
| 95. | Lacey | 12.6% | 9.3%(+3.34)#95 | 12.4%(+0.163)#3,115 |
| 96. | Neah Bay | 12.8% | 9.3%(+3.56)#96 | 12.4%(+0.385)#3,164 |
| 97. | North Lynnwood | 12.9% | 9.3%(+3.67)#97 | 12.4%(+0.494)#3,187 |
| 98. | Tanglewilde | 13.0% | 9.3%(+3.70)#98 | 12.4%(+0.528)#3,198 |
| 99. | Enetai | 13.3% | 9.3%(+4.07)#99 | 12.4%(+0.898)#3,290 |
| 100. | Fairwood Cdp King County | 13.4% | 9.3%(+4.19)#100 | 12.4%(+1.01)#3,335 |
Common Questions
What are the Top 10 Cities with the Lowest Poverty Level Among Single Males in Washington?
Top 10 Cities with the Lowest Poverty Level Among Single Males in Washington are:
#1
0.98%
#2
1.1%
#3
1.2%
#4
1.2%
#5
1.3%
#6
1.5%
#7
1.8%
#8
2.1%
#9
2.3%
#10
2.3%
What city has the Lowest Poverty Level Among Single Males in Washington?
Grandview has the Lowest Poverty Level Among Single Males in Washington with 0.98%.
What is the Poverty Level Among Single Males in the State of Washington?
Poverty Level Among Single Males in Washington is 9.3%.
What is the Poverty Level Among Single Males in the United States?
Poverty Level Among Single Males in the United States is 12.4%.