Creston, WA Map & Demographics
Creston Map
Creston Overview
$42,354
PER CAPITA INCOME
$82,250
AVG FAMILY INCOME
$54,792
AVG HOUSEHOLD INCOME
8.6%
WAGE / INCOME GAP [ % ]
91.4¢/ $1
WAGE / INCOME GAP [ $ ]
0.37
INEQUALITY / GINI INDEX
213
TOTAL POPULATION
128
MALE POPULATION
85
FEMALE POPULATION
150.59
MALES / 100 FEMALES
66.41
FEMALES / 100 MALES
61.8
MEDIAN AGE
2.6
AVG FAMILY SIZE
1.8
AVG HOUSEHOLD SIZE
74
LABOR FORCE [ PEOPLE ]
37.0%
PERCENT IN LABOR FORCE
Creston Zip Codes
Creston Area Codes
Income in Creston
Income Overview in Creston
Per Capita Income in Creston is $42,354, while median incomes of families and households are $82,250 and $54,792 respectively.
| Characteristic | Number | Measure |
| Per Capita Income | 213 | $42,354 |
| Median Family Income | 51 | $82,250 |
| Mean Family Income | 51 | $93,335 |
| Median Household Income | 119 | $54,792 |
| Mean Household Income | 119 | $70,347 |
| Income Deficit | 51 | $0 |
| Wage / Income Gap (%) | 213 | 8.55% |
| Wage / Income Gap ($) | 213 | 91.45¢ per $1 |
| Gini / Inequality Index | 213 | 0.37 |
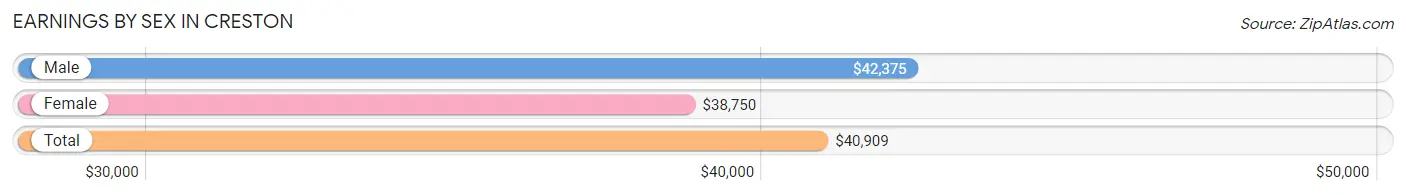
Earnings by Sex in Creston
Average Earnings in Creston are $40,909, $42,375 for men and $38,750 for women, a difference of 8.6%.
| Sex | Number | Average Earnings |
| Male | 61 (63.5%) | $42,375 |
| Female | 35 (36.5%) | $38,750 |
| Total | 96 (100.0%) | $40,909 |
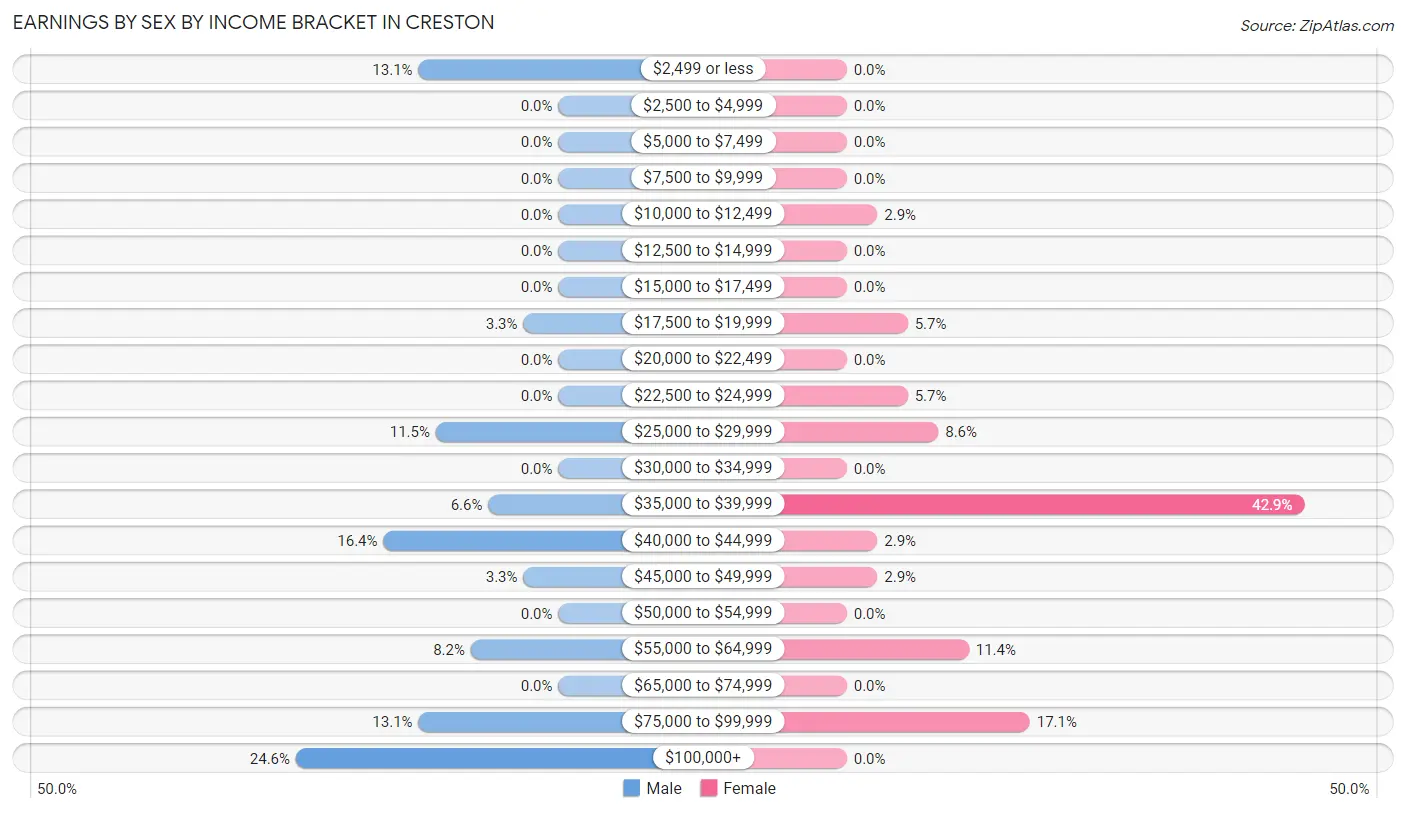
Earnings by Sex by Income Bracket in Creston
The most common earnings brackets in Creston are $100,000+ for men (15 | 24.6%) and $35,000 to $39,999 for women (15 | 42.9%).
| Income | Male | Female |
| $2,499 or less | 8 (13.1%) | 0 (0.0%) |
| $2,500 to $4,999 | 0 (0.0%) | 0 (0.0%) |
| $5,000 to $7,499 | 0 (0.0%) | 0 (0.0%) |
| $7,500 to $9,999 | 0 (0.0%) | 0 (0.0%) |
| $10,000 to $12,499 | 0 (0.0%) | 1 (2.9%) |
| $12,500 to $14,999 | 0 (0.0%) | 0 (0.0%) |
| $15,000 to $17,499 | 0 (0.0%) | 0 (0.0%) |
| $17,500 to $19,999 | 2 (3.3%) | 2 (5.7%) |
| $20,000 to $22,499 | 0 (0.0%) | 0 (0.0%) |
| $22,500 to $24,999 | 0 (0.0%) | 2 (5.7%) |
| $25,000 to $29,999 | 7 (11.5%) | 3 (8.6%) |
| $30,000 to $34,999 | 0 (0.0%) | 0 (0.0%) |
| $35,000 to $39,999 | 4 (6.6%) | 15 (42.9%) |
| $40,000 to $44,999 | 10 (16.4%) | 1 (2.9%) |
| $45,000 to $49,999 | 2 (3.3%) | 1 (2.9%) |
| $50,000 to $54,999 | 0 (0.0%) | 0 (0.0%) |
| $55,000 to $64,999 | 5 (8.2%) | 4 (11.4%) |
| $65,000 to $74,999 | 0 (0.0%) | 0 (0.0%) |
| $75,000 to $99,999 | 8 (13.1%) | 6 (17.1%) |
| $100,000+ | 15 (24.6%) | 0 (0.0%) |
| Total | 61 (100.0%) | 35 (100.0%) |
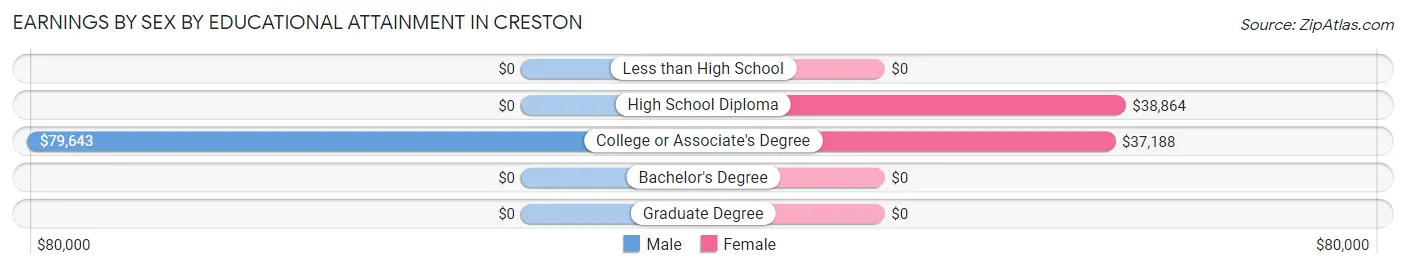
Earnings by Sex by Educational Attainment in Creston
Average earnings in Creston are $56,250 for men and $39,205 for women, a difference of 30.3%. Men with an educational attainment of college or associate's degree enjoy the highest average annual earnings of $79,643, while those with college or associate's degree education earn the least with $79,643. Women with an educational attainment of high school diploma earn the most with the average annual earnings of $38,864, while those with college or associate's degree education have the smallest earnings of $37,188.
| Educational Attainment | Male Income | Female Income |
| Less than High School | - | - |
| High School Diploma | - | - |
| College or Associate's Degree | $79,643 | $37,188 |
| Bachelor's Degree | - | - |
| Graduate Degree | - | - |
| Total | $56,250 | $39,205 |
Family Income in Creston
Family Income Brackets in Creston
According to the Creston family income data, there are 12 families falling into the $75,000 to $99,999 income range, which is the most common income bracket and makes up 23.5% of all families.
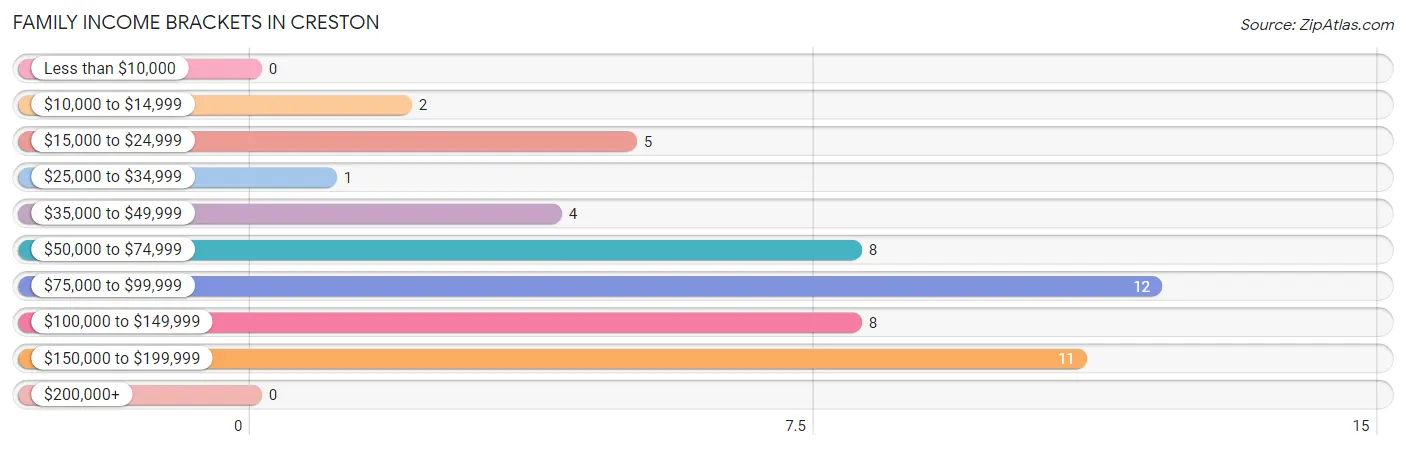
| Income Bracket | # Families | % Families |
| Less than $10,000 | 0 | 0.0% |
| $10,000 to $14,999 | 2 | 3.9% |
| $15,000 to $24,999 | 5 | 9.8% |
| $25,000 to $34,999 | 1 | 2.0% |
| $35,000 to $49,999 | 4 | 7.8% |
| $50,000 to $74,999 | 8 | 15.7% |
| $75,000 to $99,999 | 12 | 23.5% |
| $100,000 to $149,999 | 8 | 15.7% |
| $150,000 to $199,999 | 11 | 21.6% |
| $200,000+ | 0 | 0.0% |
Family Income by Famaliy Size in Creston
2-person families (43 | 84.3%) account for the highest median family income in Creston with $80,750 per family, while 2-person families (43 | 84.3%) have the highest median income of $40,375 per family member.
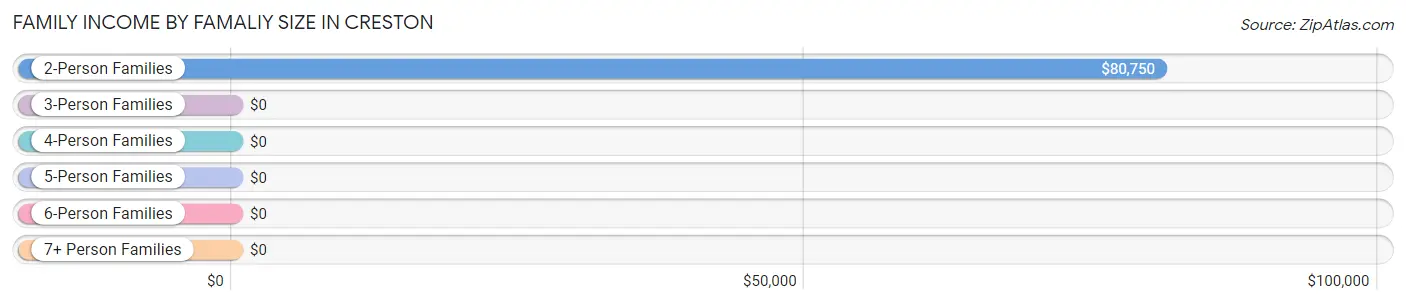
| Income Bracket | # Families | Median Income |
| 2-Person Families | 43 (84.3%) | $80,750 |
| 3-Person Families | 1 (2.0%) | $0 |
| 4-Person Families | 6 (11.8%) | $0 |
| 5-Person Families | 1 (2.0%) | $0 |
| 6-Person Families | 0 (0.0%) | $0 |
| 7+ Person Families | 0 (0.0%) | $0 |
| Total | 51 (100.0%) | $82,250 |
Family Income by Number of Earners in Creston
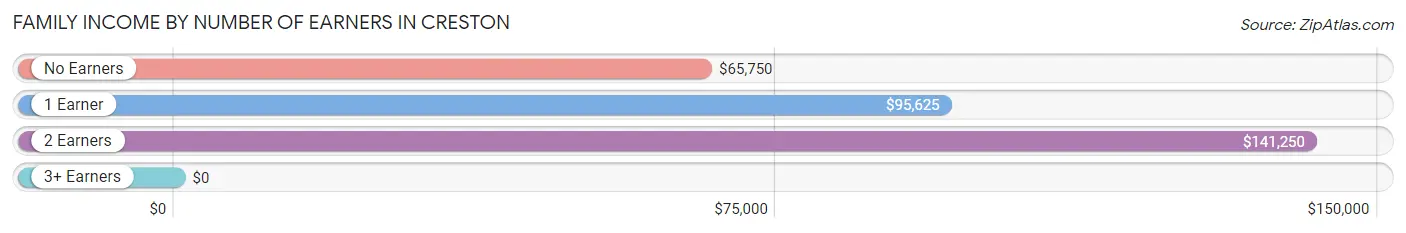
| Number of Earners | # Families | Median Income |
| No Earners | 29 (56.9%) | $65,750 |
| 1 Earner | 6 (11.8%) | $95,625 |
| 2 Earners | 10 (19.6%) | $141,250 |
| 3+ Earners | 6 (11.8%) | $0 |
| Total | 51 (100.0%) | $82,250 |
Household Income in Creston
Household Income Brackets in Creston
With 31 households falling in the category, the $50,000 to $74,999 income range is the most frequent in Creston, accounting for 26.1% of all households.
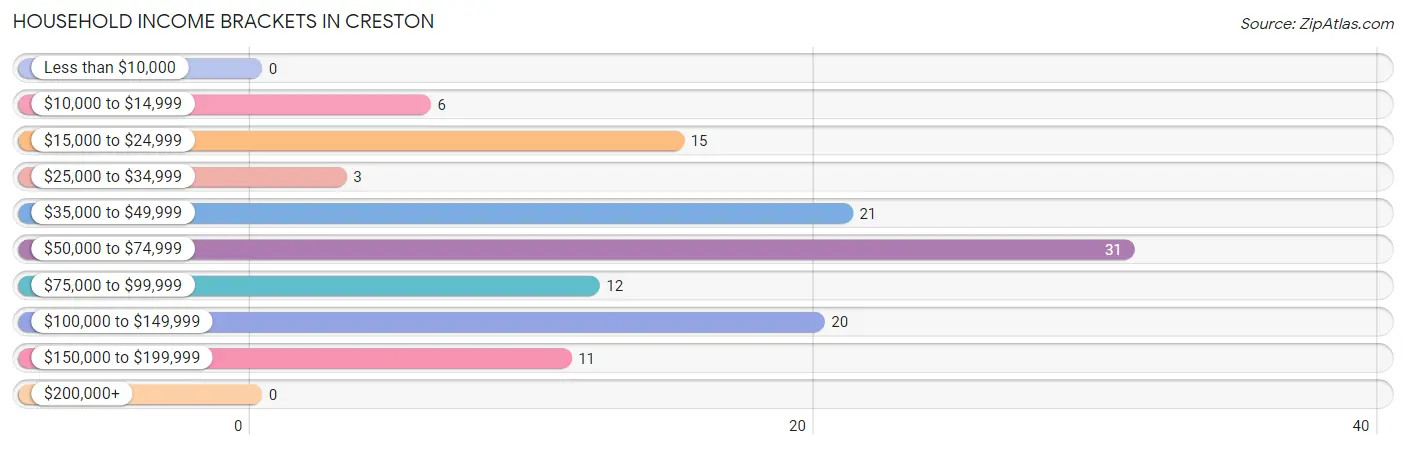
| Income Bracket | # Households | % Households |
| Less than $10,000 | 0 | 0.0% |
| $10,000 to $14,999 | 6 | 5.0% |
| $15,000 to $24,999 | 15 | 12.6% |
| $25,000 to $34,999 | 3 | 2.5% |
| $35,000 to $49,999 | 21 | 17.6% |
| $50,000 to $74,999 | 31 | 26.1% |
| $75,000 to $99,999 | 12 | 10.1% |
| $100,000 to $149,999 | 20 | 16.8% |
| $150,000 to $199,999 | 11 | 9.2% |
| $200,000+ | 0 | 0.0% |
Household Income by Householder Age in Creston
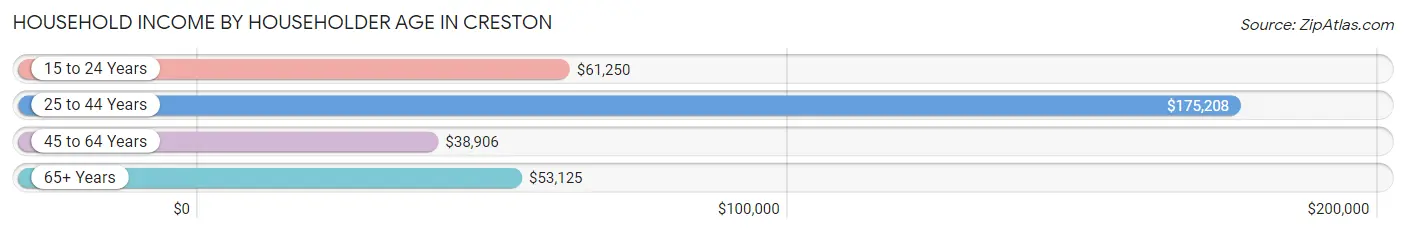
The median household income in Creston is $54,792, with the highest median household income of $175,208 found in the 25 to 44 years age bracket for the primary householder. A total of 19 households (16.0%) fall into this category. Meanwhile, the 45 to 64 years age bracket for the primary householder has the lowest median household income of $38,906, with 37 households (31.1%) in this group.
| Income Bracket | # Households | Median Income |
| 15 to 24 Years | 8 (6.7%) | $61,250 |
| 25 to 44 Years | 19 (16.0%) | $175,208 |
| 45 to 64 Years | 37 (31.1%) | $38,906 |
| 65+ Years | 55 (46.2%) | $53,125 |
| Total | 119 (100.0%) | $54,792 |
Poverty in Creston
Income Below Poverty by Sex and Age in Creston
With 3.9% poverty level for males and 7.1% for females among the residents of Creston, 18 to 24 year old males and under 5 year old females are the most vulnerable to poverty, with 3 males (60.0%) and 1 females (100.0%) in their respective age groups living below the poverty level.
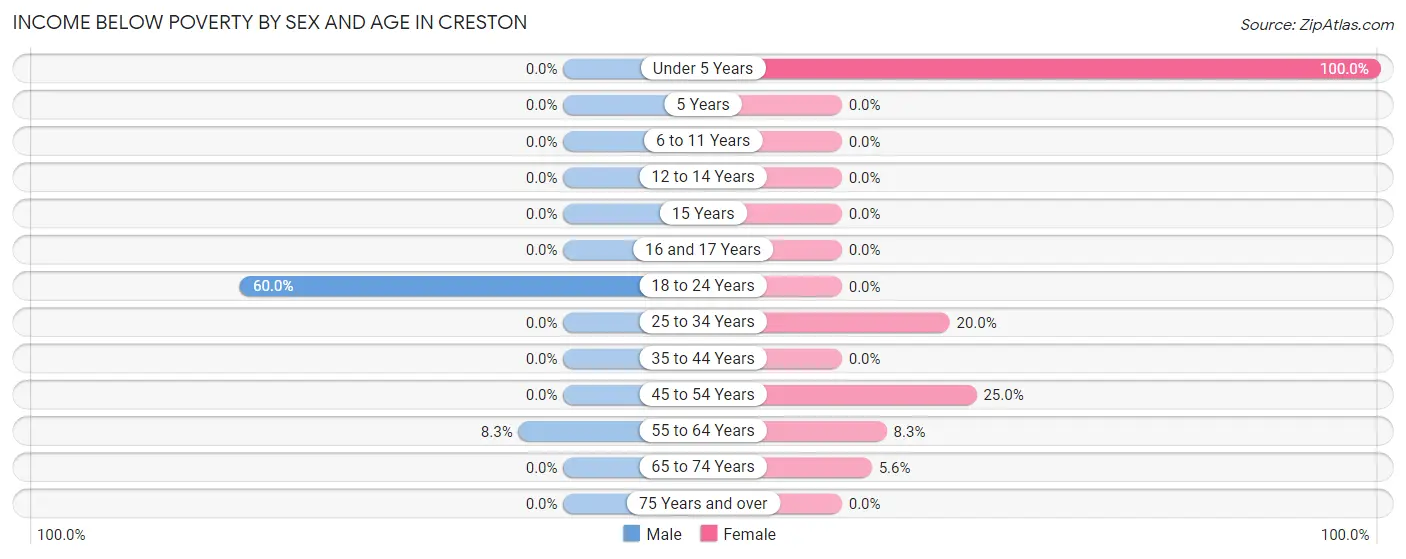
| Age Bracket | Male | Female |
| Under 5 Years | 0 (0.0%) | 1 (100.0%) |
| 5 Years | 0 (0.0%) | 0 (0.0%) |
| 6 to 11 Years | 0 (0.0%) | 0 (0.0%) |
| 12 to 14 Years | 0 (0.0%) | 0 (0.0%) |
| 15 Years | 0 (0.0%) | 0 (0.0%) |
| 16 and 17 Years | 0 (0.0%) | 0 (0.0%) |
| 18 to 24 Years | 3 (60.0%) | 0 (0.0%) |
| 25 to 34 Years | 0 (0.0%) | 1 (20.0%) |
| 35 to 44 Years | 0 (0.0%) | 0 (0.0%) |
| 45 to 54 Years | 0 (0.0%) | 2 (25.0%) |
| 55 to 64 Years | 2 (8.3%) | 1 (8.3%) |
| 65 to 74 Years | 0 (0.0%) | 1 (5.6%) |
| 75 Years and over | 0 (0.0%) | 0 (0.0%) |
| Total | 5 (3.9%) | 6 (7.1%) |
Income Above Poverty by Sex and Age in Creston
According to the poverty statistics in Creston, males aged 12 to 14 years and females aged 18 to 24 years are the age groups that are most secure financially, with 100.0% of males and 100.0% of females in these age groups living above the poverty line.
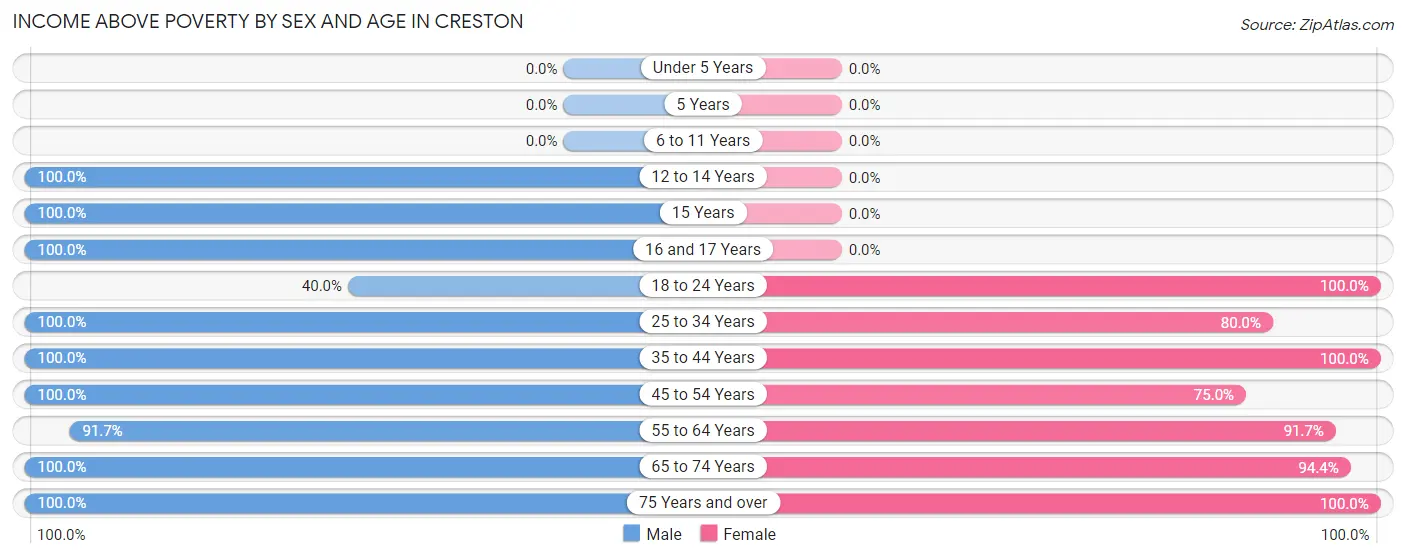
| Age Bracket | Male | Female |
| Under 5 Years | 0 (0.0%) | 0 (0.0%) |
| 5 Years | 0 (0.0%) | 0 (0.0%) |
| 6 to 11 Years | 0 (0.0%) | 0 (0.0%) |
| 12 to 14 Years | 4 (100.0%) | 0 (0.0%) |
| 15 Years | 8 (100.0%) | 0 (0.0%) |
| 16 and 17 Years | 12 (100.0%) | 0 (0.0%) |
| 18 to 24 Years | 2 (40.0%) | 4 (100.0%) |
| 25 to 34 Years | 17 (100.0%) | 4 (80.0%) |
| 35 to 44 Years | 14 (100.0%) | 12 (100.0%) |
| 45 to 54 Years | 1 (100.0%) | 6 (75.0%) |
| 55 to 64 Years | 22 (91.7%) | 11 (91.7%) |
| 65 to 74 Years | 26 (100.0%) | 17 (94.4%) |
| 75 Years and over | 17 (100.0%) | 25 (100.0%) |
| Total | 123 (96.1%) | 79 (92.9%) |
Income Below Poverty Among Married-Couple Families in Creston
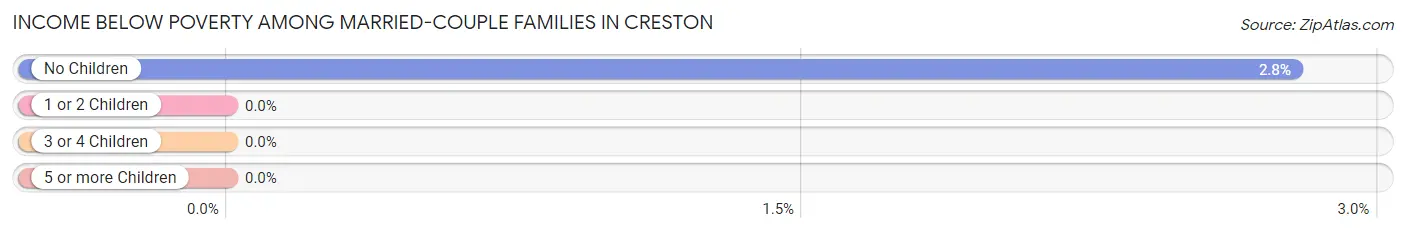
The poverty statistics for married-couple families in Creston show that 2.3% or 1 of the total 44 families live below the poverty line. Families with no children have the highest poverty rate of 2.8%, comprising of 1 families. On the other hand, families with 1 or 2 children have the lowest poverty rate of 0.0%, which includes 0 families.
| Children | Above Poverty | Below Poverty |
| No Children | 35 (97.2%) | 1 (2.8%) |
| 1 or 2 Children | 7 (100.0%) | 0 (0.0%) |
| 3 or 4 Children | 1 (100.0%) | 0 (0.0%) |
| 5 or more Children | 0 (0.0%) | 0 (0.0%) |
| Total | 43 (97.7%) | 1 (2.3%) |
Income Below Poverty Among Single-Parent Households in Creston
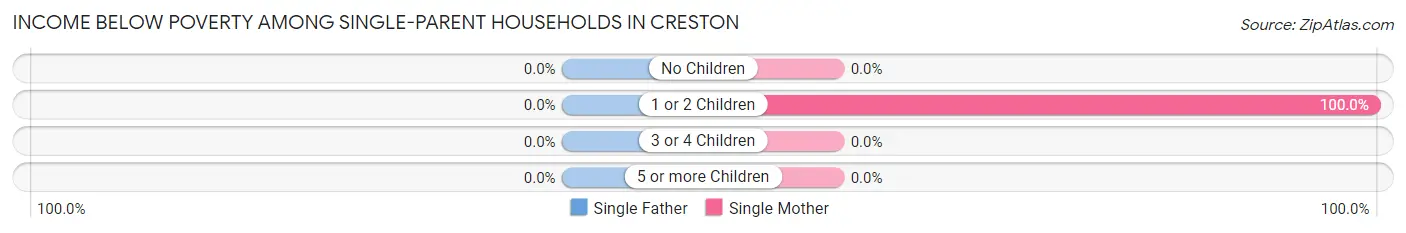
| Children | Single Father | Single Mother |
| No Children | 0 (0.0%) | 0 (0.0%) |
| 1 or 2 Children | 0 (0.0%) | 1 (100.0%) |
| 3 or 4 Children | 0 (0.0%) | 0 (0.0%) |
| 5 or more Children | 0 (0.0%) | 0 (0.0%) |
| Total | 0 (0.0%) | 1 (14.3%) |
Income Below Poverty Among Married-Couple vs Single-Parent Households in Creston
The poverty data for Creston shows that 1 of the married-couple family households (2.3%) and 1 of the single-parent households (14.3%) are living below the poverty level. Within the married-couple family households, those with no children have the highest poverty rate, with 1 households (2.8%) falling below the poverty line. Among the single-parent households, those with 1 or 2 children have the highest poverty rate, with 1 household (100.0%) living below poverty.
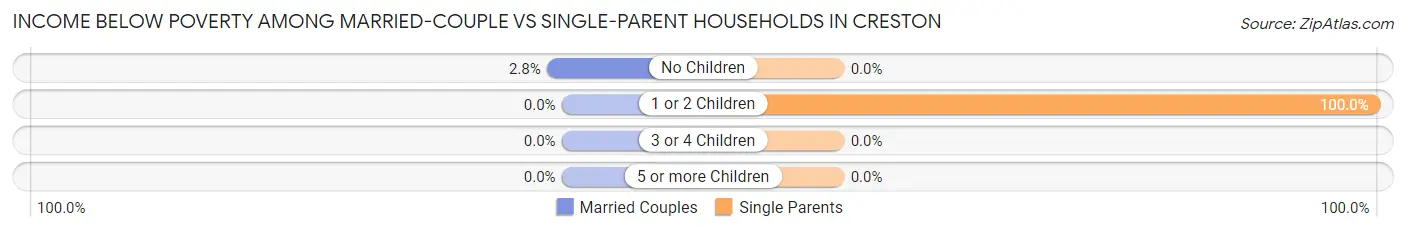
| Children | Married-Couple Families | Single-Parent Households |
| No Children | 1 (2.8%) | 0 (0.0%) |
| 1 or 2 Children | 0 (0.0%) | 1 (100.0%) |
| 3 or 4 Children | 0 (0.0%) | 0 (0.0%) |
| 5 or more Children | 0 (0.0%) | 0 (0.0%) |
| Total | 1 (2.3%) | 1 (14.3%) |
Race in Creston
The most populous races in Creston are White / Caucasian (207 | 97.2%), Two or more Races (4 | 1.9%), and Hawaiian / Pacific (1 | 0.5%).
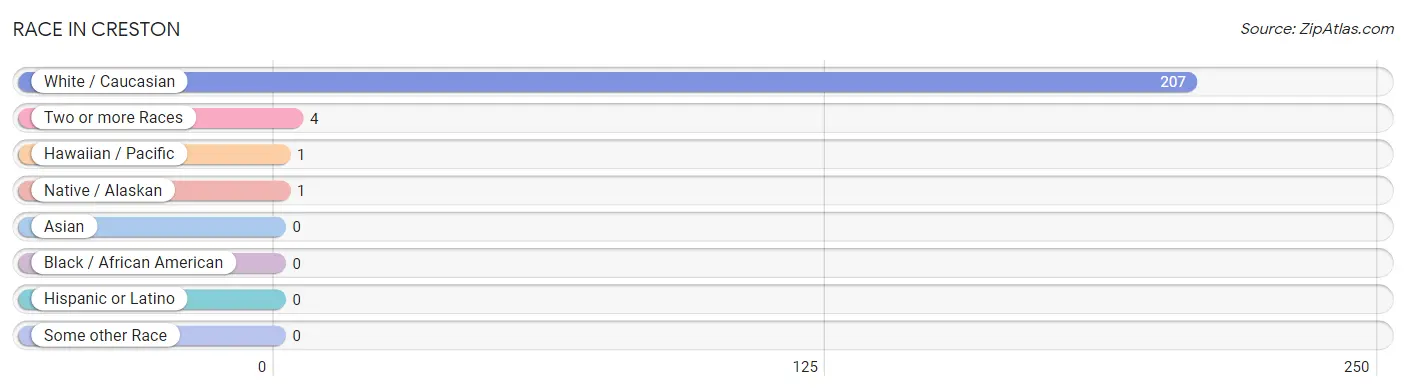
| Race | # Population | % Population |
| Asian | 0 | 0.0% |
| Black / African American | 0 | 0.0% |
| Hawaiian / Pacific | 1 | 0.5% |
| Hispanic or Latino | 0 | 0.0% |
| Native / Alaskan | 1 | 0.5% |
| White / Caucasian | 207 | 97.2% |
| Two or more Races | 4 | 1.9% |
| Some other Race | 0 | 0.0% |
| Total | 213 | 100.0% |
Ancestry in Creston
The most populous ancestries reported in Creston are American (56 | 26.3%), German (46 | 21.6%), Irish (28 | 13.2%), English (13 | 6.1%), and Italian (11 | 5.2%), together accounting for 72.3% of all Creston residents.
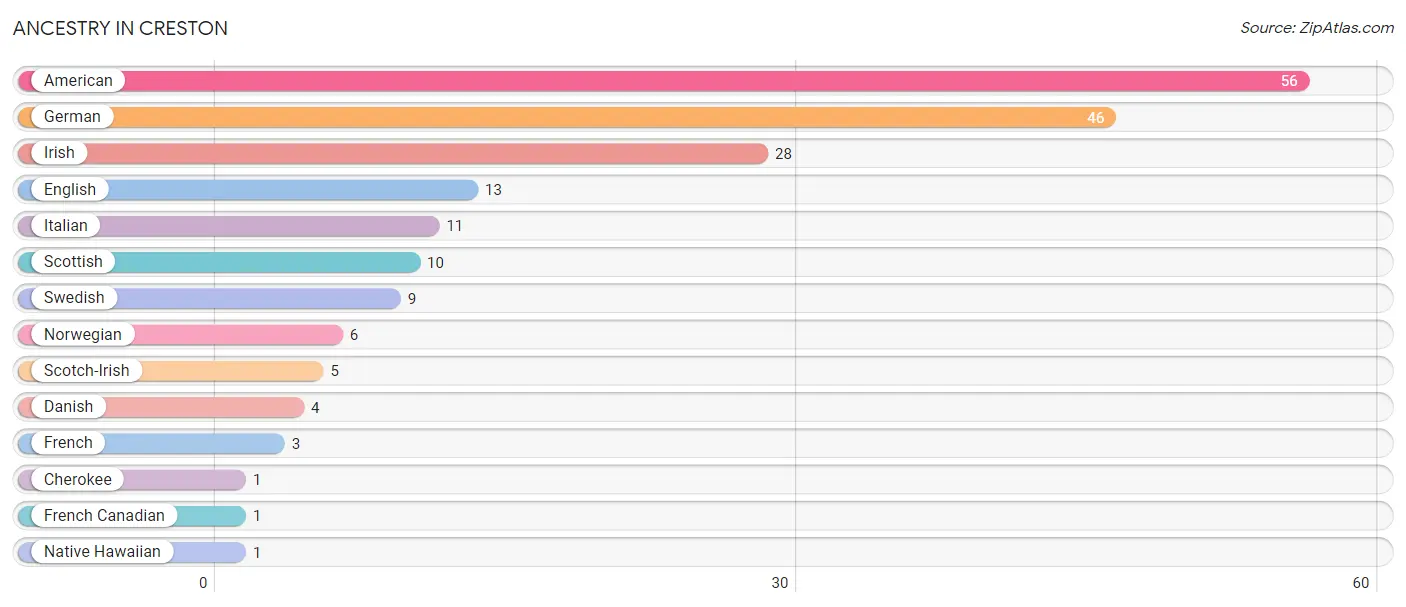
| Ancestry | # Population | % Population |
| American | 56 | 26.3% |
| Cherokee | 1 | 0.5% |
| Danish | 4 | 1.9% |
| English | 13 | 6.1% |
| French | 3 | 1.4% |
| French Canadian | 1 | 0.5% |
| German | 46 | 21.6% |
| Irish | 28 | 13.2% |
| Italian | 11 | 5.2% |
| Native Hawaiian | 1 | 0.5% |
| Norwegian | 6 | 2.8% |
| Scotch-Irish | 5 | 2.4% |
| Scottish | 10 | 4.7% |
| Swedish | 9 | 4.2% | View All 14 Rows |
Immigrants in Creston
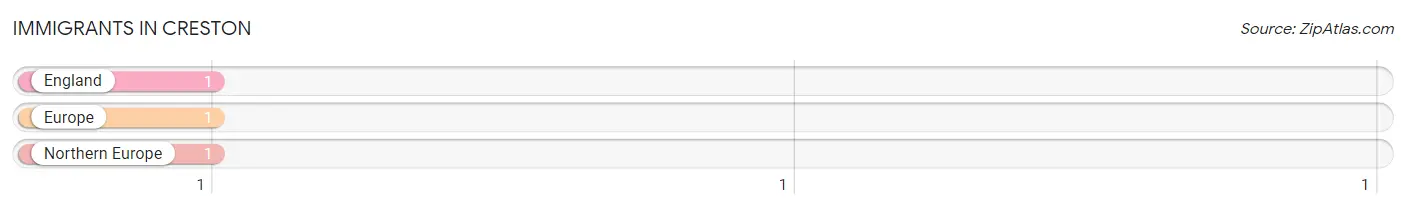
The most numerous immigrant groups reported in Creston came from England (1 | 0.5%), Europe (1 | 0.5%), and Northern Europe (1 | 0.5%), together accounting for 1.4% of all Creston residents.
| Immigration Origin | # Population | % Population |
| England | 1 | 0.5% |
| Europe | 1 | 0.5% |
| Northern Europe | 1 | 0.5% | View All 3 Rows |
Sex and Age in Creston
Sex and Age in Creston
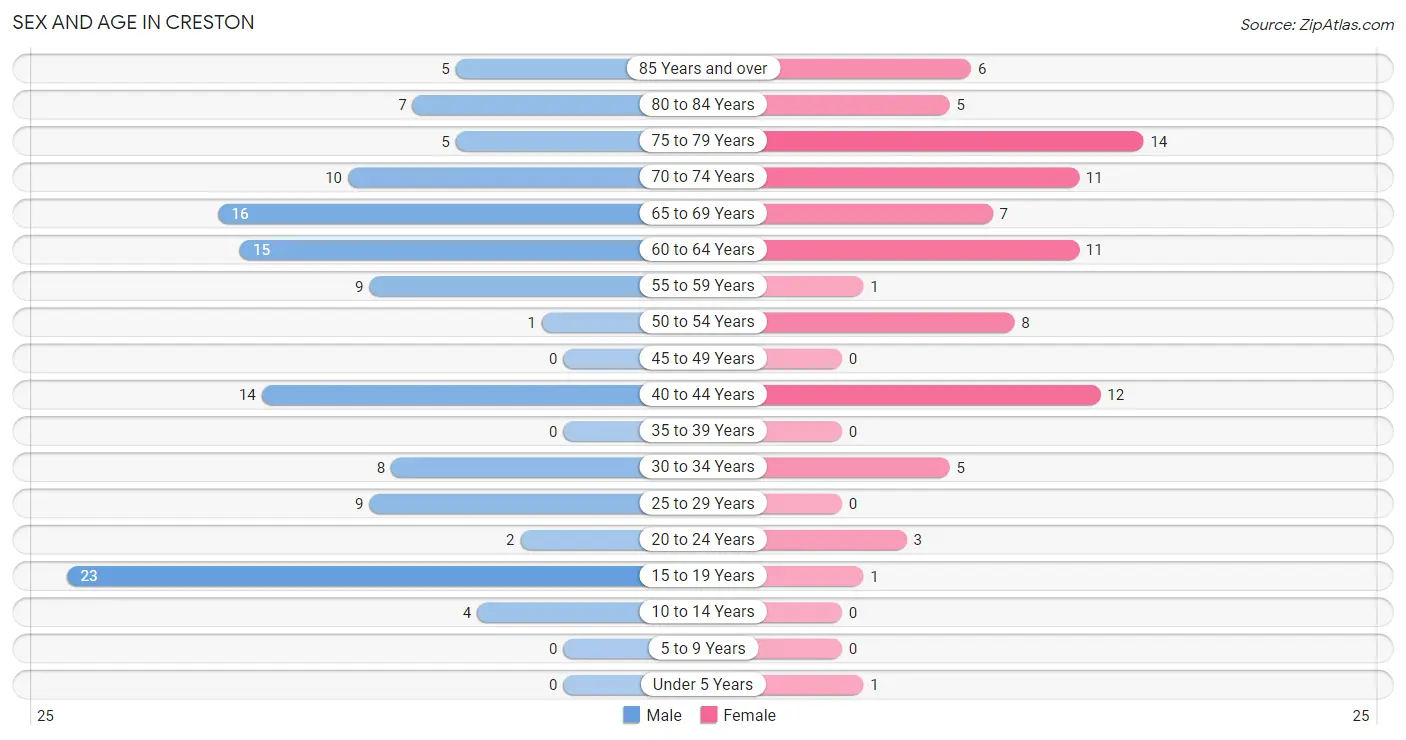
The most populous age groups in Creston are 15 to 19 Years (23 | 18.0%) for men and 75 to 79 Years (14 | 16.5%) for women.
| Age Bracket | Male | Female |
| Under 5 Years | 0 (0.0%) | 1 (1.2%) |
| 5 to 9 Years | 0 (0.0%) | 0 (0.0%) |
| 10 to 14 Years | 4 (3.1%) | 0 (0.0%) |
| 15 to 19 Years | 23 (18.0%) | 1 (1.2%) |
| 20 to 24 Years | 2 (1.6%) | 3 (3.5%) |
| 25 to 29 Years | 9 (7.0%) | 0 (0.0%) |
| 30 to 34 Years | 8 (6.2%) | 5 (5.9%) |
| 35 to 39 Years | 0 (0.0%) | 0 (0.0%) |
| 40 to 44 Years | 14 (10.9%) | 12 (14.1%) |
| 45 to 49 Years | 0 (0.0%) | 0 (0.0%) |
| 50 to 54 Years | 1 (0.8%) | 8 (9.4%) |
| 55 to 59 Years | 9 (7.0%) | 1 (1.2%) |
| 60 to 64 Years | 15 (11.7%) | 11 (12.9%) |
| 65 to 69 Years | 16 (12.5%) | 7 (8.2%) |
| 70 to 74 Years | 10 (7.8%) | 11 (12.9%) |
| 75 to 79 Years | 5 (3.9%) | 14 (16.5%) |
| 80 to 84 Years | 7 (5.5%) | 5 (5.9%) |
| 85 Years and over | 5 (3.9%) | 6 (7.1%) |
| Total | 128 (100.0%) | 85 (100.0%) |
Families and Households in Creston
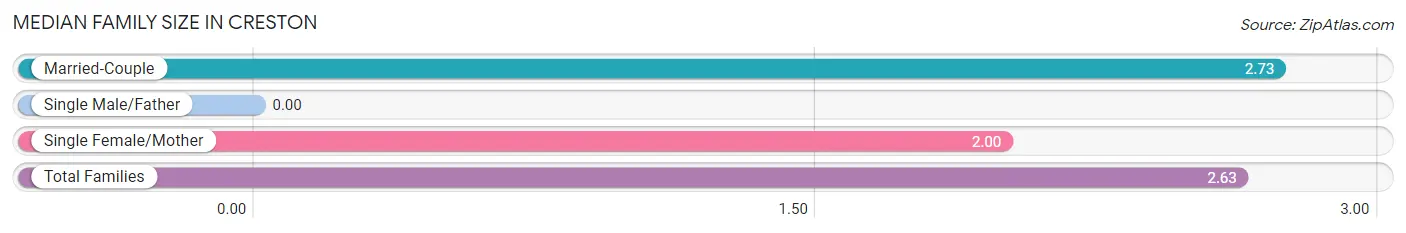
Median Family Size in Creston
| Family Type | # Families | Family Size |
| Married-Couple | 44 (86.3%) | 2.73 |
| Single Male/Father | 0 (0.0%) | - |
| Single Female/Mother | 7 (13.7%) | 2.00 |
| Total Families | 51 (100.0%) | 2.63 |
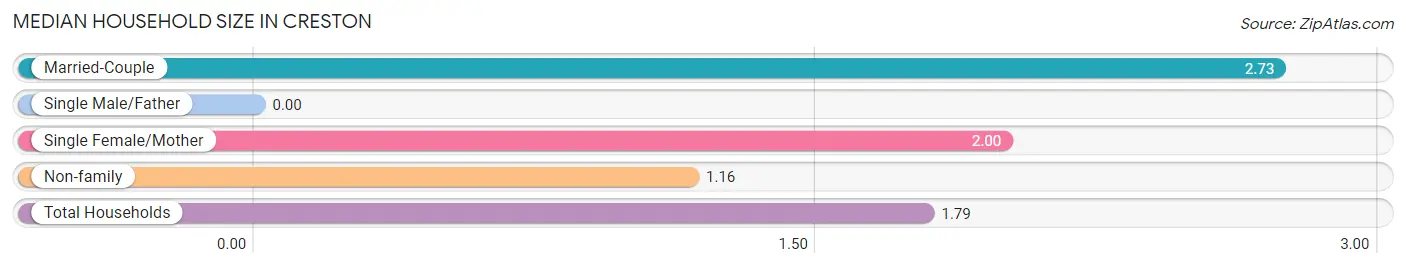
Median Household Size in Creston
| Household Type | # Households | Household Size |
| Married-Couple | 44 (37.0%) | 2.73 |
| Single Male/Father | 0 (0.0%) | - |
| Single Female/Mother | 7 (5.9%) | 2.00 |
| Non-family | 68 (57.1%) | 1.16 |
| Total Households | 119 (100.0%) | 1.79 |
Household Size by Marriage Status in Creston
Out of a total of 119 households in Creston, 51 (42.9%) are family households, while 68 (57.1%) are nonfamily households. The most numerous type of family households are 2-person households, comprising 43, and the most common type of nonfamily households are 1-person households, comprising 56.
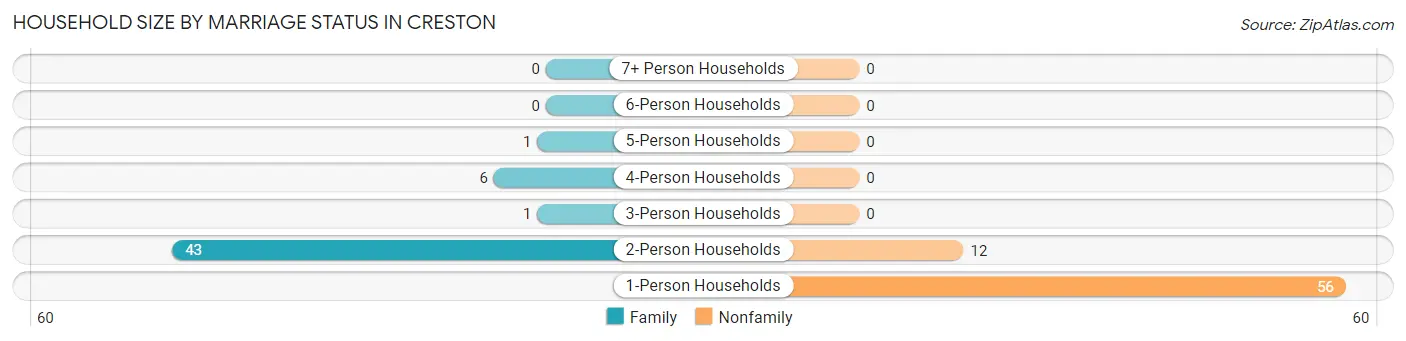
| Household Size | Family Households | Nonfamily Households |
| 1-Person Households | - | 56 (47.1%) |
| 2-Person Households | 43 (36.1%) | 12 (10.1%) |
| 3-Person Households | 1 (0.8%) | 0 (0.0%) |
| 4-Person Households | 6 (5.0%) | 0 (0.0%) |
| 5-Person Households | 1 (0.8%) | 0 (0.0%) |
| 6-Person Households | 0 (0.0%) | 0 (0.0%) |
| 7+ Person Households | 0 (0.0%) | 0 (0.0%) |
| Total | 51 (42.9%) | 68 (57.1%) |
Female Fertility in Creston
Fertility by Age in Creston
| Age Bracket | Women with Births | Births / 1,000 Women |
| 15 to 19 years | 0 (0.0%) | 0.0 |
| 20 to 34 years | 0 (0.0%) | 0.0 |
| 35 to 50 years | 0 (0.0%) | 0.0 |
| Total | 0 (0.0%) | 0.0 |
Fertility by Age by Marriage Status in Creston
| Age Bracket | Married | Unmarried |
| 15 to 19 years | 0 (0.0%) | 0 (0.0%) |
| 20 to 34 years | 0 (0.0%) | 0 (0.0%) |
| 35 to 50 years | 0 (0.0%) | 0 (0.0%) |
| Total | 0 (0.0%) | 0 (0.0%) |
Fertility by Education in Creston
| Educational Attainment | Women with Births | Births / 1,000 Women |
| Less than High School | 0 (0.0%) | 0.0 |
| High School Diploma | 0 (0.0%) | 0.0 |
| College or Associate's Degree | 0 (0.0%) | 0.0 |
| Bachelor's Degree | 0 (0.0%) | 0.0 |
| Graduate Degree | 0 (0.0%) | 0.0 |
| Total | 0 (0.0%) | 0.0 |
Fertility by Education by Marriage Status in Creston
| Educational Attainment | Married | Unmarried |
| Less than High School | 0 (0.0%) | 0 (0.0%) |
| High School Diploma | 0 (0.0%) | 0 (0.0%) |
| College or Associate's Degree | 0 (0.0%) | 0 (0.0%) |
| Bachelor's Degree | 0 (0.0%) | 0 (0.0%) |
| Graduate Degree | 0 (0.0%) | 0 (0.0%) |
| Total | 0 (0.0%) | 0 (0.0%) |
Employment Characteristics in Creston
Employment by Class of Employer in Creston
Among the 74 employed individuals in Creston, private company employees (34 | 46.0%), not-for-profit organizations (18 | 24.3%), and local government employees (10 | 13.5%) make up the most common classes of employment.
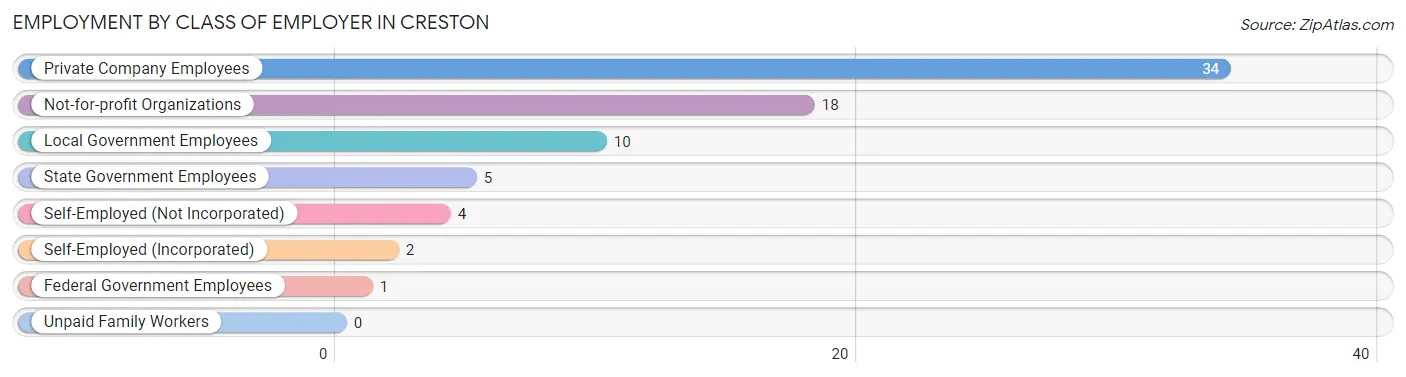
| Employer Class | # Employees | % Employees |
| Private Company Employees | 34 | 46.0% |
| Self-Employed (Incorporated) | 2 | 2.7% |
| Self-Employed (Not Incorporated) | 4 | 5.4% |
| Not-for-profit Organizations | 18 | 24.3% |
| Local Government Employees | 10 | 13.5% |
| State Government Employees | 5 | 6.8% |
| Federal Government Employees | 1 | 1.3% |
| Unpaid Family Workers | 0 | 0.0% |
| Total | 74 | 100.0% |
Employment Status by Age in Creston
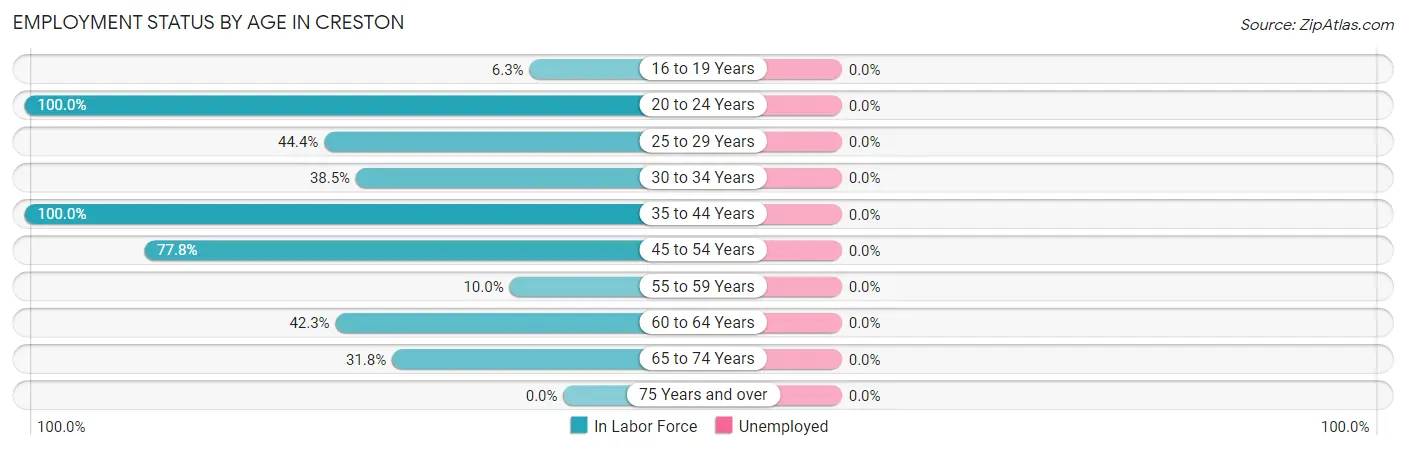
| Age Bracket | In Labor Force | Unemployed |
| 16 to 19 Years | 1 (6.3%) | 0 (0.0%) |
| 20 to 24 Years | 5 (100.0%) | 0 (0.0%) |
| 25 to 29 Years | 4 (44.4%) | 0 (0.0%) |
| 30 to 34 Years | 5 (38.5%) | 0 (0.0%) |
| 35 to 44 Years | 26 (100.0%) | 0 (0.0%) |
| 45 to 54 Years | 7 (77.8%) | 0 (0.0%) |
| 55 to 59 Years | 1 (10.0%) | 0 (0.0%) |
| 60 to 64 Years | 11 (42.3%) | 0 (0.0%) |
| 65 to 74 Years | 14 (31.8%) | 0 (0.0%) |
| 75 Years and over | 0 (0.0%) | 0 (0.0%) |
| Total | 74 (37.0%) | 0 (0.0%) |
Employment Status by Educational Attainment in Creston
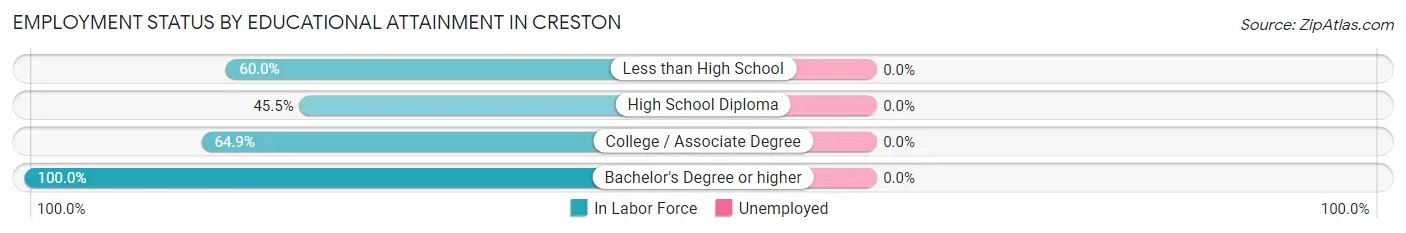
| Educational Attainment | In Labor Force | Unemployed |
| Less than High School | 3 (60.0%) | 0 (0.0%) |
| High School Diploma | 20 (45.5%) | 0 (0.0%) |
| College / Associate Degree | 24 (64.9%) | 0 (0.0%) |
| Bachelor's Degree or higher | 7 (100.0%) | 0 (0.0%) |
| Total | 54 (58.1%) | 0 (0.0%) |
Employment Occupations by Sex in Creston
Management, Business, Science and Arts Occupations
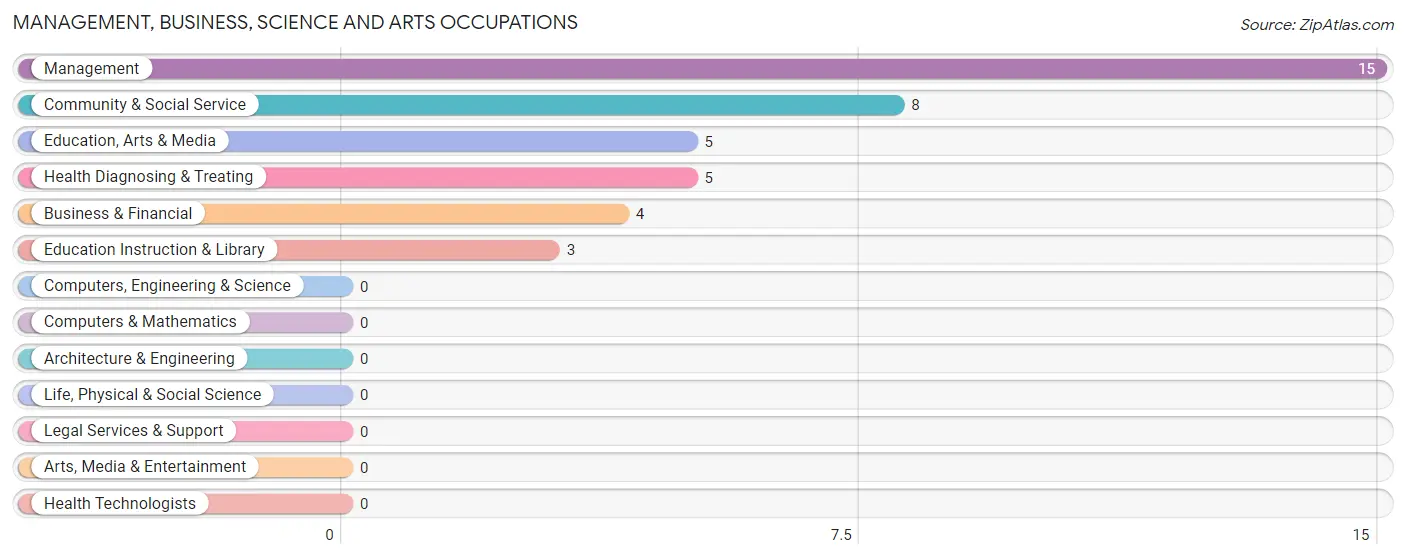
The most common Management, Business, Science and Arts occupations in Creston are Management (15 | 20.3%), Community & Social Service (8 | 10.8%), Education, Arts & Media (5 | 6.8%), Health Diagnosing & Treating (5 | 6.8%), and Business & Financial (4 | 5.4%).
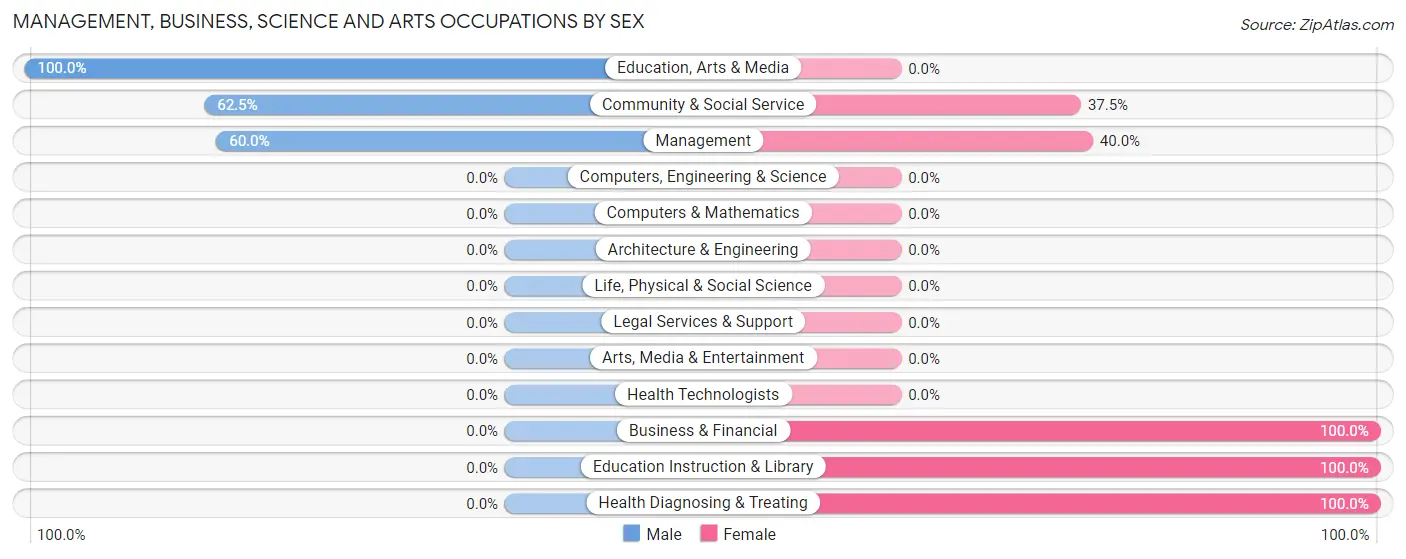
Management, Business, Science and Arts Occupations by Sex
Within the Management, Business, Science and Arts occupations in Creston, the most male-oriented occupations are Education, Arts & Media (100.0%), Community & Social Service (62.5%), and Management (60.0%), while the most female-oriented occupations are Business & Financial (100.0%), Education Instruction & Library (100.0%), and Health Diagnosing & Treating (100.0%).
| Occupation | Male | Female |
| Management | 9 (60.0%) | 6 (40.0%) |
| Business & Financial | 0 (0.0%) | 4 (100.0%) |
| Computers, Engineering & Science | 0 (0.0%) | 0 (0.0%) |
| Computers & Mathematics | 0 (0.0%) | 0 (0.0%) |
| Architecture & Engineering | 0 (0.0%) | 0 (0.0%) |
| Life, Physical & Social Science | 0 (0.0%) | 0 (0.0%) |
| Community & Social Service | 5 (62.5%) | 3 (37.5%) |
| Education, Arts & Media | 5 (100.0%) | 0 (0.0%) |
| Legal Services & Support | 0 (0.0%) | 0 (0.0%) |
| Education Instruction & Library | 0 (0.0%) | 3 (100.0%) |
| Arts, Media & Entertainment | 0 (0.0%) | 0 (0.0%) |
| Health Diagnosing & Treating | 0 (0.0%) | 5 (100.0%) |
| Health Technologists | 0 (0.0%) | 0 (0.0%) |
| Total (Category) | 14 (43.8%) | 18 (56.2%) |
| Total (Overall) | 39 (52.7%) | 35 (47.3%) |
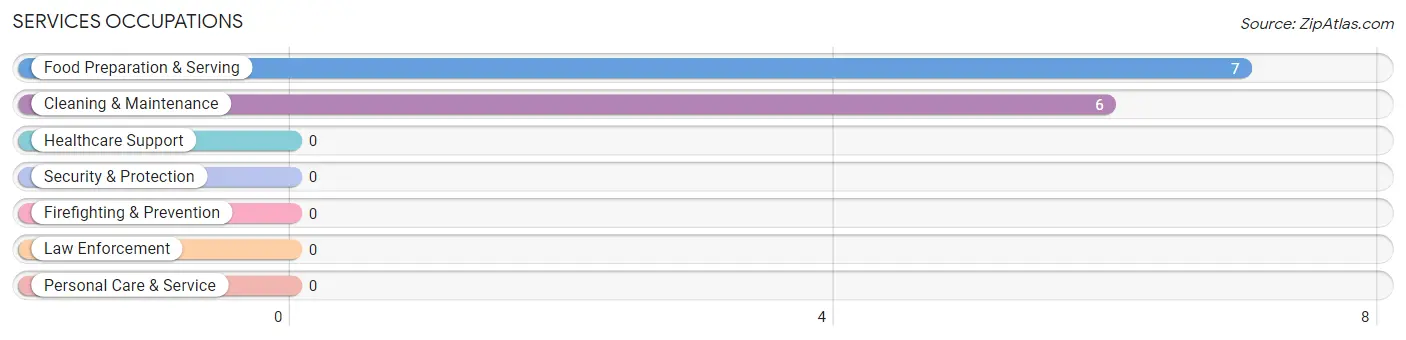
Services Occupations
The most common Services occupations in Creston are Food Preparation & Serving (7 | 9.5%), and Cleaning & Maintenance (6 | 8.1%).
Services Occupations by Sex
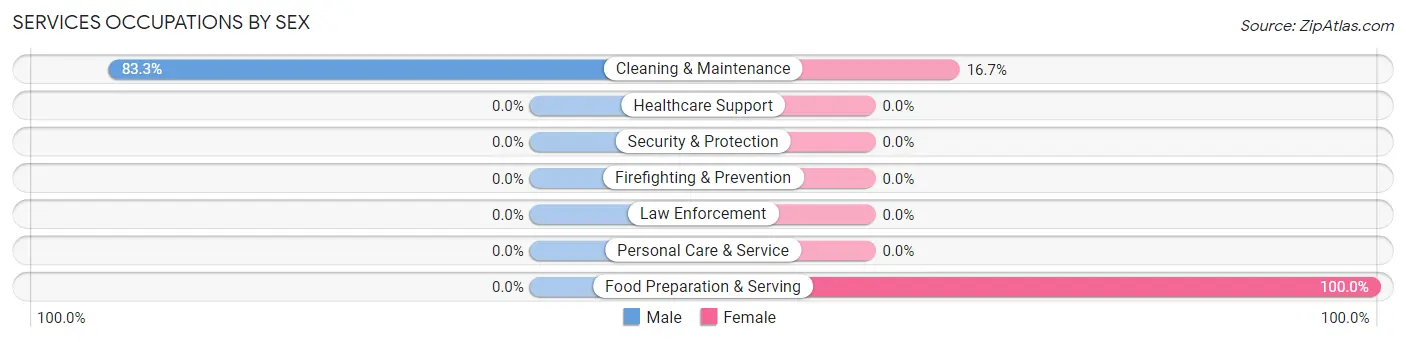
| Occupation | Male | Female |
| Healthcare Support | 0 (0.0%) | 0 (0.0%) |
| Security & Protection | 0 (0.0%) | 0 (0.0%) |
| Firefighting & Prevention | 0 (0.0%) | 0 (0.0%) |
| Law Enforcement | 0 (0.0%) | 0 (0.0%) |
| Food Preparation & Serving | 0 (0.0%) | 7 (100.0%) |
| Cleaning & Maintenance | 5 (83.3%) | 1 (16.7%) |
| Personal Care & Service | 0 (0.0%) | 0 (0.0%) |
| Total (Category) | 5 (38.5%) | 8 (61.5%) |
| Total (Overall) | 39 (52.7%) | 35 (47.3%) |
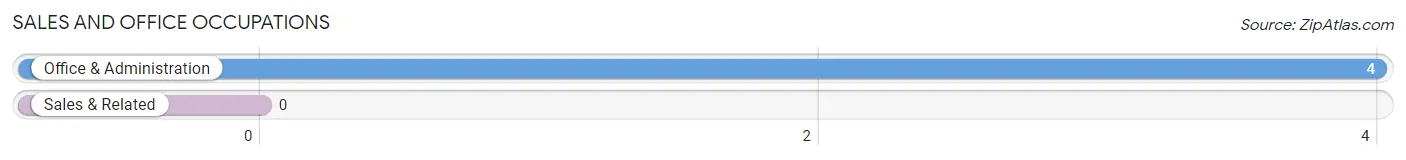
Sales and Office Occupations
The most common Sales and Office occupations in Creston are , and Office & Administration (4 | 5.4%).
Sales and Office Occupations by Sex
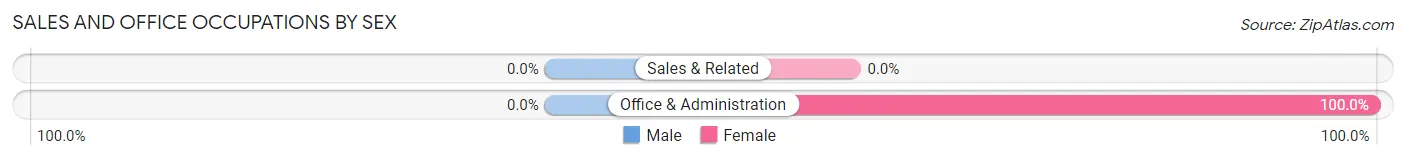
| Occupation | Male | Female |
| Sales & Related | 0 (0.0%) | 0 (0.0%) |
| Office & Administration | 0 (0.0%) | 4 (100.0%) |
| Total (Category) | 0 (0.0%) | 4 (100.0%) |
| Total (Overall) | 39 (52.7%) | 35 (47.3%) |
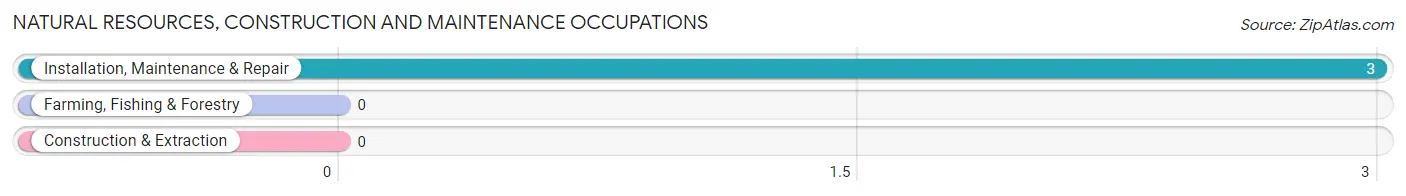
Natural Resources, Construction and Maintenance Occupations
The most common Natural Resources, Construction and Maintenance occupations in Creston are , and Installation, Maintenance & Repair (3 | 4.1%).
Natural Resources, Construction and Maintenance Occupations by Sex
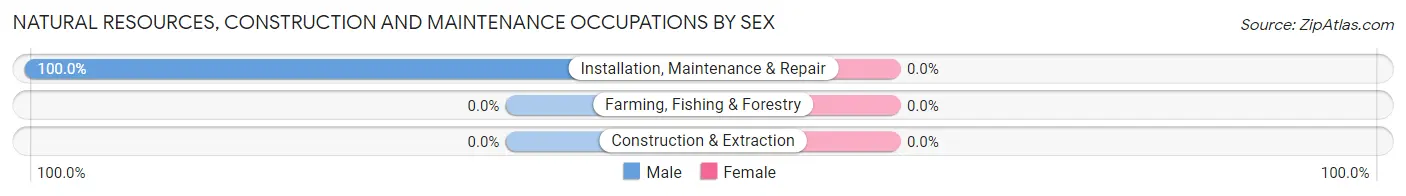
| Occupation | Male | Female |
| Farming, Fishing & Forestry | 0 (0.0%) | 0 (0.0%) |
| Construction & Extraction | 0 (0.0%) | 0 (0.0%) |
| Installation, Maintenance & Repair | 3 (100.0%) | 0 (0.0%) |
| Total (Category) | 3 (100.0%) | 0 (0.0%) |
| Total (Overall) | 39 (52.7%) | 35 (47.3%) |
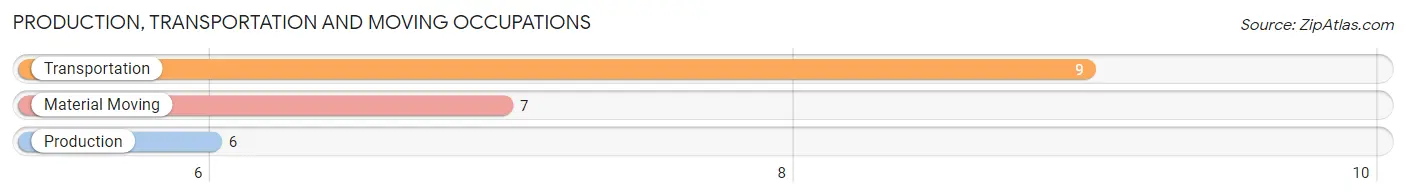
Production, Transportation and Moving Occupations
The most common Production, Transportation and Moving occupations in Creston are Transportation (9 | 12.2%), Material Moving (7 | 9.5%), and Production (6 | 8.1%).
Production, Transportation and Moving Occupations by Sex
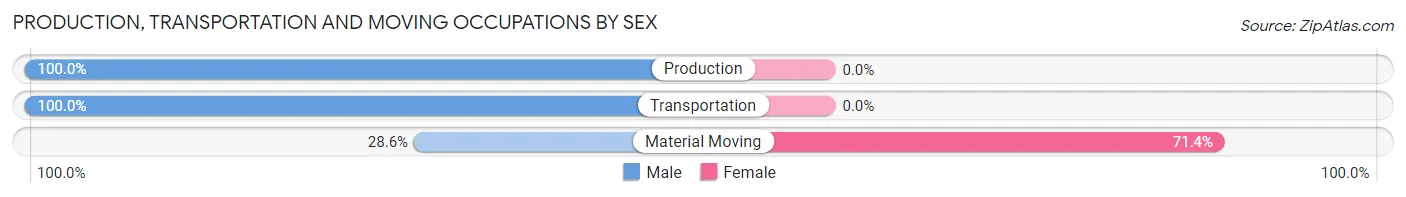
| Occupation | Male | Female |
| Production | 6 (100.0%) | 0 (0.0%) |
| Transportation | 9 (100.0%) | 0 (0.0%) |
| Material Moving | 2 (28.6%) | 5 (71.4%) |
| Total (Category) | 17 (77.3%) | 5 (22.7%) |
| Total (Overall) | 39 (52.7%) | 35 (47.3%) |
Employment Industries by Sex in Creston
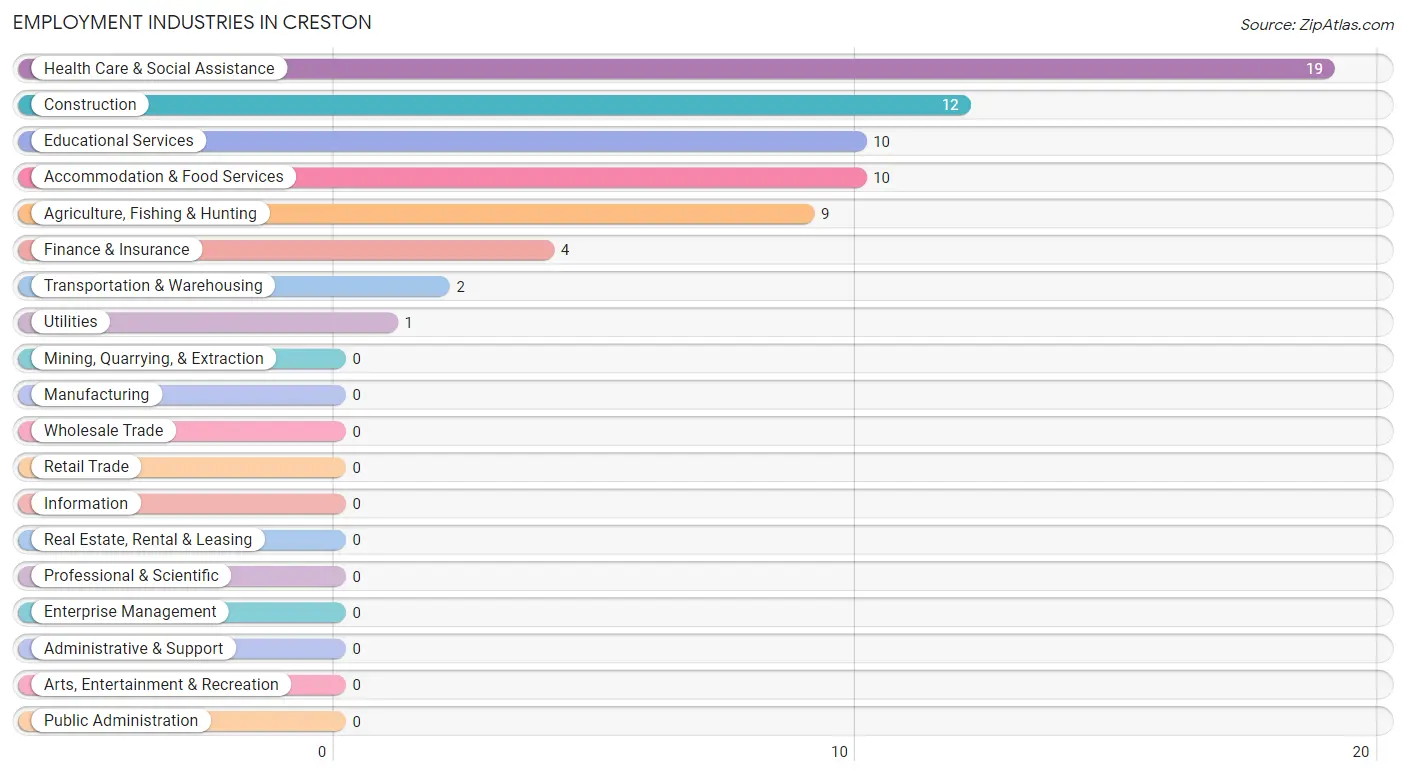
Employment Industries in Creston
The major employment industries in Creston include Health Care & Social Assistance (19 | 25.7%), Construction (12 | 16.2%), Educational Services (10 | 13.5%), Accommodation & Food Services (10 | 13.5%), and Agriculture, Fishing & Hunting (9 | 12.2%).
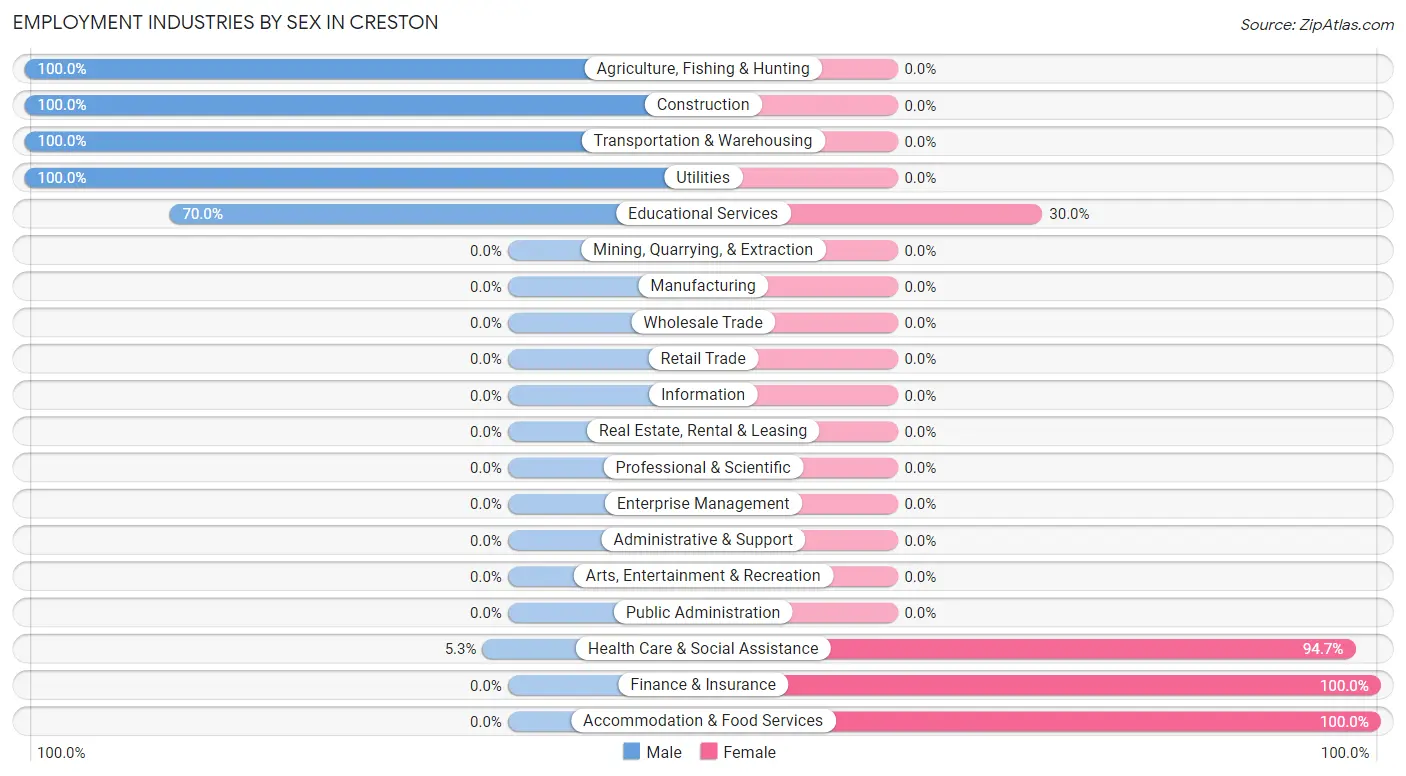
Employment Industries by Sex in Creston
The Creston industries that see more men than women are Agriculture, Fishing & Hunting (100.0%), Construction (100.0%), and Transportation & Warehousing (100.0%), whereas the industries that tend to have a higher number of women are Finance & Insurance (100.0%), Accommodation & Food Services (100.0%), and Health Care & Social Assistance (94.7%).
| Industry | Male | Female |
| Agriculture, Fishing & Hunting | 9 (100.0%) | 0 (0.0%) |
| Mining, Quarrying, & Extraction | 0 (0.0%) | 0 (0.0%) |
| Construction | 12 (100.0%) | 0 (0.0%) |
| Manufacturing | 0 (0.0%) | 0 (0.0%) |
| Wholesale Trade | 0 (0.0%) | 0 (0.0%) |
| Retail Trade | 0 (0.0%) | 0 (0.0%) |
| Transportation & Warehousing | 2 (100.0%) | 0 (0.0%) |
| Utilities | 1 (100.0%) | 0 (0.0%) |
| Information | 0 (0.0%) | 0 (0.0%) |
| Finance & Insurance | 0 (0.0%) | 4 (100.0%) |
| Real Estate, Rental & Leasing | 0 (0.0%) | 0 (0.0%) |
| Professional & Scientific | 0 (0.0%) | 0 (0.0%) |
| Enterprise Management | 0 (0.0%) | 0 (0.0%) |
| Administrative & Support | 0 (0.0%) | 0 (0.0%) |
| Educational Services | 7 (70.0%) | 3 (30.0%) |
| Health Care & Social Assistance | 1 (5.3%) | 18 (94.7%) |
| Arts, Entertainment & Recreation | 0 (0.0%) | 0 (0.0%) |
| Accommodation & Food Services | 0 (0.0%) | 10 (100.0%) |
| Public Administration | 0 (0.0%) | 0 (0.0%) |
| Total | 39 (52.7%) | 35 (47.3%) |
Education in Creston
School Enrollment in Creston
The most common levels of schooling among the 26 students in Creston are high school (20 | 76.9%), middle school (4 | 15.4%), and nursery / preschool (1 | 3.8%).
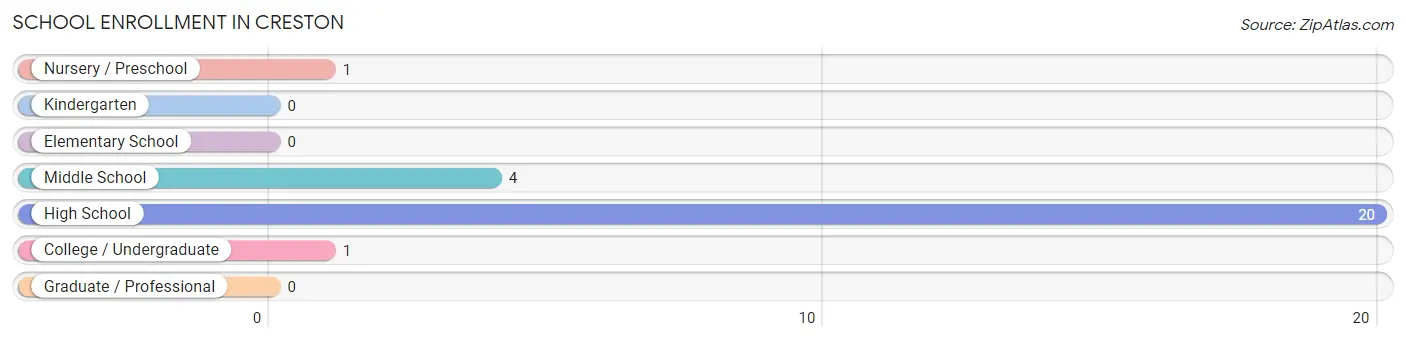
| School Level | # Students | % Students |
| Nursery / Preschool | 1 | 3.8% |
| Kindergarten | 0 | 0.0% |
| Elementary School | 0 | 0.0% |
| Middle School | 4 | 15.4% |
| High School | 20 | 76.9% |
| College / Undergraduate | 1 | 3.8% |
| Graduate / Professional | 0 | 0.0% |
| Total | 26 | 100.0% |
School Enrollment by Age by Funding Source in Creston
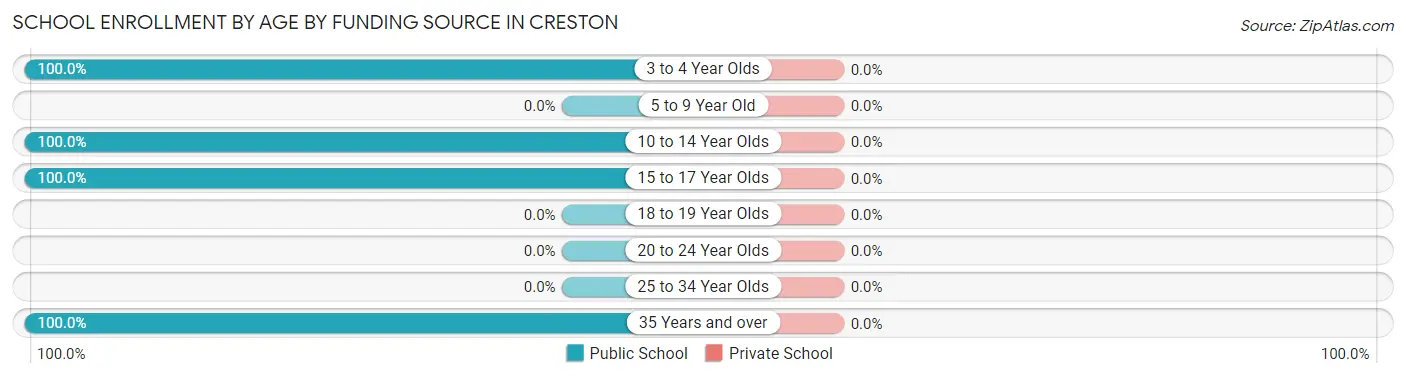
| Age Bracket | Public School | Private School |
| 3 to 4 Year Olds | 1 (100.0%) | 0 (0.0%) |
| 5 to 9 Year Old | 0 (0.0%) | 0 (0.0%) |
| 10 to 14 Year Olds | 4 (100.0%) | 0 (0.0%) |
| 15 to 17 Year Olds | 20 (100.0%) | 0 (0.0%) |
| 18 to 19 Year Olds | 0 (0.0%) | 0 (0.0%) |
| 20 to 24 Year Olds | 0 (0.0%) | 0 (0.0%) |
| 25 to 34 Year Olds | 0 (0.0%) | 0 (0.0%) |
| 35 Years and over | 1 (100.0%) | 0 (0.0%) |
| Total | 26 (100.0%) | 0 (0.0%) |
Educational Attainment by Field of Study in Creston
Education (13 | 72.2%), and liberal arts & history (5 | 27.8%) are the most common fields of study among 18 individuals in Creston who have obtained a bachelor's degree or higher.
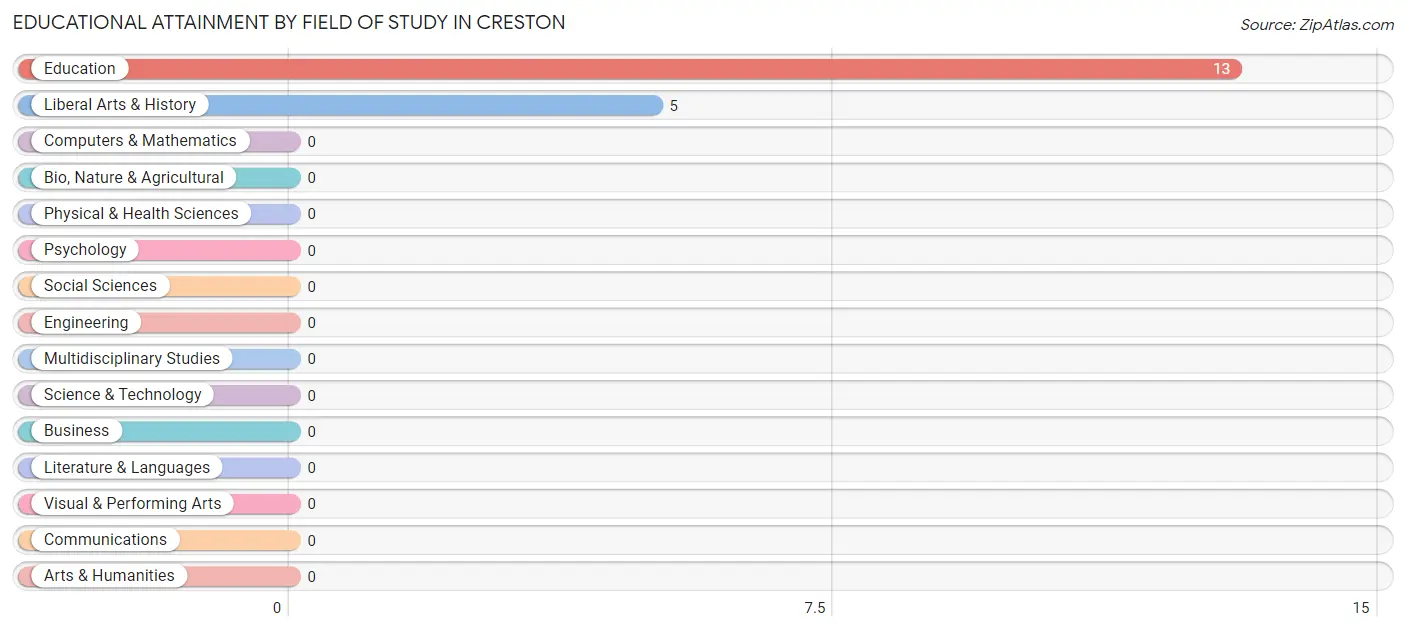
| Field of Study | # Graduates | % Graduates |
| Computers & Mathematics | 0 | 0.0% |
| Bio, Nature & Agricultural | 0 | 0.0% |
| Physical & Health Sciences | 0 | 0.0% |
| Psychology | 0 | 0.0% |
| Social Sciences | 0 | 0.0% |
| Engineering | 0 | 0.0% |
| Multidisciplinary Studies | 0 | 0.0% |
| Science & Technology | 0 | 0.0% |
| Business | 0 | 0.0% |
| Education | 13 | 72.2% |
| Literature & Languages | 0 | 0.0% |
| Liberal Arts & History | 5 | 27.8% |
| Visual & Performing Arts | 0 | 0.0% |
| Communications | 0 | 0.0% |
| Arts & Humanities | 0 | 0.0% |
| Total | 18 | 100.0% |
Transportation & Commute in Creston
Vehicle Availability by Sex in Creston
The most prevalent vehicle ownership categories in Creston are males with 3 vehicles (19, accounting for 48.7%) and females with 3 vehicles (20, making up 54.3%).
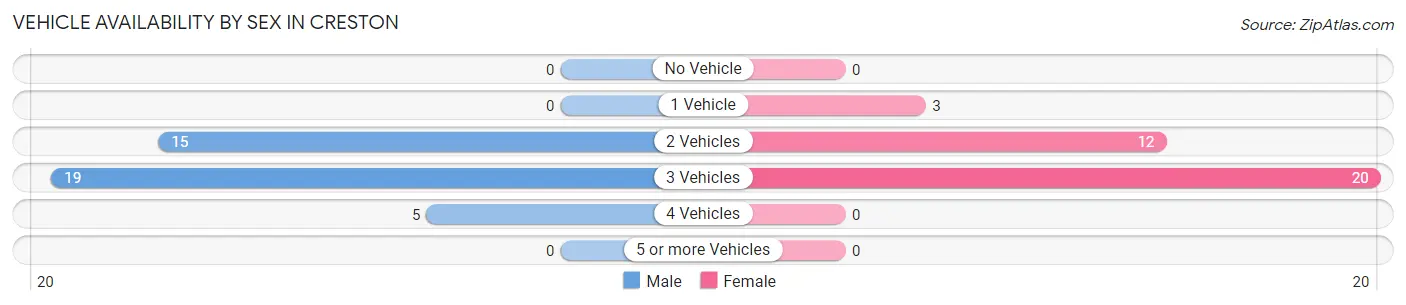
| Vehicles Available | Male | Female |
| No Vehicle | 0 (0.0%) | 0 (0.0%) |
| 1 Vehicle | 0 (0.0%) | 3 (8.6%) |
| 2 Vehicles | 15 (38.5%) | 12 (34.3%) |
| 3 Vehicles | 19 (48.7%) | 20 (57.1%) |
| 4 Vehicles | 5 (12.8%) | 0 (0.0%) |
| 5 or more Vehicles | 0 (0.0%) | 0 (0.0%) |
| Total | 39 (100.0%) | 35 (100.0%) |
Commute Time in Creston
The most frequently occuring commute durations in Creston are less than 5 minutes (18 commuters, 27.3%), 5 to 9 minutes (9 commuters, 13.6%), and 25 to 29 minutes (9 commuters, 13.6%).
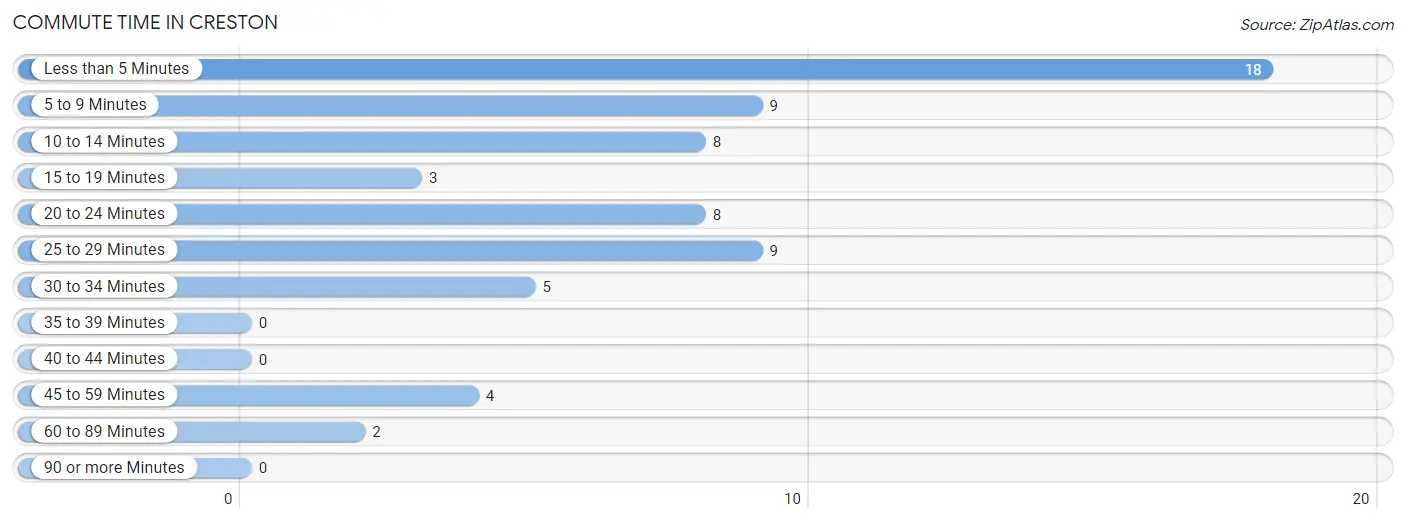
| Commute Time | # Commuters | % Commuters |
| Less than 5 Minutes | 18 | 27.3% |
| 5 to 9 Minutes | 9 | 13.6% |
| 10 to 14 Minutes | 8 | 12.1% |
| 15 to 19 Minutes | 3 | 4.5% |
| 20 to 24 Minutes | 8 | 12.1% |
| 25 to 29 Minutes | 9 | 13.6% |
| 30 to 34 Minutes | 5 | 7.6% |
| 35 to 39 Minutes | 0 | 0.0% |
| 40 to 44 Minutes | 0 | 0.0% |
| 45 to 59 Minutes | 4 | 6.1% |
| 60 to 89 Minutes | 2 | 3.0% |
| 90 or more Minutes | 0 | 0.0% |
Commute Time by Sex in Creston
The most common commute times in Creston are less than 5 minutes (12 commuters, 34.3%) for males and 10 to 14 minutes (8 commuters, 25.8%) for females.
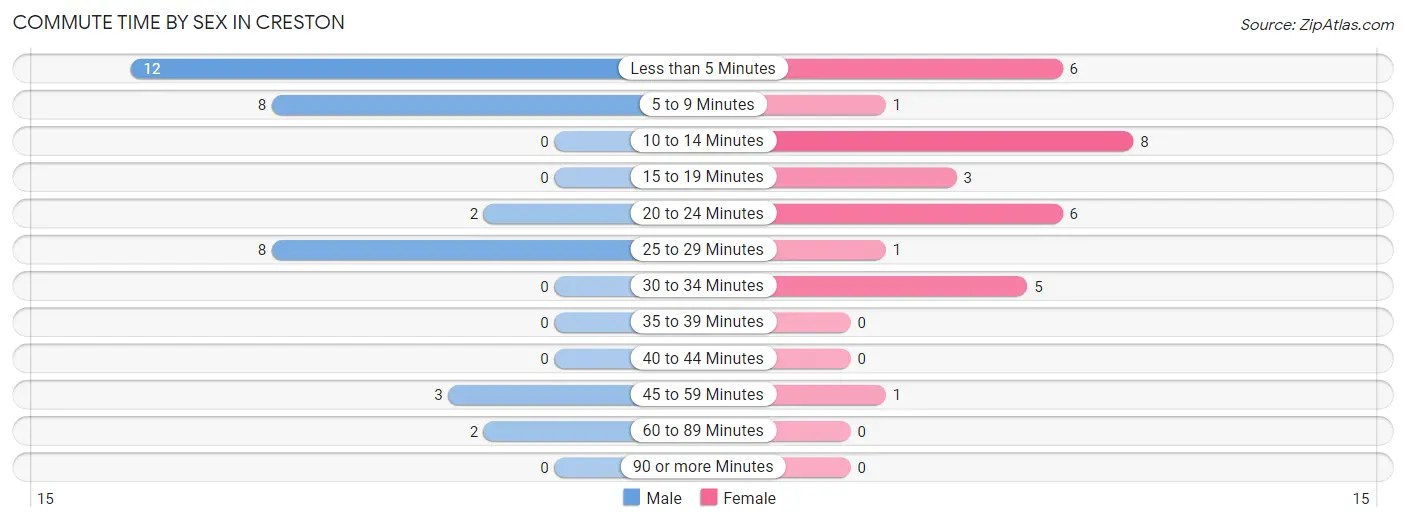
| Commute Time | Male | Female |
| Less than 5 Minutes | 12 (34.3%) | 6 (19.4%) |
| 5 to 9 Minutes | 8 (22.9%) | 1 (3.2%) |
| 10 to 14 Minutes | 0 (0.0%) | 8 (25.8%) |
| 15 to 19 Minutes | 0 (0.0%) | 3 (9.7%) |
| 20 to 24 Minutes | 2 (5.7%) | 6 (19.4%) |
| 25 to 29 Minutes | 8 (22.9%) | 1 (3.2%) |
| 30 to 34 Minutes | 0 (0.0%) | 5 (16.1%) |
| 35 to 39 Minutes | 0 (0.0%) | 0 (0.0%) |
| 40 to 44 Minutes | 0 (0.0%) | 0 (0.0%) |
| 45 to 59 Minutes | 3 (8.6%) | 1 (3.2%) |
| 60 to 89 Minutes | 2 (5.7%) | 0 (0.0%) |
| 90 or more Minutes | 0 (0.0%) | 0 (0.0%) |
Time of Departure to Work by Sex in Creston
The most frequent times of departure to work in Creston are 12:00 AM to 4:59 AM (11, 31.4%) for males and 5:00 AM to 5:29 AM (12, 38.7%) for females.
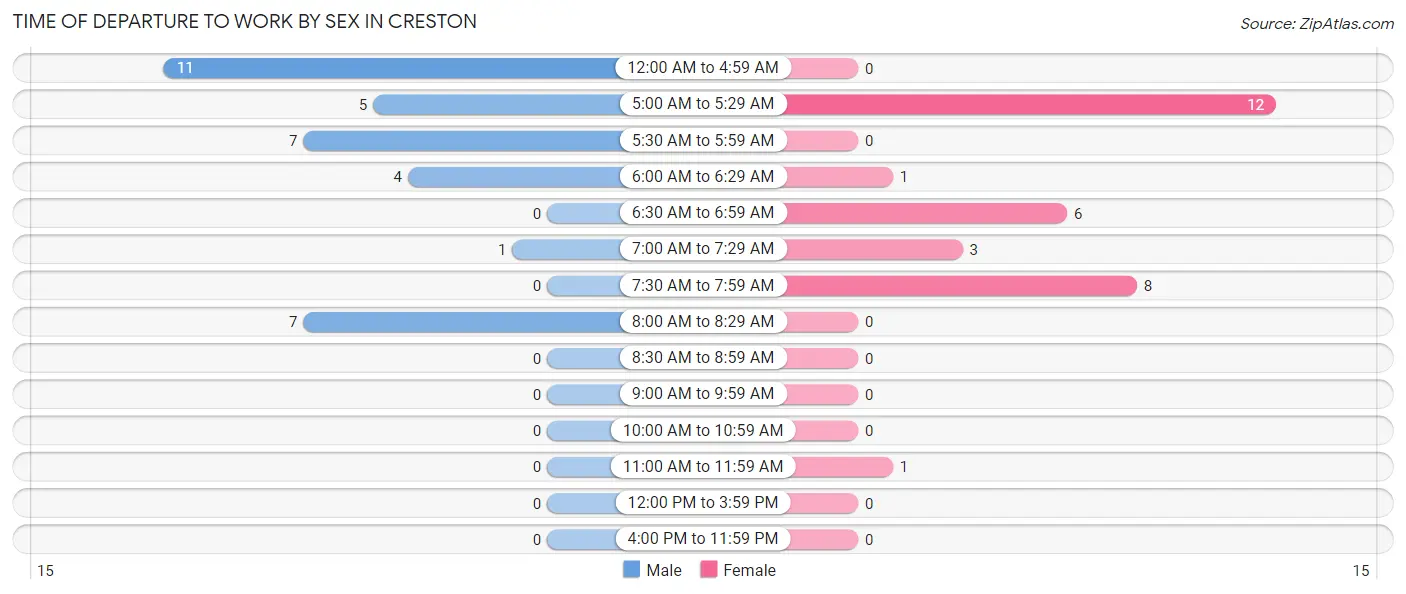
| Time of Departure | Male | Female |
| 12:00 AM to 4:59 AM | 11 (31.4%) | 0 (0.0%) |
| 5:00 AM to 5:29 AM | 5 (14.3%) | 12 (38.7%) |
| 5:30 AM to 5:59 AM | 7 (20.0%) | 0 (0.0%) |
| 6:00 AM to 6:29 AM | 4 (11.4%) | 1 (3.2%) |
| 6:30 AM to 6:59 AM | 0 (0.0%) | 6 (19.4%) |
| 7:00 AM to 7:29 AM | 1 (2.9%) | 3 (9.7%) |
| 7:30 AM to 7:59 AM | 0 (0.0%) | 8 (25.8%) |
| 8:00 AM to 8:29 AM | 7 (20.0%) | 0 (0.0%) |
| 8:30 AM to 8:59 AM | 0 (0.0%) | 0 (0.0%) |
| 9:00 AM to 9:59 AM | 0 (0.0%) | 0 (0.0%) |
| 10:00 AM to 10:59 AM | 0 (0.0%) | 0 (0.0%) |
| 11:00 AM to 11:59 AM | 0 (0.0%) | 1 (3.2%) |
| 12:00 PM to 3:59 PM | 0 (0.0%) | 0 (0.0%) |
| 4:00 PM to 11:59 PM | 0 (0.0%) | 0 (0.0%) |
| Total | 35 (100.0%) | 31 (100.0%) |
Housing Occupancy in Creston
Occupancy by Ownership in Creston
Of the total 119 dwellings in Creston, owner-occupied units account for 90 (75.6%), while renter-occupied units make up 29 (24.4%).
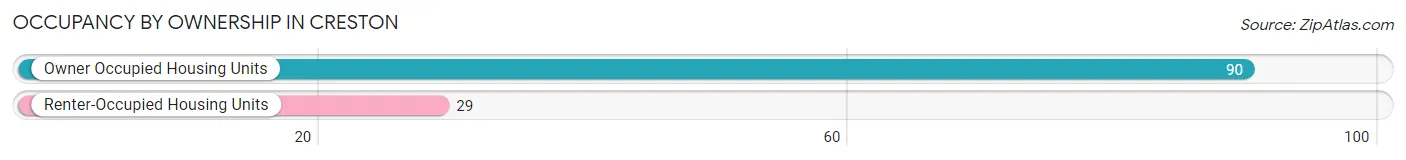
| Occupancy | # Housing Units | % Housing Units |
| Owner Occupied Housing Units | 90 | 75.6% |
| Renter-Occupied Housing Units | 29 | 24.4% |
| Total Occupied Housing Units | 119 | 100.0% |
Occupancy by Household Size in Creston
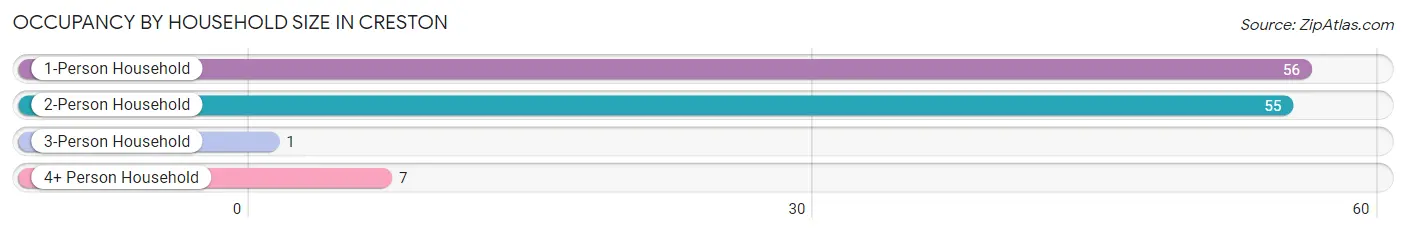
| Household Size | # Housing Units | % Housing Units |
| 1-Person Household | 56 | 47.1% |
| 2-Person Household | 55 | 46.2% |
| 3-Person Household | 1 | 0.8% |
| 4+ Person Household | 7 | 5.9% |
| Total Housing Units | 119 | 100.0% |
Occupancy by Ownership by Household Size in Creston
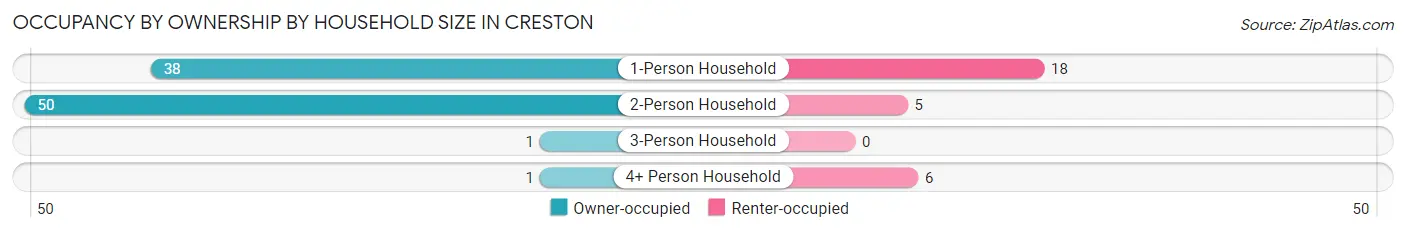
| Household Size | Owner-occupied | Renter-occupied |
| 1-Person Household | 38 (67.9%) | 18 (32.1%) |
| 2-Person Household | 50 (90.9%) | 5 (9.1%) |
| 3-Person Household | 1 (100.0%) | 0 (0.0%) |
| 4+ Person Household | 1 (14.3%) | 6 (85.7%) |
| Total Housing Units | 90 (75.6%) | 29 (24.4%) |
Occupancy by Educational Attainment in Creston
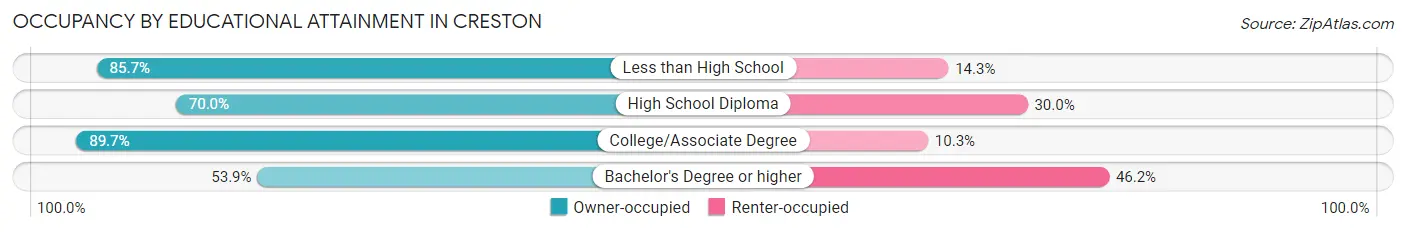
| Household Size | Owner-occupied | Renter-occupied |
| Less than High School | 6 (85.7%) | 1 (14.3%) |
| High School Diploma | 42 (70.0%) | 18 (30.0%) |
| College/Associate Degree | 35 (89.7%) | 4 (10.3%) |
| Bachelor's Degree or higher | 7 (53.8%) | 6 (46.2%) |
Occupancy by Age of Householder in Creston
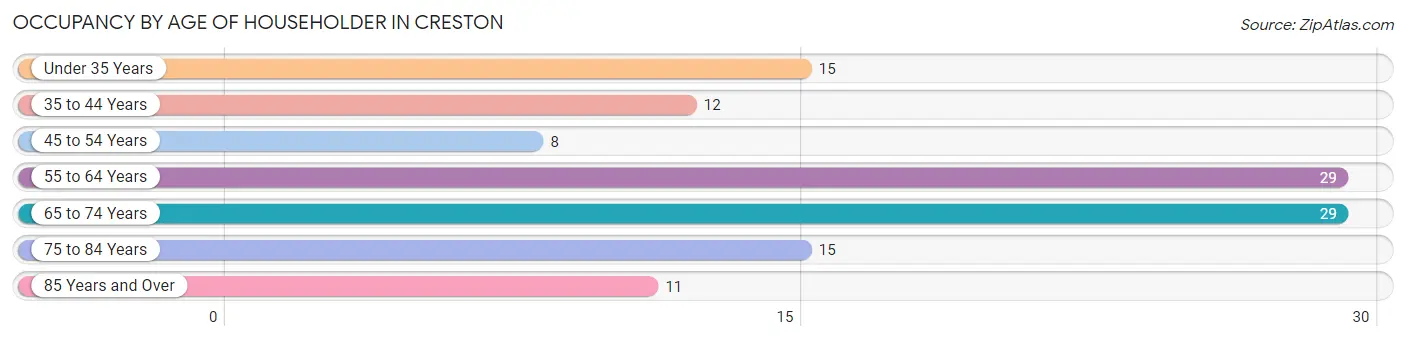
| Age Bracket | # Households | % Households |
| Under 35 Years | 15 | 12.6% |
| 35 to 44 Years | 12 | 10.1% |
| 45 to 54 Years | 8 | 6.7% |
| 55 to 64 Years | 29 | 24.4% |
| 65 to 74 Years | 29 | 24.4% |
| 75 to 84 Years | 15 | 12.6% |
| 85 Years and Over | 11 | 9.2% |
| Total | 119 | 100.0% |
Housing Finances in Creston
Median Income by Occupancy in Creston
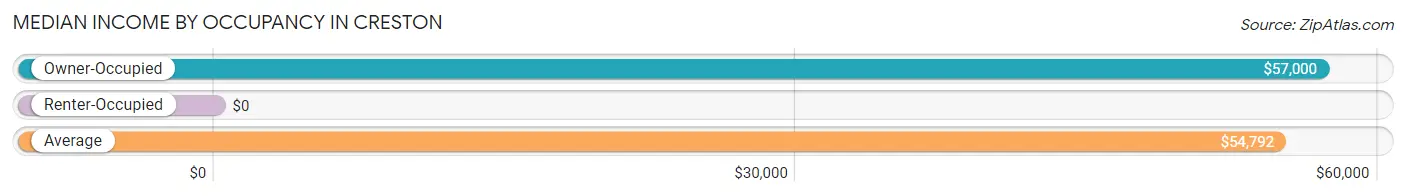
| Occupancy Type | # Households | Median Income |
| Owner-Occupied | 90 (75.6%) | $57,000 |
| Renter-Occupied | 29 (24.4%) | $0 |
| Average | 119 (100.0%) | $54,792 |
Occupancy by Householder Income Bracket in Creston
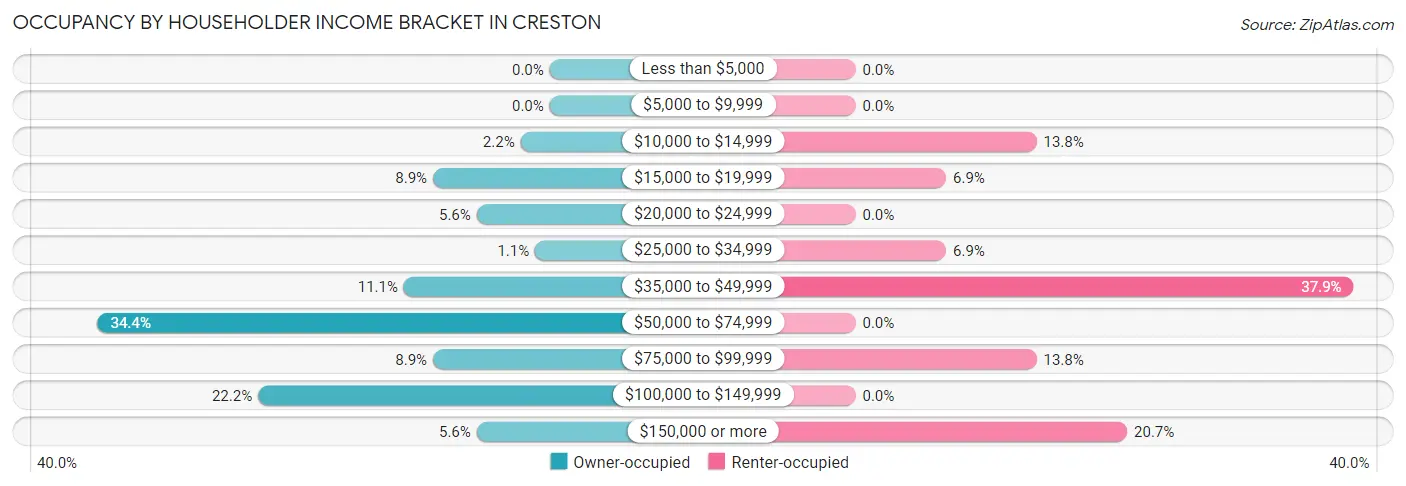
| Income Bracket | Owner-occupied | Renter-occupied |
| Less than $5,000 | 0 (0.0%) | 0 (0.0%) |
| $5,000 to $9,999 | 0 (0.0%) | 0 (0.0%) |
| $10,000 to $14,999 | 2 (2.2%) | 4 (13.8%) |
| $15,000 to $19,999 | 8 (8.9%) | 2 (6.9%) |
| $20,000 to $24,999 | 5 (5.6%) | 0 (0.0%) |
| $25,000 to $34,999 | 1 (1.1%) | 2 (6.9%) |
| $35,000 to $49,999 | 10 (11.1%) | 11 (37.9%) |
| $50,000 to $74,999 | 31 (34.4%) | 0 (0.0%) |
| $75,000 to $99,999 | 8 (8.9%) | 4 (13.8%) |
| $100,000 to $149,999 | 20 (22.2%) | 0 (0.0%) |
| $150,000 or more | 5 (5.6%) | 6 (20.7%) |
| Total | 90 (100.0%) | 29 (100.0%) |
Monthly Housing Cost Tiers in Creston
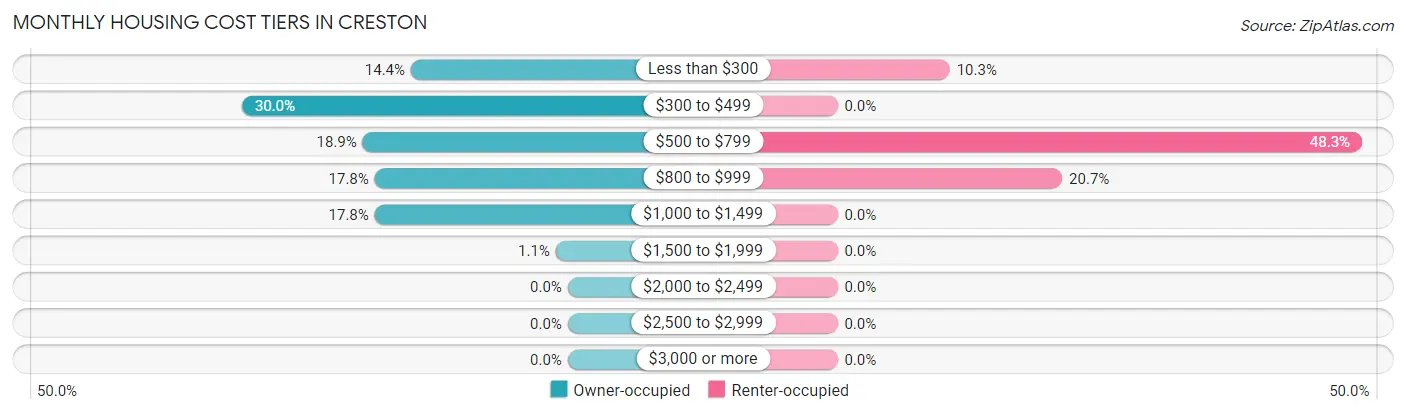
| Monthly Cost | Owner-occupied | Renter-occupied |
| Less than $300 | 13 (14.4%) | 3 (10.3%) |
| $300 to $499 | 27 (30.0%) | 0 (0.0%) |
| $500 to $799 | 17 (18.9%) | 14 (48.3%) |
| $800 to $999 | 16 (17.8%) | 6 (20.7%) |
| $1,000 to $1,499 | 16 (17.8%) | 0 (0.0%) |
| $1,500 to $1,999 | 1 (1.1%) | 0 (0.0%) |
| $2,000 to $2,499 | 0 (0.0%) | 0 (0.0%) |
| $2,500 to $2,999 | 0 (0.0%) | 0 (0.0%) |
| $3,000 or more | 0 (0.0%) | 0 (0.0%) |
| Total | 90 (100.0%) | 29 (100.0%) |
Physical Housing Characteristics in Creston
Housing Structures in Creston
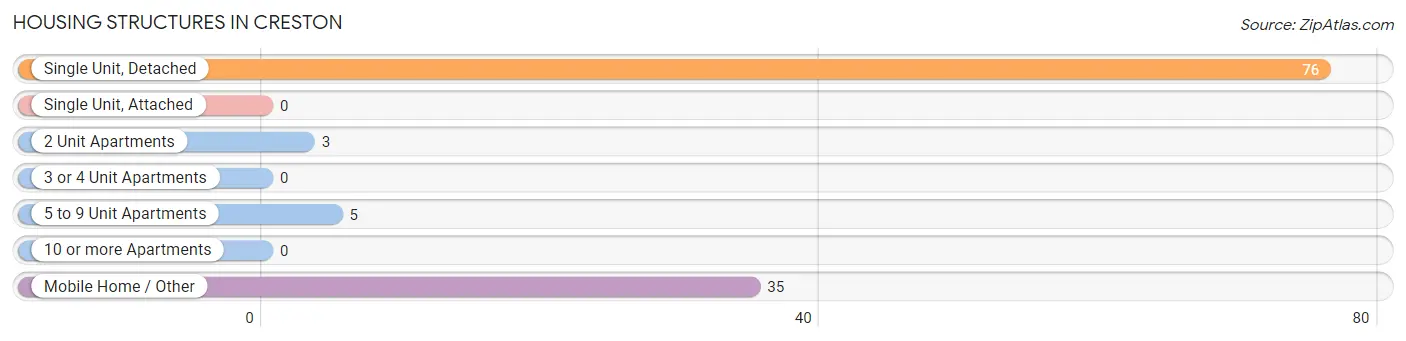
| Structure Type | # Housing Units | % Housing Units |
| Single Unit, Detached | 76 | 63.9% |
| Single Unit, Attached | 0 | 0.0% |
| 2 Unit Apartments | 3 | 2.5% |
| 3 or 4 Unit Apartments | 0 | 0.0% |
| 5 to 9 Unit Apartments | 5 | 4.2% |
| 10 or more Apartments | 0 | 0.0% |
| Mobile Home / Other | 35 | 29.4% |
| Total | 119 | 100.0% |
Housing Structures by Occupancy in Creston
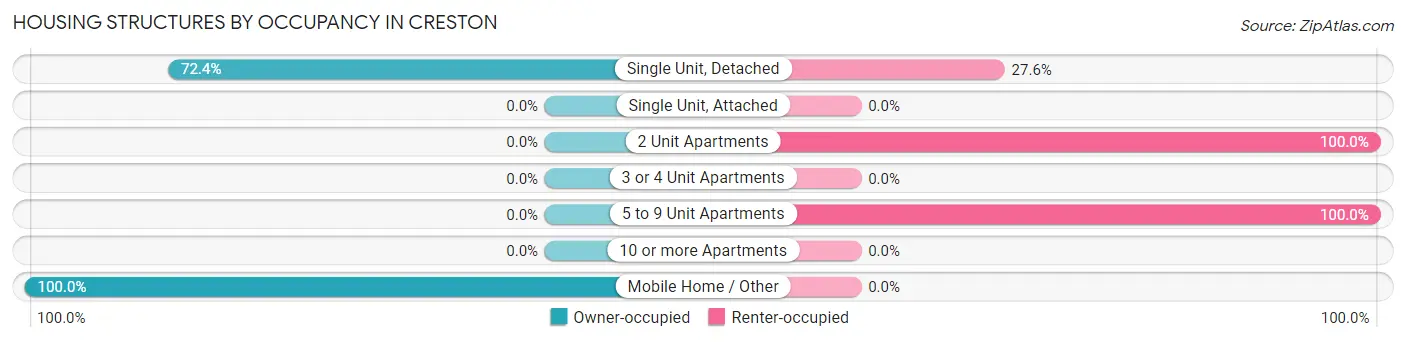
| Structure Type | Owner-occupied | Renter-occupied |
| Single Unit, Detached | 55 (72.4%) | 21 (27.6%) |
| Single Unit, Attached | 0 (0.0%) | 0 (0.0%) |
| 2 Unit Apartments | 0 (0.0%) | 3 (100.0%) |
| 3 or 4 Unit Apartments | 0 (0.0%) | 0 (0.0%) |
| 5 to 9 Unit Apartments | 0 (0.0%) | 5 (100.0%) |
| 10 or more Apartments | 0 (0.0%) | 0 (0.0%) |
| Mobile Home / Other | 35 (100.0%) | 0 (0.0%) |
| Total | 90 (75.6%) | 29 (24.4%) |
Housing Structures by Number of Rooms in Creston
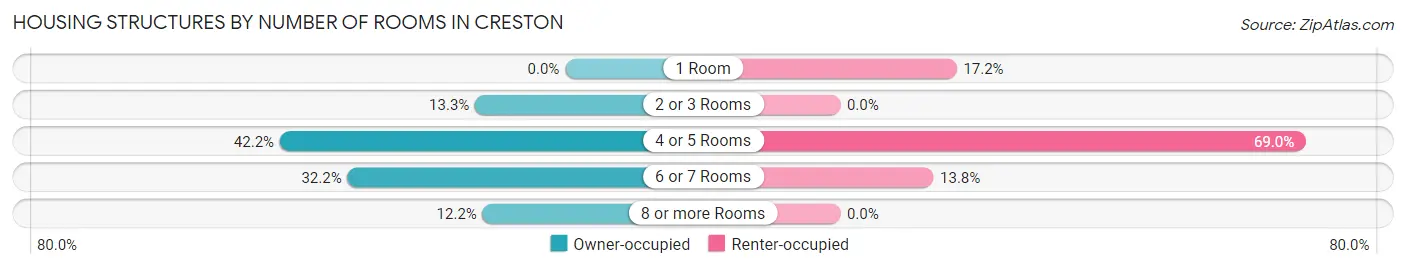
| Number of Rooms | Owner-occupied | Renter-occupied |
| 1 Room | 0 (0.0%) | 5 (17.2%) |
| 2 or 3 Rooms | 12 (13.3%) | 0 (0.0%) |
| 4 or 5 Rooms | 38 (42.2%) | 20 (69.0%) |
| 6 or 7 Rooms | 29 (32.2%) | 4 (13.8%) |
| 8 or more Rooms | 11 (12.2%) | 0 (0.0%) |
| Total | 90 (100.0%) | 29 (100.0%) |
Housing Structure by Heating Type in Creston
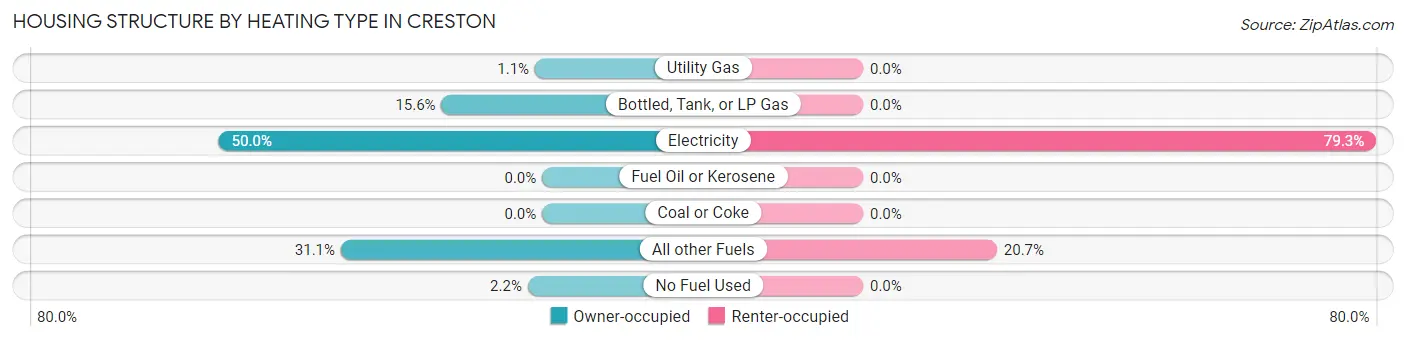
| Heating Type | Owner-occupied | Renter-occupied |
| Utility Gas | 1 (1.1%) | 0 (0.0%) |
| Bottled, Tank, or LP Gas | 14 (15.6%) | 0 (0.0%) |
| Electricity | 45 (50.0%) | 23 (79.3%) |
| Fuel Oil or Kerosene | 0 (0.0%) | 0 (0.0%) |
| Coal or Coke | 0 (0.0%) | 0 (0.0%) |
| All other Fuels | 28 (31.1%) | 6 (20.7%) |
| No Fuel Used | 2 (2.2%) | 0 (0.0%) |
| Total | 90 (100.0%) | 29 (100.0%) |
Household Vehicle Usage in Creston
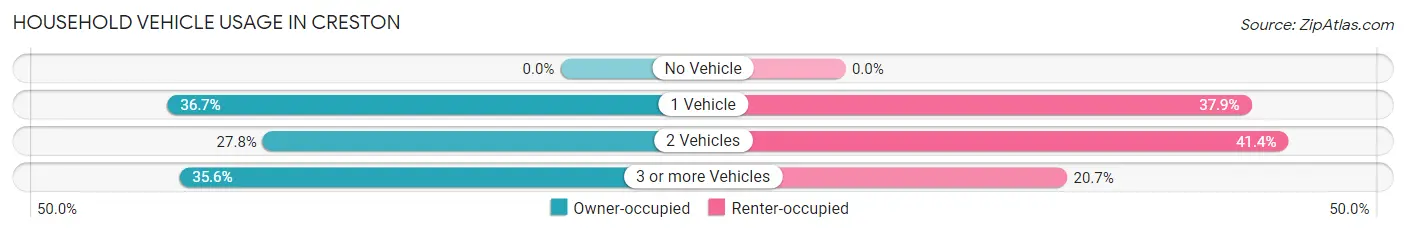
| Vehicles per Household | Owner-occupied | Renter-occupied |
| No Vehicle | 0 (0.0%) | 0 (0.0%) |
| 1 Vehicle | 33 (36.7%) | 11 (37.9%) |
| 2 Vehicles | 25 (27.8%) | 12 (41.4%) |
| 3 or more Vehicles | 32 (35.6%) | 6 (20.7%) |
| Total | 90 (100.0%) | 29 (100.0%) |
Real Estate & Mortgages in Creston
Real Estate and Mortgage Overview in Creston
| Characteristic | Without Mortgage | With Mortgage |
| Housing Units | 49 | 41 |
| Median Property Value | $134,600 | $120,200 |
| Median Household Income | $54,792 | $5 |
| Monthly Housing Costs | $382 | $0 |
| Real Estate Taxes | - | - |
Property Value by Mortgage Status in Creston
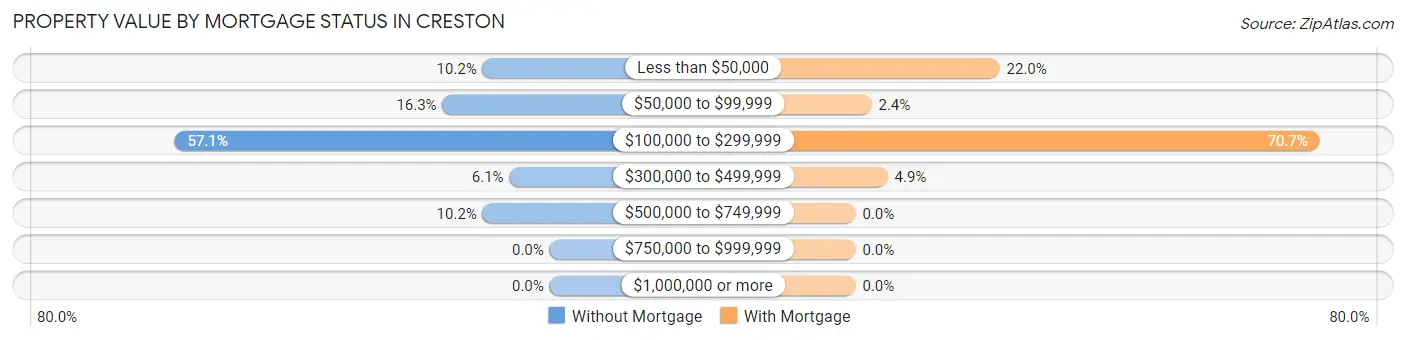
| Property Value | Without Mortgage | With Mortgage |
| Less than $50,000 | 5 (10.2%) | 9 (22.0%) |
| $50,000 to $99,999 | 8 (16.3%) | 1 (2.4%) |
| $100,000 to $299,999 | 28 (57.1%) | 29 (70.7%) |
| $300,000 to $499,999 | 3 (6.1%) | 2 (4.9%) |
| $500,000 to $749,999 | 5 (10.2%) | 0 (0.0%) |
| $750,000 to $999,999 | 0 (0.0%) | 0 (0.0%) |
| $1,000,000 or more | 0 (0.0%) | 0 (0.0%) |
| Total | 49 (100.0%) | 41 (100.0%) |
Household Income by Mortgage Status in Creston
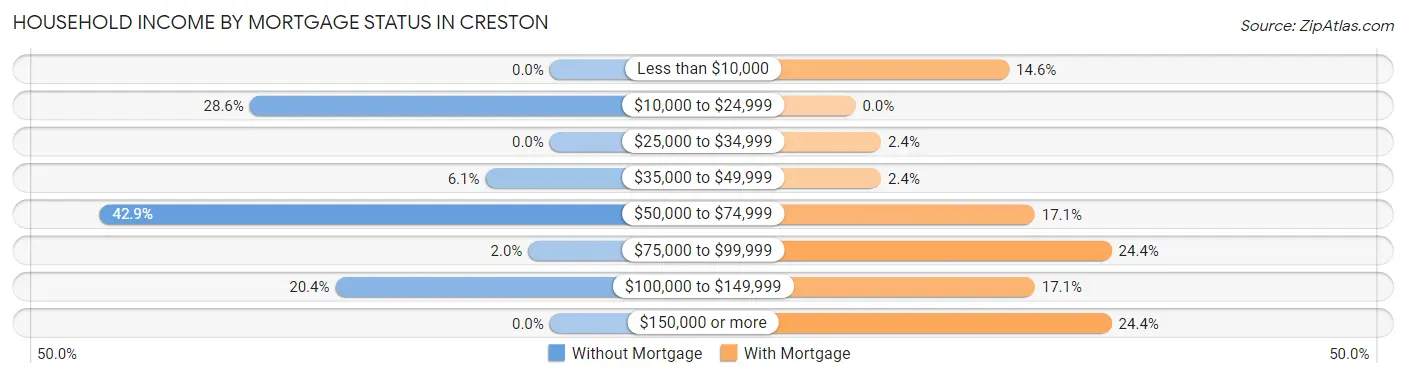
| Household Income | Without Mortgage | With Mortgage |
| Less than $10,000 | 0 (0.0%) | 6 (14.6%) |
| $10,000 to $24,999 | 14 (28.6%) | 0 (0.0%) |
| $25,000 to $34,999 | 0 (0.0%) | 1 (2.4%) |
| $35,000 to $49,999 | 3 (6.1%) | 1 (2.4%) |
| $50,000 to $74,999 | 21 (42.9%) | 7 (17.1%) |
| $75,000 to $99,999 | 1 (2.0%) | 10 (24.4%) |
| $100,000 to $149,999 | 10 (20.4%) | 7 (17.1%) |
| $150,000 or more | 0 (0.0%) | 10 (24.4%) |
| Total | 49 (100.0%) | 41 (100.0%) |
Property Value to Household Income Ratio in Creston
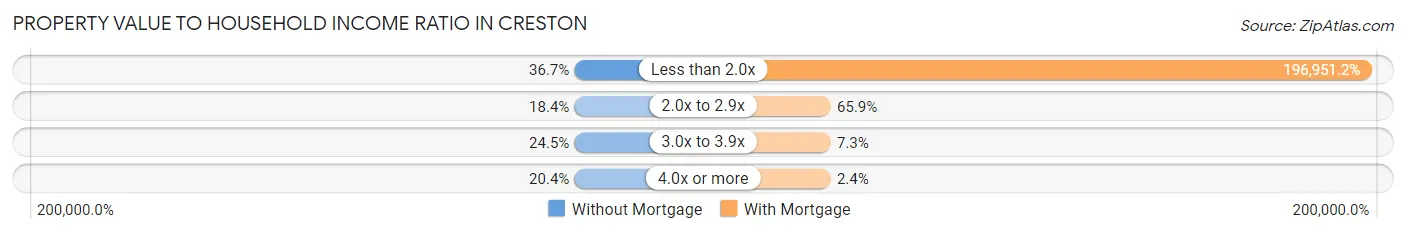
| Value-to-Income Ratio | Without Mortgage | With Mortgage |
| Less than 2.0x | 18 (36.7%) | 80,750 (196,951.2%) |
| 2.0x to 2.9x | 9 (18.4%) | 27 (65.8%) |
| 3.0x to 3.9x | 12 (24.5%) | 3 (7.3%) |
| 4.0x or more | 10 (20.4%) | 1 (2.4%) |
| Total | 49 (100.0%) | 41 (100.0%) |
Real Estate Taxes by Mortgage Status in Creston
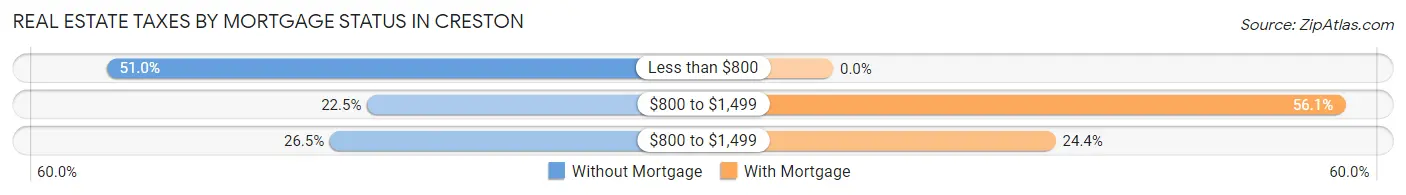
| Property Taxes | Without Mortgage | With Mortgage |
| Less than $800 | 25 (51.0%) | 0 (0.0%) |
| $800 to $1,499 | 11 (22.5%) | 23 (56.1%) |
| $800 to $1,499 | 13 (26.5%) | 10 (24.4%) |
| Total | 49 (100.0%) | 41 (100.0%) |
Health & Disability in Creston
Health Insurance Coverage by Age in Creston
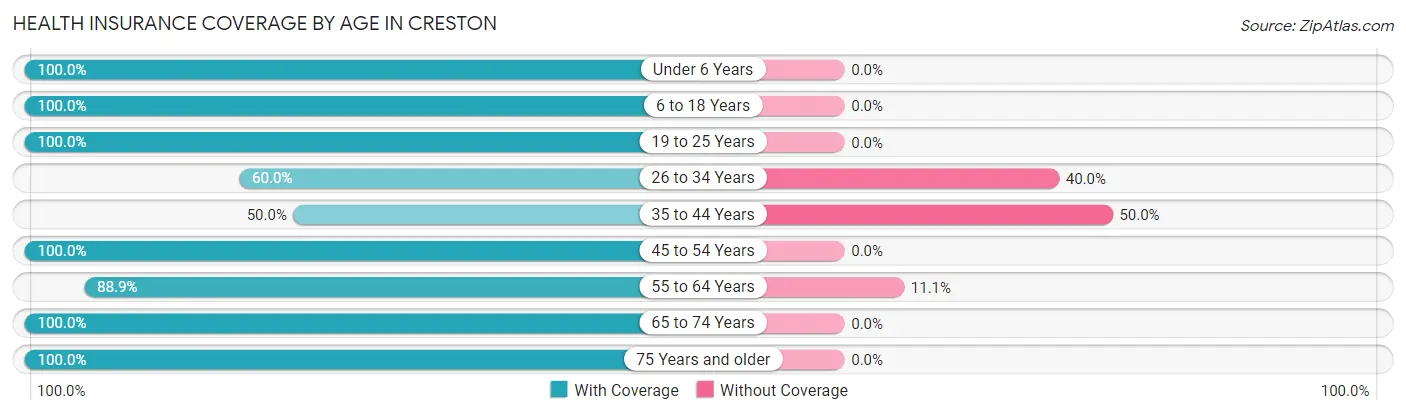
| Age Bracket | With Coverage | Without Coverage |
| Under 6 Years | 1 (100.0%) | 0 (0.0%) |
| 6 to 18 Years | 24 (100.0%) | 0 (0.0%) |
| 19 to 25 Years | 11 (100.0%) | 0 (0.0%) |
| 26 to 34 Years | 12 (60.0%) | 8 (40.0%) |
| 35 to 44 Years | 13 (50.0%) | 13 (50.0%) |
| 45 to 54 Years | 9 (100.0%) | 0 (0.0%) |
| 55 to 64 Years | 32 (88.9%) | 4 (11.1%) |
| 65 to 74 Years | 44 (100.0%) | 0 (0.0%) |
| 75 Years and older | 42 (100.0%) | 0 (0.0%) |
| Total | 188 (88.3%) | 25 (11.7%) |
Health Insurance Coverage by Citizenship Status in Creston
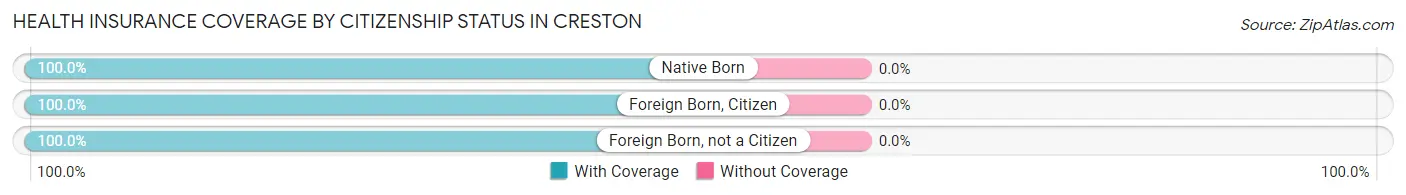
| Citizenship Status | With Coverage | Without Coverage |
| Native Born | 1 (100.0%) | 0 (0.0%) |
| Foreign Born, Citizen | 24 (100.0%) | 0 (0.0%) |
| Foreign Born, not a Citizen | 11 (100.0%) | 0 (0.0%) |
Health Insurance Coverage by Household Income in Creston
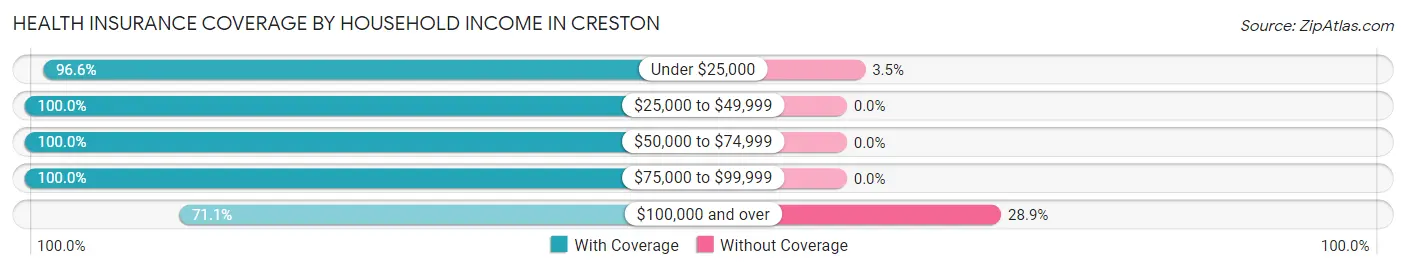
| Household Income | With Coverage | Without Coverage |
| Under $25,000 | 28 (96.6%) | 1 (3.5%) |
| $25,000 to $49,999 | 35 (100.0%) | 0 (0.0%) |
| $50,000 to $74,999 | 42 (100.0%) | 0 (0.0%) |
| $75,000 to $99,999 | 24 (100.0%) | 0 (0.0%) |
| $100,000 and over | 59 (71.1%) | 24 (28.9%) |
Public vs Private Health Insurance Coverage by Age in Creston
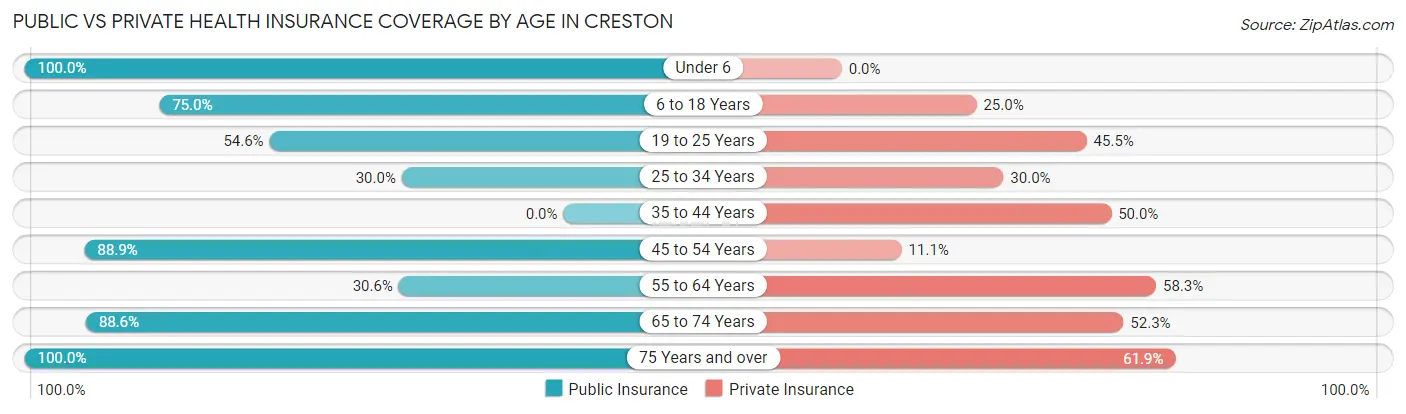
| Age Bracket | Public Insurance | Private Insurance |
| Under 6 | 1 (100.0%) | 0 (0.0%) |
| 6 to 18 Years | 18 (75.0%) | 6 (25.0%) |
| 19 to 25 Years | 6 (54.5%) | 5 (45.5%) |
| 25 to 34 Years | 6 (30.0%) | 6 (30.0%) |
| 35 to 44 Years | 0 (0.0%) | 13 (50.0%) |
| 45 to 54 Years | 8 (88.9%) | 1 (11.1%) |
| 55 to 64 Years | 11 (30.6%) | 21 (58.3%) |
| 65 to 74 Years | 39 (88.6%) | 23 (52.3%) |
| 75 Years and over | 42 (100.0%) | 26 (61.9%) |
| Total | 131 (61.5%) | 101 (47.4%) |
Disability Status by Sex by Age in Creston
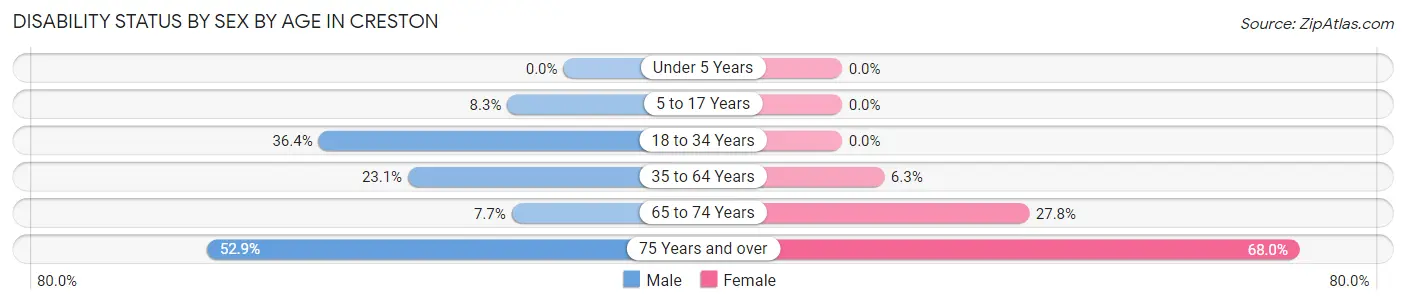
| Age Bracket | Male | Female |
| Under 5 Years | 0 (0.0%) | 0 (0.0%) |
| 5 to 17 Years | 2 (8.3%) | 0 (0.0%) |
| 18 to 34 Years | 8 (36.4%) | 0 (0.0%) |
| 35 to 64 Years | 9 (23.1%) | 2 (6.2%) |
| 65 to 74 Years | 2 (7.7%) | 5 (27.8%) |
| 75 Years and over | 9 (52.9%) | 17 (68.0%) |
Disability Class by Sex by Age in Creston
Disability Class: Hearing Difficulty
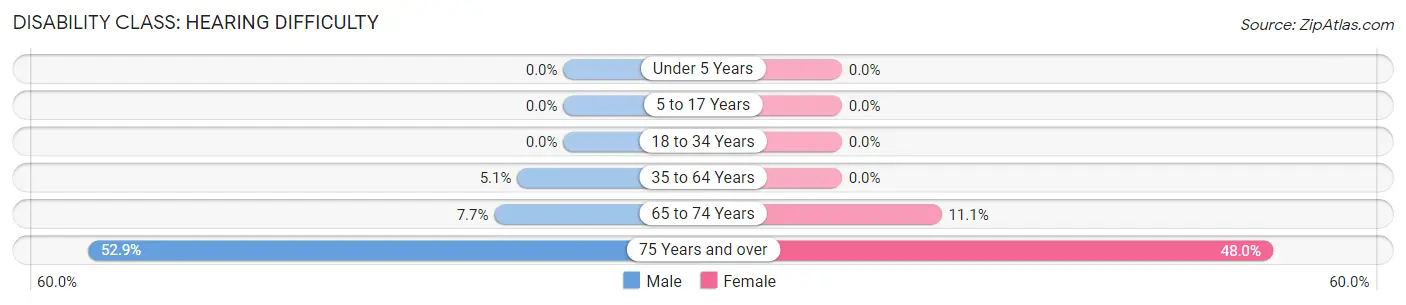
| Age Bracket | Male | Female |
| Under 5 Years | 0 (0.0%) | 0 (0.0%) |
| 5 to 17 Years | 0 (0.0%) | 0 (0.0%) |
| 18 to 34 Years | 0 (0.0%) | 0 (0.0%) |
| 35 to 64 Years | 2 (5.1%) | 0 (0.0%) |
| 65 to 74 Years | 2 (7.7%) | 2 (11.1%) |
| 75 Years and over | 9 (52.9%) | 12 (48.0%) |
Disability Class: Vision Difficulty
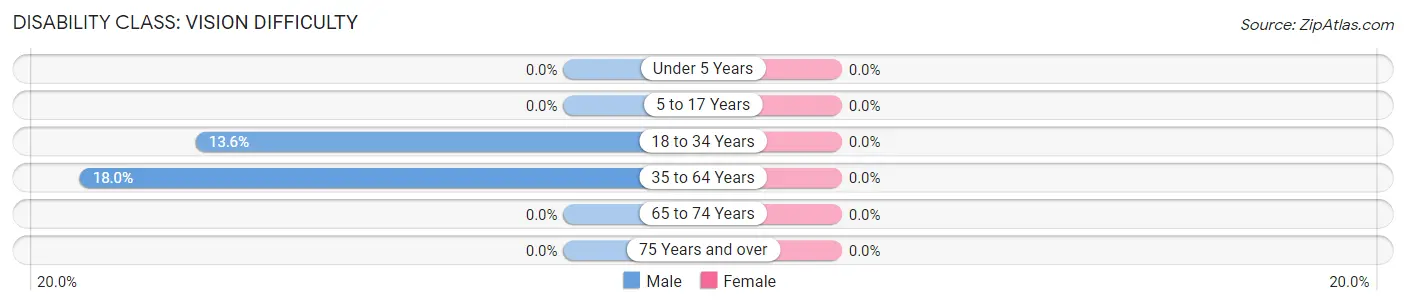
| Age Bracket | Male | Female |
| Under 5 Years | 0 (0.0%) | 0 (0.0%) |
| 5 to 17 Years | 0 (0.0%) | 0 (0.0%) |
| 18 to 34 Years | 3 (13.6%) | 0 (0.0%) |
| 35 to 64 Years | 7 (17.9%) | 0 (0.0%) |
| 65 to 74 Years | 0 (0.0%) | 0 (0.0%) |
| 75 Years and over | 0 (0.0%) | 0 (0.0%) |
Disability Class: Cognitive Difficulty
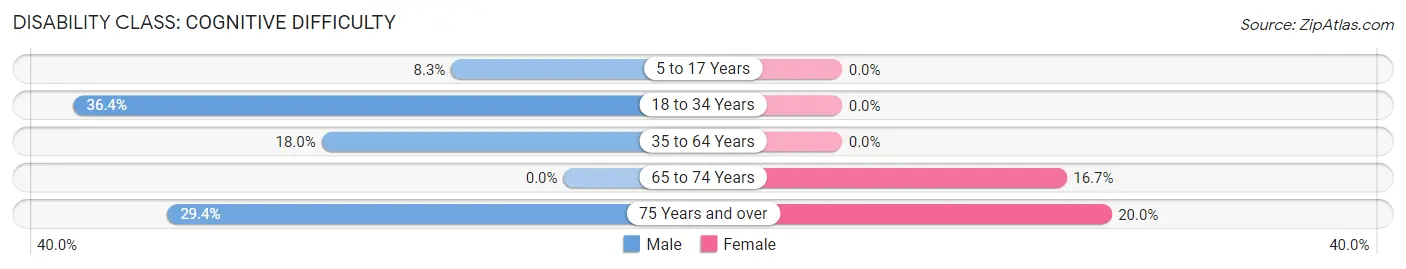
| Age Bracket | Male | Female |
| 5 to 17 Years | 2 (8.3%) | 0 (0.0%) |
| 18 to 34 Years | 8 (36.4%) | 0 (0.0%) |
| 35 to 64 Years | 7 (17.9%) | 0 (0.0%) |
| 65 to 74 Years | 0 (0.0%) | 3 (16.7%) |
| 75 Years and over | 5 (29.4%) | 5 (20.0%) |
Disability Class: Ambulatory Difficulty
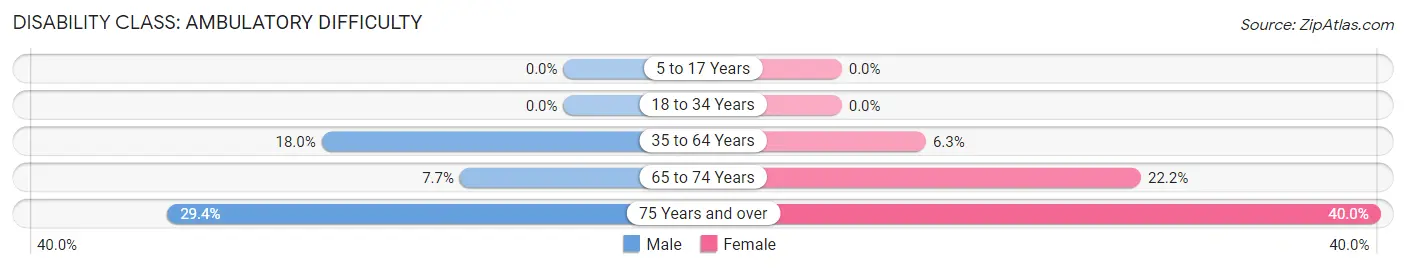
| Age Bracket | Male | Female |
| 5 to 17 Years | 0 (0.0%) | 0 (0.0%) |
| 18 to 34 Years | 0 (0.0%) | 0 (0.0%) |
| 35 to 64 Years | 7 (17.9%) | 2 (6.2%) |
| 65 to 74 Years | 2 (7.7%) | 4 (22.2%) |
| 75 Years and over | 5 (29.4%) | 10 (40.0%) |
Disability Class: Self-Care Difficulty
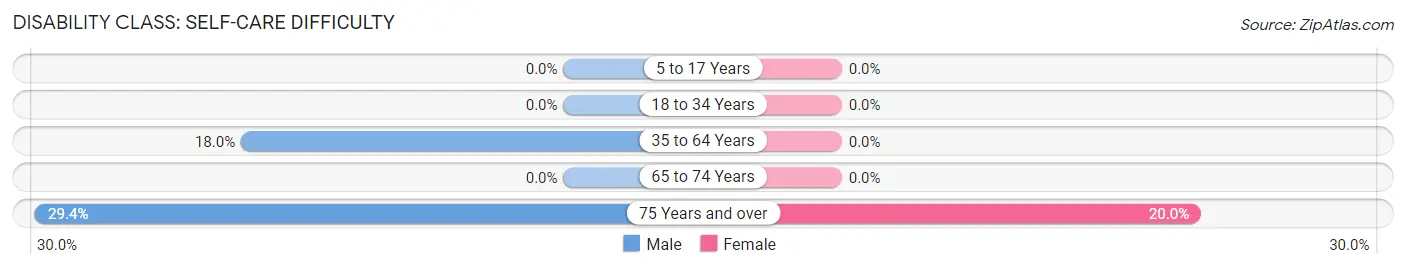
| Age Bracket | Male | Female |
| 5 to 17 Years | 0 (0.0%) | 0 (0.0%) |
| 18 to 34 Years | 0 (0.0%) | 0 (0.0%) |
| 35 to 64 Years | 7 (17.9%) | 0 (0.0%) |
| 65 to 74 Years | 0 (0.0%) | 0 (0.0%) |
| 75 Years and over | 5 (29.4%) | 5 (20.0%) |
Technology Access in Creston
Computing Device Access in Creston
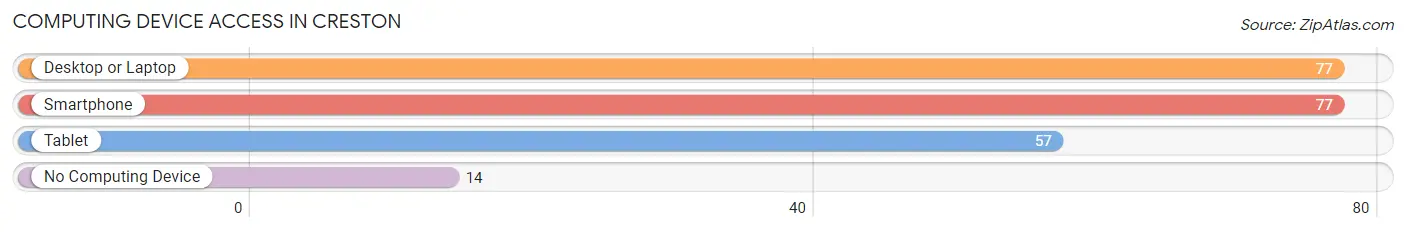
| Device Type | # Households | % Households |
| Desktop or Laptop | 77 | 64.7% |
| Smartphone | 77 | 64.7% |
| Tablet | 57 | 47.9% |
| No Computing Device | 14 | 11.8% |
| Total | 119 | 100.0% |
Internet Access in Creston
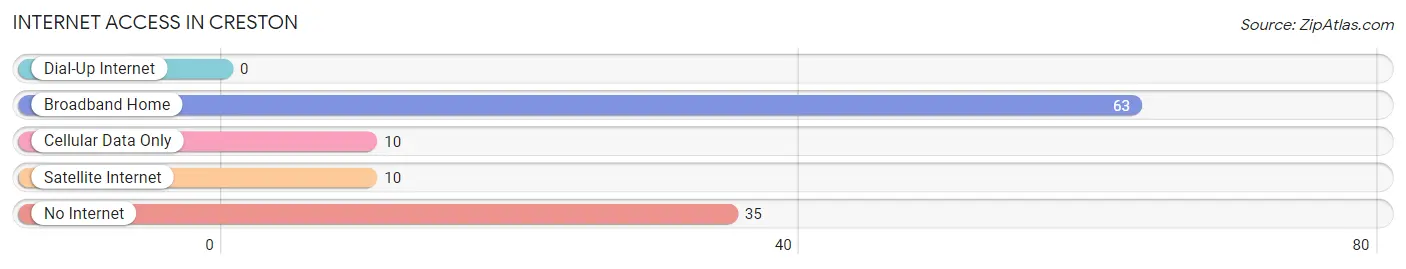
| Internet Type | # Households | % Households |
| Dial-Up Internet | 0 | 0.0% |
| Broadband Home | 63 | 52.9% |
| Cellular Data Only | 10 | 8.4% |
| Satellite Internet | 10 | 8.4% |
| No Internet | 35 | 29.4% |
| Total | 119 | 100.0% |
Creston Summary
Creston is a small town located in the state of Washington, United States. It is situated in the southeastern corner of the state, near the border with Idaho. The town is located in the Columbia River Gorge, a region of the Pacific Northwest known for its stunning natural beauty. The town is home to a population of just over 1,000 people, and is a popular destination for outdoor recreation and sightseeing.
History
The area that is now Creston was first settled in the late 1800s by homesteaders and ranchers. The town was officially founded in 1891, and was named after the nearby mountain peak, Mount Creston. The town quickly grew, and by the early 1900s, it had become a popular destination for tourists and outdoor enthusiasts.
In the early 20th century, the town was home to a thriving logging industry, and the local economy was largely based on the timber industry. The town also had a thriving agricultural sector, with many local farmers growing apples, pears, and other fruits and vegetables.
In the 1950s, the town began to experience a decline in population as many of the local industries began to decline. The town was also affected by the construction of the Grand Coulee Dam, which flooded much of the surrounding area. In the late 20th century, the town began to experience a resurgence in population as people began to move to the area for its natural beauty and recreational opportunities.
Geography
Creston is located in the southeastern corner of Washington, near the border with Idaho. The town is situated in the Columbia River Gorge, a region of the Pacific Northwest known for its stunning natural beauty. The town is surrounded by mountains, rivers, and forests, and is home to a variety of wildlife.
The town is located at an elevation of 1,400 feet, and has a total area of 1.2 square miles. The town is located in a temperate climate, with warm summers and mild winters.
Economy
The local economy of Creston is largely based on tourism and outdoor recreation. The town is home to a variety of outdoor activities, including hiking, camping, fishing, and hunting. The town is also home to a number of small businesses, including restaurants, shops, and galleries.
The town is also home to a number of agricultural operations, including apple orchards, vineyards, and farms. The local economy is also supported by the nearby Grand Coulee Dam, which provides hydroelectric power to the region.
Demographics
As of the 2010 census, the population of Creston was 1,072. The town has a population density of 890 people per square mile. The median age of the population is 44.7 years, and the median household income is $45,000.
The town is predominantly white, with 92.3% of the population identifying as white. The town also has a small Hispanic population, with 4.3% of the population identifying as Hispanic or Latino. The town also has a small Native American population, with 1.2% of the population identifying as Native American.
Conclusion
Creston is a small town located in the southeastern corner of Washington, near the border with Idaho. The town is situated in the Columbia River Gorge, a region of the Pacific Northwest known for its stunning natural beauty. The town is home to a population of just over 1,000 people, and is a popular destination for outdoor recreation and sightseeing. The local economy is largely based on tourism and outdoor recreation, and the town is also home to a number of agricultural operations. The town is predominantly white, with 92.3% of the population identifying as white.
Common Questions
What is Per Capita Income in Creston?
Per Capita income in Creston is $42,354.
What is the Median Family Income in Creston?
Median Family Income in Creston is $82,250.
What is the Median Household income in Creston?
Median Household Income in Creston is $54,792.
What is Income or Wage Gap in Creston?
Income or Wage Gap in Creston is 8.6%.
Women in Creston earn 91.4 cents for every dollar earned by a man.
What is Inequality or Gini Index in Creston?
Inequality or Gini Index in Creston is 0.37.
What is the Total Population of Creston?
Total Population of Creston is 213.
What is the Total Male Population of Creston?
Total Male Population of Creston is 128.
What is the Total Female Population of Creston?
Total Female Population of Creston is 85.
What is the Ratio of Males per 100 Females in Creston?
There are 150.59 Males per 100 Females in Creston.
What is the Ratio of Females per 100 Males in Creston?
There are 66.41 Females per 100 Males in Creston.
What is the Median Population Age in Creston?
Median Population Age in Creston is 61.8 Years.
What is the Average Family Size in Creston
Average Family Size in Creston is 2.6 People.
What is the Average Household Size in Creston
Average Household Size in Creston is 1.8 People.
How Large is the Labor Force in Creston?
There are 74 People in the Labor Forcein in Creston.
What is the Percentage of People in the Labor Force in Creston?
37.0% of People are in the Labor Force in Creston.