Zip Codes with the Highest Percentage of Population Employed in Food Preparation & Serving in Sammamish, WA
RELATED REPORTS & OPTIONS
Food Preparation & Serving
Sammamish
Compare Zip Codes
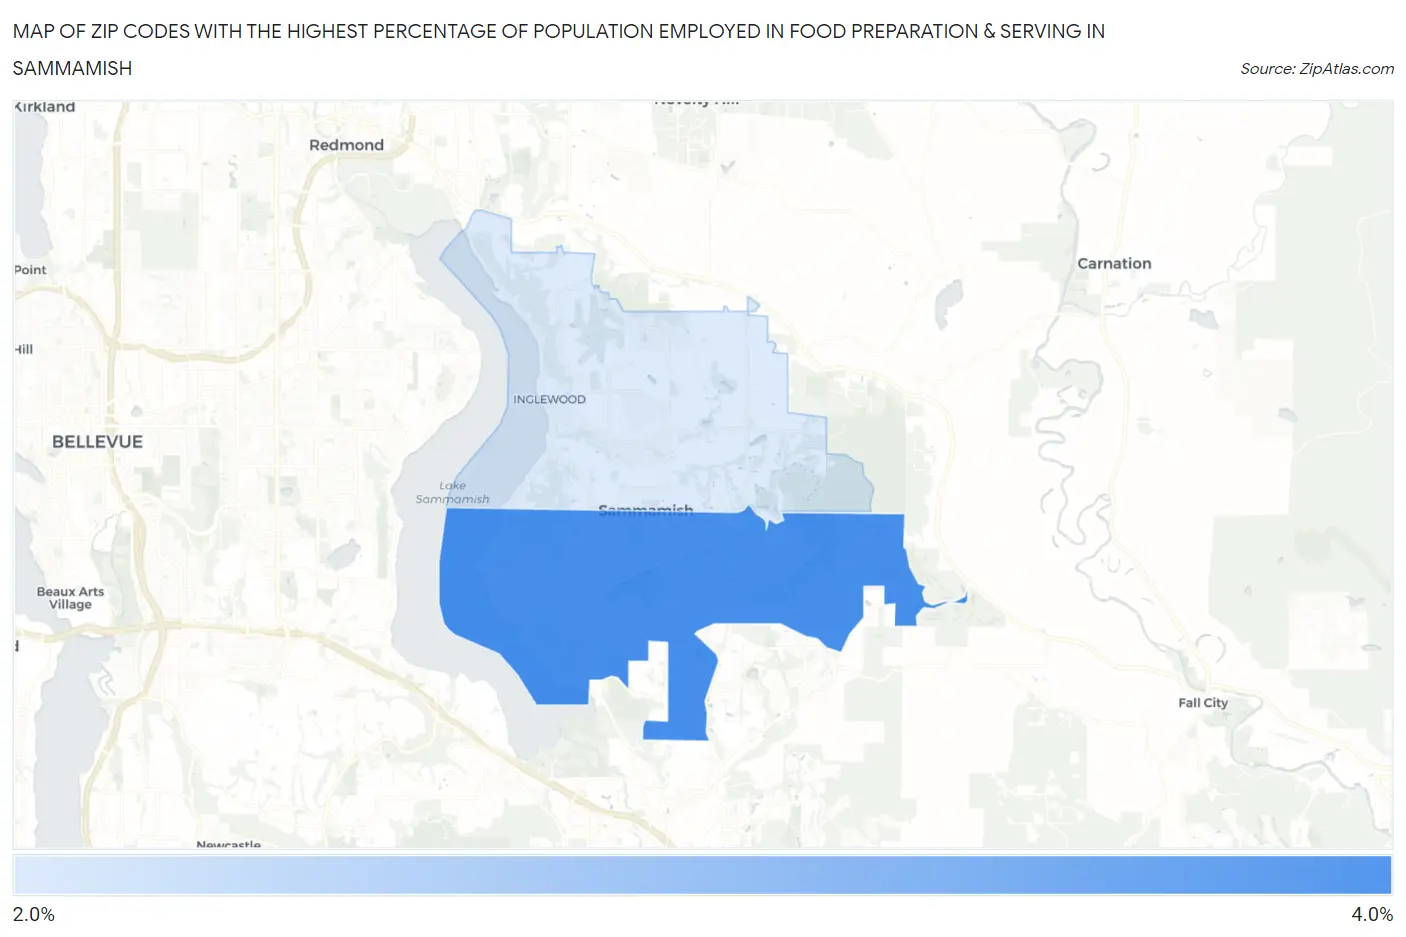
Map of Zip Codes with the Highest Percentage of Population Employed in Food Preparation & Serving in Sammamish
2.9%
3.3%
Zip Codes with the Highest Percentage of Population Employed in Food Preparation & Serving in Sammamish, WA
| Zip Code | % Employed | vs State | vs National | |
| 1. | 98075 | 3.3% | 5.1%(-1.89)#381 | 5.3%(-2.03)#20,270 |
| 2. | 98074 | 2.9% | 5.1%(-2.21)#402 | 5.3%(-2.36)#21,521 |
1
Common Questions
What are the Top Zip Codes with the Highest Percentage of Population Employed in Food Preparation & Serving in Sammamish, WA?
Top Zip Codes with the Highest Percentage of Population Employed in Food Preparation & Serving in Sammamish, WA are:
What zip code has the Highest Percentage of Population Employed in Food Preparation & Serving in Sammamish, WA?
98075 has the Highest Percentage of Population Employed in Food Preparation & Serving in Sammamish, WA with 3.3%.
What is the Percentage of Population Employed in Food Preparation & Serving in Sammamish, WA?
Percentage of Population Employed in Food Preparation & Serving in Sammamish is 3.6%.
What is the Percentage of Population Employed in Food Preparation & Serving in Washington?
Percentage of Population Employed in Food Preparation & Serving in Washington is 5.1%.
What is the Percentage of Population Employed in Food Preparation & Serving in the United States?
Percentage of Population Employed in Food Preparation & Serving in the United States is 5.3%.