Cities with the Highest Percentage of Filipino Population in Washington
RELATED REPORTS & OPTIONS
Filipino
Washington
Compare Cities
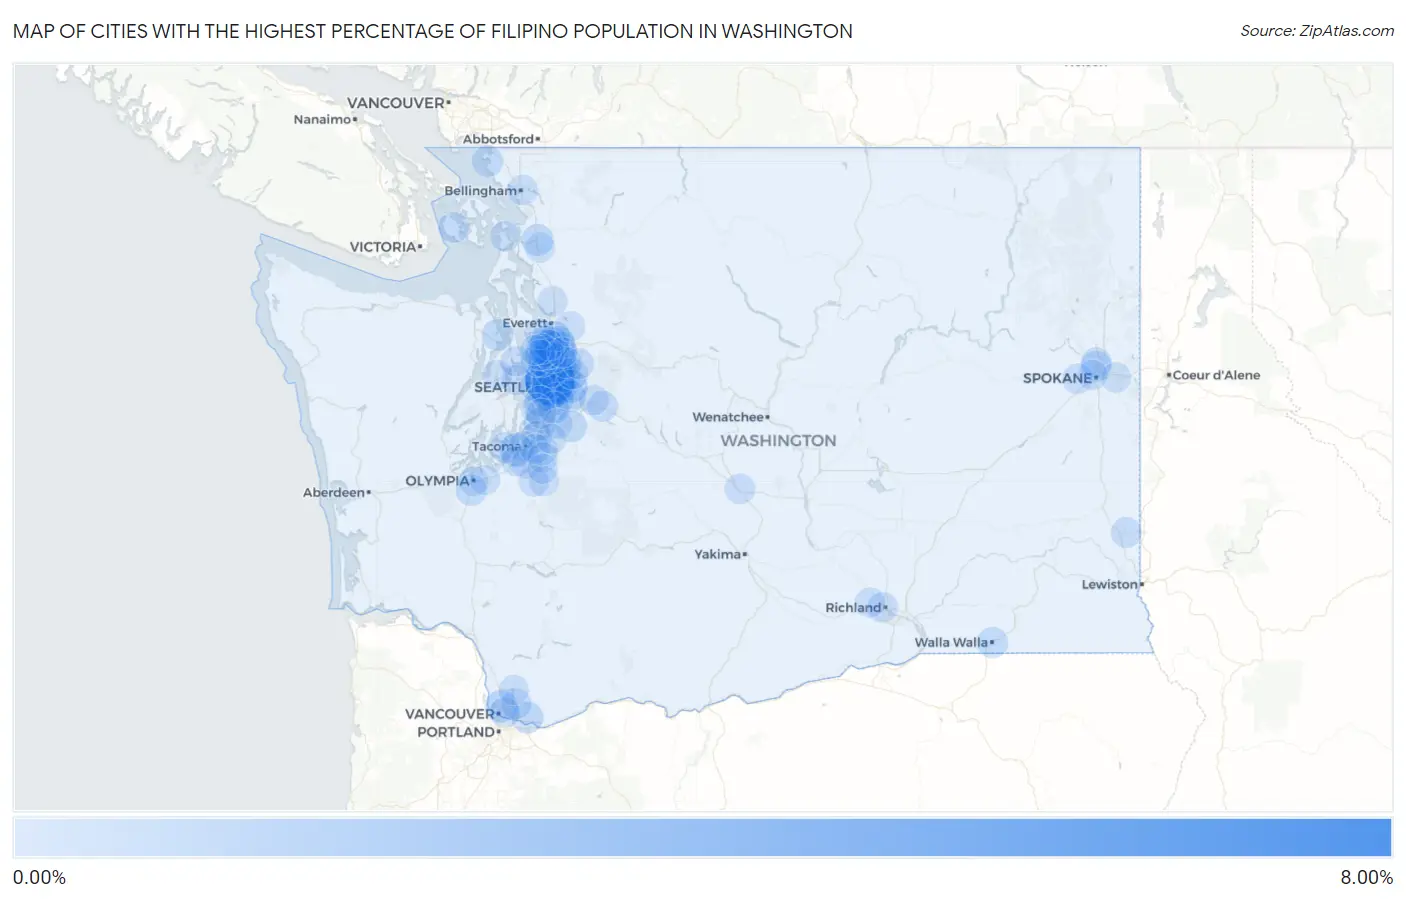
Map of Cities with the Highest Percentage of Filipino Population in Washington
0.00%
8.00%
Cities with the Highest Percentage of Filipino Population in Washington
| City | Filipino | vs State | vs National | |
| 1. | Yarrow Point | 6.02% | 0.19%(+5.83)#1 | 0.085%(+5.93)#5 |
| 2. | Kenmore | 1.78% | 0.19%(+1.59)#2 | 0.085%(+1.70)#72 |
| 3. | Mercer Island | 1.60% | 0.19%(+1.41)#3 | 0.085%(+1.51)#83 |
| 4. | Woodinville | 1.59% | 0.19%(+1.41)#4 | 0.085%(+1.51)#85 |
| 5. | Beaux Arts Village | 1.55% | 0.19%(+1.36)#5 | 0.085%(+1.47)#89 |
| 6. | Clearview | 1.41% | 0.19%(+1.22)#6 | 0.085%(+1.32)#105 |
| 7. | Clyde Hill | 1.38% | 0.19%(+1.19)#7 | 0.085%(+1.30)#112 |
| 8. | Bellevue | 1.31% | 0.19%(+1.12)#8 | 0.085%(+1.22)#129 |
| 9. | Larch Way | 1.14% | 0.19%(+0.948)#9 | 0.085%(+1.05)#153 |
| 10. | Redmond | 1.09% | 0.19%(+0.899)#10 | 0.085%(+1.00)#170 |
| 11. | Fircrest | 0.94% | 0.19%(+0.755)#11 | 0.085%(+0.859)#202 |
| 12. | Medina | 0.92% | 0.19%(+0.735)#12 | 0.085%(+0.839)#207 |
| 13. | Sammamish | 0.87% | 0.19%(+0.679)#13 | 0.085%(+0.783)#223 |
| 14. | Mill Creek | 0.82% | 0.19%(+0.629)#14 | 0.085%(+0.733)#240 |
| 15. | Newcastle | 0.80% | 0.19%(+0.608)#15 | 0.085%(+0.712)#253 |
| 16. | Fairwood Cdp King County | 0.68% | 0.19%(+0.494)#16 | 0.085%(+0.598)#307 |
| 17. | Hazel Dell | 0.68% | 0.19%(+0.489)#17 | 0.085%(+0.593)#310 |
| 18. | Silver Firs | 0.66% | 0.19%(+0.473)#18 | 0.085%(+0.576)#315 |
| 19. | Mill Creek East | 0.64% | 0.19%(+0.456)#19 | 0.085%(+0.559)#328 |
| 20. | Kirkland | 0.61% | 0.19%(+0.423)#20 | 0.085%(+0.527)#349 |
| 21. | Des Moines | 0.58% | 0.19%(+0.393)#21 | 0.085%(+0.497)#366 |
| 22. | Burlington | 0.56% | 0.19%(+0.367)#22 | 0.085%(+0.471)#385 |
| 23. | Seattle | 0.55% | 0.19%(+0.366)#23 | 0.085%(+0.470)#387 |
| 24. | Bothell East | 0.55% | 0.19%(+0.363)#24 | 0.085%(+0.467)#388 |
| 25. | Camas | 0.53% | 0.19%(+0.342)#25 | 0.085%(+0.446)#405 |
| 26. | Issaquah | 0.53% | 0.19%(+0.339)#26 | 0.085%(+0.443)#406 |
| 27. | Renton | 0.52% | 0.19%(+0.327)#27 | 0.085%(+0.431)#412 |
| 28. | Port Ludlow | 0.45% | 0.19%(+0.264)#28 | 0.085%(+0.367)#471 |
| 29. | Maple Valley | 0.44% | 0.19%(+0.256)#29 | 0.085%(+0.360)#476 |
| 30. | Union Hill Novelty Hill | 0.38% | 0.19%(+0.191)#30 | 0.085%(+0.295)#551 |
| 31. | Birch Bay | 0.36% | 0.19%(+0.170)#31 | 0.085%(+0.274)#570 |
| 32. | Lake Stickney | 0.35% | 0.19%(+0.159)#32 | 0.085%(+0.263)#583 |
| 33. | Brier | 0.31% | 0.19%(+0.117)#33 | 0.085%(+0.221)#644 |
| 34. | Walla Walla | 0.30% | 0.19%(+0.110)#34 | 0.085%(+0.214)#658 |
| 35. | Tumwater | 0.29% | 0.19%(+0.104)#35 | 0.085%(+0.208)#670 |
| 36. | Shoreline | 0.29% | 0.19%(+0.103)#36 | 0.085%(+0.207)#672 |
| 37. | Bothell | 0.25% | 0.19%(+0.060)#37 | 0.085%(+0.164)#747 |
| 38. | Town And Country | 0.25% | 0.19%(+0.059)#38 | 0.085%(+0.163)#749 |
| 39. | Fox Island | 0.25% | 0.19%(+0.058)#39 | 0.085%(+0.162)#752 |
| 40. | Cottage Lake | 0.25% | 0.19%(+0.057)#40 | 0.085%(+0.161)#755 |
| 41. | Lake Forest Park | 0.25% | 0.19%(+0.056)#41 | 0.085%(+0.160)#757 |
| 42. | Alderwood Manor | 0.23% | 0.19%(+0.039)#42 | 0.085%(+0.143)#789 |
| 43. | North Bend | 0.21% | 0.19%(+0.023)#43 | 0.085%(+0.127)#822 |
| 44. | Boulevard Park | 0.20% | 0.19%(+0.015)#44 | 0.085%(+0.119)#841 |
| 45. | Duvall | 0.20% | 0.19%(+0.008)#45 | 0.085%(+0.112)#868 |
| 46. | Friday Harbor | 0.19% | 0.19%(+0.000)#46 | 0.085%(+0.104)#892 |
| 47. | Orchards | 0.18% | 0.19%(-0.011)#47 | 0.085%(+0.093)#920 |
| 48. | Pullman | 0.18% | 0.19%(-0.014)#48 | 0.085%(+0.090)#928 |
| 49. | Bothell West | 0.17% | 0.19%(-0.023)#49 | 0.085%(+0.081)#963 |
| 50. | Eastmont | 0.16% | 0.19%(-0.029)#50 | 0.085%(+0.075)#986 |
| 51. | Ellensburg | 0.15% | 0.19%(-0.036)#51 | 0.085%(+0.068)#1,005 |
| 52. | Airway Heights | 0.15% | 0.19%(-0.037)#52 | 0.085%(+0.067)#1,013 |
| 53. | Martha Lake | 0.15% | 0.19%(-0.042)#53 | 0.085%(+0.061)#1,036 |
| 54. | Elk Plain | 0.14% | 0.19%(-0.048)#54 | 0.085%(+0.056)#1,053 |
| 55. | Mukilteo | 0.14% | 0.19%(-0.048)#55 | 0.085%(+0.056)#1,055 |
| 56. | Richland | 0.14% | 0.19%(-0.049)#56 | 0.085%(+0.055)#1,060 |
| 57. | Burien | 0.12% | 0.19%(-0.066)#57 | 0.085%(+0.038)#1,152 |
| 58. | Bainbridge Island | 0.12% | 0.19%(-0.071)#58 | 0.085%(+0.033)#1,178 |
| 59. | Federal Way | 0.11% | 0.19%(-0.078)#59 | 0.085%(+0.026)#1,209 |
| 60. | Vancouver | 0.11% | 0.19%(-0.079)#60 | 0.085%(+0.025)#1,210 |
| 61. | Lynnwood | 0.11% | 0.19%(-0.081)#61 | 0.085%(+0.023)#1,225 |
| 62. | Mountlake Terrace | 0.10% | 0.19%(-0.086)#62 | 0.085%(+0.018)#1,251 |
| 63. | Country Homes | 0.096% | 0.19%(-0.093)#63 | 0.085%(+0.011)#1,292 |
| 64. | Snoqualmie | 0.087% | 0.19%(-0.101)#64 | 0.085%(+0.002)#1,336 |
| 65. | Bellingham | 0.085% | 0.19%(-0.103)#65 | 0.085%(+0.001)#1,348 |
| 66. | Indianola | 0.084% | 0.19%(-0.104)#66 | 0.085%(-0.000)#1,356 |
| 67. | Edgewood | 0.081% | 0.19%(-0.108)#67 | 0.085%(-0.004)#1,383 |
| 68. | Tacoma | 0.071% | 0.19%(-0.118)#68 | 0.085%(-0.014)#1,446 |
| 69. | Maltby | 0.071% | 0.19%(-0.118)#69 | 0.085%(-0.014)#1,447 |
| 70. | Seatac | 0.068% | 0.19%(-0.121)#70 | 0.085%(-0.017)#1,467 |
| 71. | Lakewood | 0.063% | 0.19%(-0.125)#71 | 0.085%(-0.021)#1,501 |
| 72. | Marysville | 0.058% | 0.19%(-0.131)#72 | 0.085%(-0.027)#1,547 |
| 73. | Anacortes | 0.057% | 0.19%(-0.132)#73 | 0.085%(-0.028)#1,565 |
| 74. | Kent | 0.055% | 0.19%(-0.134)#74 | 0.085%(-0.030)#1,574 |
| 75. | West Richland | 0.054% | 0.19%(-0.134)#75 | 0.085%(-0.030)#1,580 |
| 76. | Mount Vernon | 0.054% | 0.19%(-0.135)#76 | 0.085%(-0.031)#1,584 |
| 77. | Parkland | 0.048% | 0.19%(-0.140)#77 | 0.085%(-0.037)#1,639 |
| 78. | Edmonds | 0.047% | 0.19%(-0.142)#78 | 0.085%(-0.038)#1,653 |
| 79. | Spokane Valley | 0.041% | 0.19%(-0.147)#79 | 0.085%(-0.043)#1,688 |
| 80. | Silverdale | 0.041% | 0.19%(-0.147)#80 | 0.085%(-0.043)#1,691 |
| 81. | Everett | 0.041% | 0.19%(-0.148)#81 | 0.085%(-0.044)#1,698 |
| 82. | Spokane | 0.034% | 0.19%(-0.154)#82 | 0.085%(-0.051)#1,748 |
| 83. | Graham | 0.032% | 0.19%(-0.157)#83 | 0.085%(-0.053)#1,768 |
| 84. | Lacey | 0.030% | 0.19%(-0.158)#84 | 0.085%(-0.055)#1,779 |
| 85. | Fife | 0.028% | 0.19%(-0.161)#85 | 0.085%(-0.057)#1,806 |
| 86. | Battle Ground | 0.024% | 0.19%(-0.165)#86 | 0.085%(-0.061)#1,843 |
| 87. | Puyallup | 0.019% | 0.19%(-0.170)#87 | 0.085%(-0.066)#1,899 |
| 88. | Olympia | 0.018% | 0.19%(-0.171)#88 | 0.085%(-0.067)#1,905 |
| 89. | South Hill | 0.015% | 0.19%(-0.174)#89 | 0.085%(-0.070)#1,935 |
| 90. | Auburn | 0.012% | 0.19%(-0.177)#90 | 0.085%(-0.073)#1,958 |
Common Questions
What are the Top 10 Cities with the Highest Percentage of Filipino Population in Washington?
Top 10 Cities with the Highest Percentage of Filipino Population in Washington are:
#1
6.02%
#2
1.78%
#3
1.60%
#4
1.59%
#5
1.55%
#6
1.41%
#7
1.38%
#8
1.31%
#9
1.14%
#10
1.09%
What city has the Highest Percentage of Filipino Population in Washington?
Yarrow Point has the Highest Percentage of Filipino Population in Washington with 6.02%.
What is the Percentage of Filipino Population in the State of Washington?
Percentage of Filipino Population in Washington is 0.19%.
What is the Percentage of Filipino Population in the United States?
Percentage of Filipino Population in the United States is 0.085%.