Cities with the Highest Percentage of Population Employed in Health Technologists in Washington
RELATED REPORTS & OPTIONS
Health Technologists
Washington
Compare Cities
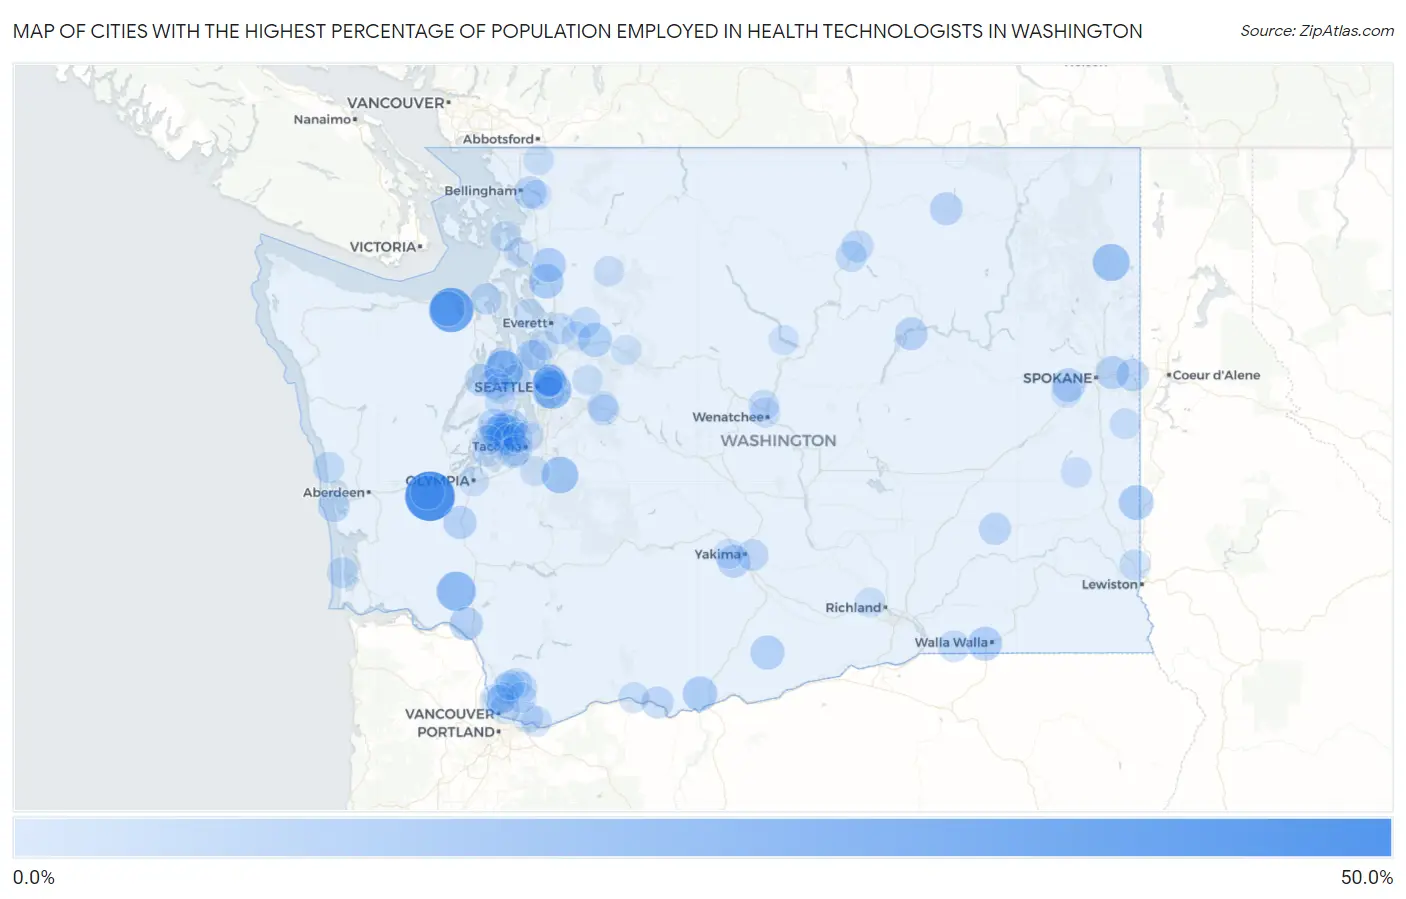
Map of Cities with the Highest Percentage of Population Employed in Health Technologists in Washington
0.0%
50.0%
Cities with the Highest Percentage of Population Employed in Health Technologists in Washington
| City | % Employed | vs State | vs National | |
| 1. | Porter | 42.0% | 4.0%(+38.0)#1 | 4.3%(+37.7)#69 |
| 2. | Pataha | 32.5% | 4.0%(+28.5)#2 | 4.3%(+28.2)#126 |
| 3. | Bell Hill | 32.0% | 4.0%(+28.0)#3 | 4.3%(+27.7)#131 |
| 4. | Sunland Estates | 22.7% | 4.0%(+18.7)#4 | 4.3%(+18.4)#275 |
| 5. | Ryderwood | 22.0% | 4.0%(+18.0)#5 | 4.3%(+17.7)#295 |
| 6. | Keyport | 21.2% | 4.0%(+17.2)#6 | 4.3%(+16.9)#318 |
| 7. | Beaux Arts Village | 19.6% | 4.0%(+15.6)#7 | 4.3%(+15.3)#380 |
| 8. | Cusick | 18.2% | 4.0%(+14.2)#8 | 4.3%(+13.9)#460 |
| 9. | Crocker | 17.3% | 4.0%(+13.3)#9 | 4.3%(+13.0)#501 |
| 10. | River Road | 14.5% | 4.0%(+10.5)#10 | 4.3%(+10.3)#747 |
| 11. | Gig Harbor | 14.5% | 4.0%(+10.5)#11 | 4.3%(+10.2)#752 |
| 12. | Raft Island | 13.8% | 4.0%(+9.83)#12 | 4.3%(+9.55)#835 |
| 13. | Palouse | 13.8% | 4.0%(+9.75)#13 | 4.3%(+9.47)#847 |
| 14. | Sunday Lake | 13.6% | 4.0%(+9.58)#14 | 4.3%(+9.29)#886 |
| 15. | Centerville | 13.4% | 4.0%(+9.43)#15 | 4.3%(+9.15)#909 |
| 16. | Lake Mcmurray | 13.1% | 4.0%(+9.07)#16 | 4.3%(+8.78)#963 |
| 17. | Malone | 12.8% | 4.0%(+8.84)#17 | 4.3%(+8.55)#1,010 |
| 18. | Garrett | 12.8% | 4.0%(+8.79)#18 | 4.3%(+8.50)#1,019 |
| 19. | North Sultan | 12.5% | 4.0%(+8.50)#19 | 4.3%(+8.21)#1,073 |
| 20. | Bickleton | 12.5% | 4.0%(+8.50)#20 | 4.3%(+8.21)#1,083 |
| 21. | Maplewood | 11.9% | 4.0%(+7.90)#21 | 4.3%(+7.61)#1,212 |
| 22. | Rosedale | 11.8% | 4.0%(+7.85)#22 | 4.3%(+7.56)#1,224 |
| 23. | Longview Heights | 11.5% | 4.0%(+7.50)#23 | 4.3%(+7.22)#1,317 |
| 24. | Fairchild Afb | 11.3% | 4.0%(+7.33)#24 | 4.3%(+7.04)#1,369 |
| 25. | Grand Mound | 11.3% | 4.0%(+7.29)#25 | 4.3%(+7.00)#1,379 |
| 26. | Millwood | 11.3% | 4.0%(+7.28)#26 | 4.3%(+6.99)#1,380 |
| 27. | Artondale | 10.6% | 4.0%(+6.62)#27 | 4.3%(+6.34)#1,565 |
| 28. | Ahtanum | 10.6% | 4.0%(+6.59)#28 | 4.3%(+6.30)#1,585 |
| 29. | Yarrow Point | 10.5% | 4.0%(+6.51)#29 | 4.3%(+6.22)#1,605 |
| 30. | Electric City | 10.4% | 4.0%(+6.37)#30 | 4.3%(+6.09)#1,647 |
| 31. | Republic | 10.3% | 4.0%(+6.29)#31 | 4.3%(+6.00)#1,688 |
| 32. | Seabeck | 9.8% | 4.0%(+5.82)#32 | 4.3%(+5.53)#1,864 |
| 33. | Geneva | 9.8% | 4.0%(+5.81)#33 | 4.3%(+5.53)#1,866 |
| 34. | Liberty Lake | 9.5% | 4.0%(+5.50)#34 | 4.3%(+5.22)#2,016 |
| 35. | Stansberry Lake | 9.4% | 4.0%(+5.43)#35 | 4.3%(+5.14)#2,048 |
| 36. | Washtucna | 9.3% | 4.0%(+5.30)#36 | 4.3%(+5.02)#2,112 |
| 37. | Mercer Island | 9.3% | 4.0%(+5.29)#37 | 4.3%(+5.00)#2,125 |
| 38. | Wollochet | 9.2% | 4.0%(+5.21)#38 | 4.3%(+4.92)#2,158 |
| 39. | Clyde Hill | 9.1% | 4.0%(+5.13)#39 | 4.3%(+4.85)#2,195 |
| 40. | Lyle | 9.0% | 4.0%(+4.99)#40 | 4.3%(+4.70)#2,296 |
| 41. | Omak | 8.9% | 4.0%(+4.86)#41 | 4.3%(+4.57)#2,379 |
| 42. | Terrace Heights | 8.4% | 4.0%(+4.39)#42 | 4.3%(+4.11)#2,680 |
| 43. | Fircrest | 8.3% | 4.0%(+4.31)#43 | 4.3%(+4.03)#2,734 |
| 44. | Westport | 8.3% | 4.0%(+4.31)#44 | 4.3%(+4.02)#2,735 |
| 45. | Hunts Point | 8.2% | 4.0%(+4.20)#45 | 4.3%(+3.91)#2,808 |
| 46. | Fobes Hill | 8.2% | 4.0%(+4.19)#46 | 4.3%(+3.90)#2,814 |
| 47. | Venersborg | 8.2% | 4.0%(+4.16)#47 | 4.3%(+3.87)#2,852 |
| 48. | Copalis Beach | 8.0% | 4.0%(+3.96)#48 | 4.3%(+3.67)#3,014 |
| 49. | University Place | 7.9% | 4.0%(+3.94)#49 | 4.3%(+3.65)#3,028 |
| 50. | Lewisville | 7.9% | 4.0%(+3.92)#50 | 4.3%(+3.63)#3,050 |
| 51. | Touchet | 7.9% | 4.0%(+3.90)#51 | 4.3%(+3.61)#3,069 |
| 52. | Port Townsend | 7.8% | 4.0%(+3.83)#52 | 4.3%(+3.54)#3,124 |
| 53. | Dollars Corner | 7.7% | 4.0%(+3.74)#53 | 4.3%(+3.45)#3,209 |
| 54. | Okanogan | 7.7% | 4.0%(+3.74)#54 | 4.3%(+3.45)#3,211 |
| 55. | Esperance | 7.7% | 4.0%(+3.70)#55 | 4.3%(+3.41)#3,237 |
| 56. | Ocean Park | 7.6% | 4.0%(+3.64)#56 | 4.3%(+3.36)#3,314 |
| 57. | Bainbridge Island | 7.2% | 4.0%(+3.24)#57 | 4.3%(+2.96)#3,679 |
| 58. | Lake Roesiger | 7.2% | 4.0%(+3.16)#58 | 4.3%(+2.88)#3,768 |
| 59. | Uniontown | 7.1% | 4.0%(+3.14)#59 | 4.3%(+2.86)#3,791 |
| 60. | Felida | 7.1% | 4.0%(+3.11)#60 | 4.3%(+2.83)#3,844 |
| 61. | Longbranch | 6.9% | 4.0%(+2.95)#61 | 4.3%(+2.66)#4,031 |
| 62. | Riverbend | 6.9% | 4.0%(+2.93)#62 | 4.3%(+2.64)#4,051 |
| 63. | Chico | 6.9% | 4.0%(+2.92)#63 | 4.3%(+2.63)#4,063 |
| 64. | Camas | 6.8% | 4.0%(+2.78)#64 | 4.3%(+2.49)#4,235 |
| 65. | White Salmon | 6.8% | 4.0%(+2.76)#65 | 4.3%(+2.47)#4,270 |
| 66. | North Bend | 6.7% | 4.0%(+2.74)#66 | 4.3%(+2.46)#4,282 |
| 67. | Mount Vista | 6.7% | 4.0%(+2.74)#67 | 4.3%(+2.45)#4,291 |
| 68. | Washougal | 6.7% | 4.0%(+2.71)#68 | 4.3%(+2.43)#4,327 |
| 69. | Fairfield | 6.7% | 4.0%(+2.70)#69 | 4.3%(+2.41)#4,350 |
| 70. | Hockinson | 6.7% | 4.0%(+2.65)#70 | 4.3%(+2.37)#4,411 |
| 71. | Sunnyslope | 6.6% | 4.0%(+2.57)#71 | 4.3%(+2.29)#4,519 |
| 72. | Ruston | 6.5% | 4.0%(+2.50)#72 | 4.3%(+2.21)#4,611 |
| 73. | St John | 6.4% | 4.0%(+2.43)#73 | 4.3%(+2.15)#4,702 |
| 74. | Minnehaha | 6.4% | 4.0%(+2.43)#74 | 4.3%(+2.14)#4,711 |
| 75. | Dash Point | 6.4% | 4.0%(+2.38)#75 | 4.3%(+2.10)#4,760 |
| 76. | Medina | 6.4% | 4.0%(+2.37)#76 | 4.3%(+2.08)#4,780 |
| 77. | Port Orchard | 6.3% | 4.0%(+2.31)#77 | 4.3%(+2.02)#4,868 |
| 78. | Rocky Point | 6.3% | 4.0%(+2.27)#78 | 4.3%(+1.98)#4,930 |
| 79. | Carnation | 6.2% | 4.0%(+2.19)#79 | 4.3%(+1.91)#5,055 |
| 80. | Woodway | 6.2% | 4.0%(+2.19)#80 | 4.3%(+1.90)#5,060 |
| 81. | Home | 6.2% | 4.0%(+2.15)#81 | 4.3%(+1.87)#5,124 |
| 82. | Swede Heaven | 6.1% | 4.0%(+2.14)#82 | 4.3%(+1.85)#5,162 |
| 83. | Medical Lake | 6.1% | 4.0%(+2.05)#83 | 4.3%(+1.77)#5,292 |
| 84. | Nooksack | 6.0% | 4.0%(+2.01)#84 | 4.3%(+1.72)#5,368 |
| 85. | Wenatchee | 6.0% | 4.0%(+1.96)#85 | 4.3%(+1.68)#5,446 |
| 86. | Poulsbo | 5.9% | 4.0%(+1.90)#86 | 4.3%(+1.62)#5,534 |
| 87. | Summitview | 5.9% | 4.0%(+1.87)#87 | 4.3%(+1.58)#5,603 |
| 88. | Salmon Creek | 5.8% | 4.0%(+1.81)#88 | 4.3%(+1.53)#5,679 |
| 89. | Index | 5.8% | 4.0%(+1.77)#89 | 4.3%(+1.48)#5,765 |
| 90. | West Richland | 5.8% | 4.0%(+1.76)#90 | 4.3%(+1.48)#5,775 |
| 91. | Olympia | 5.8% | 4.0%(+1.75)#91 | 4.3%(+1.47)#5,785 |
| 92. | Cherry Grove | 5.7% | 4.0%(+1.74)#92 | 4.3%(+1.46)#5,807 |
| 93. | Langley | 5.7% | 4.0%(+1.72)#93 | 4.3%(+1.43)#5,847 |
| 94. | Sudden Valley | 5.7% | 4.0%(+1.71)#94 | 4.3%(+1.43)#5,867 |
| 95. | Chain Lake | 5.7% | 4.0%(+1.71)#95 | 4.3%(+1.42)#5,876 |
| 96. | North Lynnwood | 5.6% | 4.0%(+1.65)#96 | 4.3%(+1.36)#5,977 |
| 97. | Anacortes | 5.6% | 4.0%(+1.62)#97 | 4.3%(+1.33)#6,039 |
| 98. | Manson | 5.6% | 4.0%(+1.60)#98 | 4.3%(+1.32)#6,067 |
| 99. | Frederickson | 5.6% | 4.0%(+1.56)#99 | 4.3%(+1.27)#6,144 |
| 100. | La Conner | 5.5% | 4.0%(+1.53)#100 | 4.3%(+1.25)#6,208 |
Common Questions
What are the Top 10 Cities with the Highest Percentage of Population Employed in Health Technologists in Washington?
Top 10 Cities with the Highest Percentage of Population Employed in Health Technologists in Washington are:
#1
42.0%
#2
32.0%
#3
22.0%
#4
21.2%
#5
19.6%
#6
18.2%
#7
17.3%
#8
14.5%
#9
14.5%
#10
13.8%
What city has the Highest Percentage of Population Employed in Health Technologists in Washington?
Porter has the Highest Percentage of Population Employed in Health Technologists in Washington with 42.0%.
What is the Percentage of Population Employed in Health Technologists in the State of Washington?
Percentage of Population Employed in Health Technologists in Washington is 4.0%.
What is the Percentage of Population Employed in Health Technologists in the United States?
Percentage of Population Employed in Health Technologists in the United States is 4.3%.