Cities with the Highest Poverty Level Among Seniors Over the Age of 75 in Washington
RELATED REPORTS & OPTIONS
Highest Poverty | Seniors 75+
Washington
Compare Cities
Map of Cities with the Highest Poverty Level Among Seniors Over the Age of 75 in Washington
0.0%
100.0%
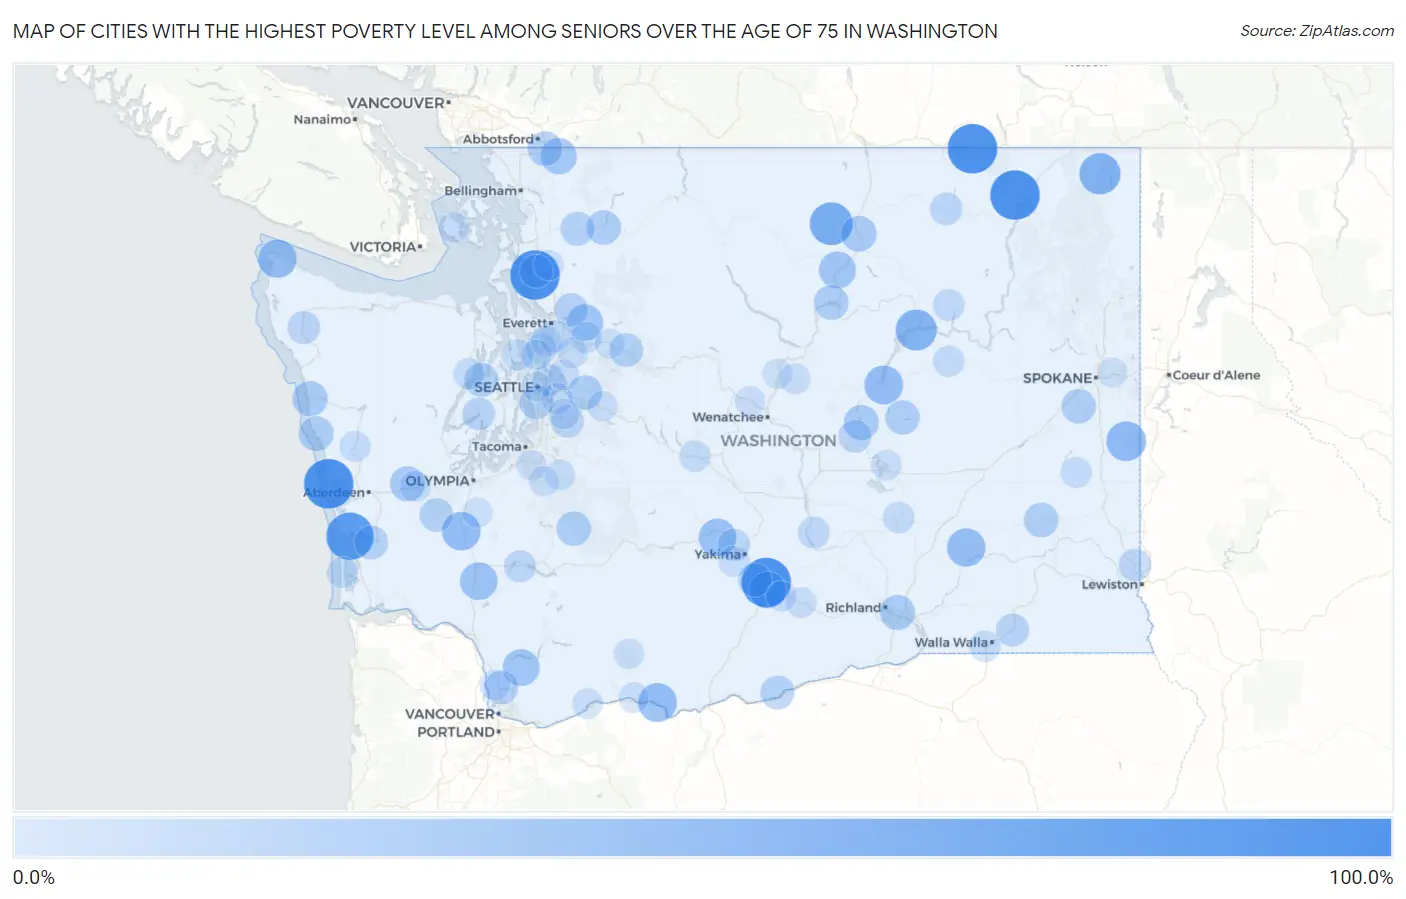
Cities with the Highest Poverty Level Among Seniors Over the Age of 75 in Washington
| City | Senior Poverty | vs State | vs National | |
| 1. | Buena | 100.0% | 8.9%(+91.1)#1 | 11.1%(+88.9)#75 |
| 2. | Danville | 100.0% | 8.9%(+91.1)#2 | 11.1%(+88.9)#266 |
| 3. | Oyehut | 100.0% | 8.9%(+91.1)#3 | 11.1%(+88.9)#321 |
| 4. | Northwest Stanwood | 100.0% | 8.9%(+91.1)#4 | 11.1%(+88.9)#325 |
| 5. | Boyds | 100.0% | 8.9%(+91.1)#5 | 11.1%(+88.9)#360 |
| 6. | Tokeland | 90.0% | 8.9%(+81.1)#6 | 11.1%(+78.9)#425 |
| 7. | Conconully | 70.0% | 8.9%(+61.1)#7 | 11.1%(+58.9)#621 |
| 8. | Metaline | 62.5% | 8.9%(+53.6)#8 | 11.1%(+51.4)#775 |
| 9. | Grand Coulee | 61.5% | 8.9%(+52.6)#9 | 11.1%(+50.5)#799 |
| 10. | Latah | 55.6% | 8.9%(+46.6)#10 | 11.1%(+44.5)#1,004 |
| 11. | Coulee City | 51.5% | 8.9%(+42.6)#11 | 11.1%(+40.4)#1,136 |
| 12. | Lyle | 51.4% | 8.9%(+42.5)#12 | 11.1%(+40.4)#1,142 |
| 13. | Fords Prairie | 50.9% | 8.9%(+41.9)#13 | 11.1%(+39.8)#1,161 |
| 14. | Neah Bay | 50.0% | 8.9%(+41.1)#14 | 11.1%(+38.9)#1,187 |
| 15. | Kahlotus | 50.0% | 8.9%(+41.1)#15 | 11.1%(+38.9)#1,265 |
| 16. | Tieton | 46.7% | 8.9%(+37.7)#16 | 11.1%(+35.6)#1,453 |
| 17. | Toledo | 46.2% | 8.9%(+37.2)#17 | 11.1%(+35.1)#1,487 |
| 18. | Malott | 43.5% | 8.9%(+34.6)#18 | 11.1%(+32.4)#1,643 |
| 19. | Toppenish | 43.2% | 8.9%(+34.3)#19 | 11.1%(+32.1)#1,664 |
| 20. | Amboy | 42.9% | 8.9%(+33.9)#20 | 11.1%(+31.8)#1,677 |
| 21. | Lake Roesiger | 41.5% | 8.9%(+32.6)#21 | 11.1%(+30.4)#1,809 |
| 22. | Peaceful Valley | 40.5% | 8.9%(+31.6)#22 | 11.1%(+29.5)#1,869 |
| 23. | Riverside | 37.9% | 8.9%(+29.0)#23 | 11.1%(+26.9)#2,131 |
| 24. | Queets | 36.4% | 8.9%(+27.4)#24 | 11.1%(+25.3)#2,290 |
| 25. | West Pasco | 35.7% | 8.9%(+26.8)#25 | 11.1%(+24.6)#2,329 |
| 26. | Soap Lake | 35.6% | 8.9%(+26.7)#26 | 11.1%(+24.5)#2,353 |
| 27. | Satsop | 35.4% | 8.9%(+26.5)#27 | 11.1%(+24.3)#2,368 |
| 28. | Taholah | 34.6% | 8.9%(+25.7)#28 | 11.1%(+23.5)#2,454 |
| 29. | Sumas | 33.9% | 8.9%(+25.0)#29 | 11.1%(+22.9)#2,518 |
| 30. | Brewster | 33.8% | 8.9%(+24.8)#30 | 11.1%(+22.7)#2,534 |
| 31. | Cheney | 33.6% | 8.9%(+24.7)#31 | 11.1%(+22.5)#2,544 |
| 32. | Ashford | 33.6% | 8.9%(+24.7)#32 | 11.1%(+22.5)#2,549 |
| 33. | Fall City | 33.3% | 8.9%(+24.4)#33 | 11.1%(+22.3)#2,566 |
| 34. | Concrete | 33.3% | 8.9%(+24.4)#34 | 11.1%(+22.3)#2,587 |
| 35. | Lacrosse | 33.3% | 8.9%(+24.4)#35 | 11.1%(+22.3)#2,616 |
| 36. | Wilson Creek | 32.4% | 8.9%(+23.4)#36 | 11.1%(+21.3)#2,801 |
| 37. | Hamilton | 30.8% | 8.9%(+21.8)#37 | 11.1%(+19.7)#2,993 |
| 38. | Seabeck | 30.2% | 8.9%(+21.2)#38 | 11.1%(+19.1)#3,086 |
| 39. | Duluth | 30.0% | 8.9%(+21.1)#39 | 11.1%(+18.9)#3,101 |
| 40. | Roosevelt | 30.0% | 8.9%(+21.1)#40 | 11.1%(+18.9)#3,137 |
| 41. | South Bend | 29.9% | 8.9%(+21.0)#41 | 11.1%(+18.9)#3,156 |
| 42. | Index | 29.4% | 8.9%(+20.5)#42 | 11.1%(+18.3)#3,240 |
| 43. | Wapato | 29.2% | 8.9%(+20.2)#43 | 11.1%(+18.1)#3,263 |
| 44. | Lochsloy | 29.0% | 8.9%(+20.0)#44 | 11.1%(+17.9)#3,294 |
| 45. | Oakville | 28.6% | 8.9%(+19.6)#45 | 11.1%(+17.5)#3,342 |
| 46. | White Center | 28.5% | 8.9%(+19.6)#46 | 11.1%(+17.4)#3,394 |
| 47. | Lake Ketchum | 27.4% | 8.9%(+18.5)#47 | 11.1%(+16.3)#3,569 |
| 48. | Dixie | 26.7% | 8.9%(+17.7)#48 | 11.1%(+15.6)#3,733 |
| 49. | Ephrata | 26.4% | 8.9%(+17.5)#49 | 11.1%(+15.4)#3,767 |
| 50. | Forks | 26.0% | 8.9%(+17.1)#50 | 11.1%(+14.9)#3,868 |
| 51. | Belfair | 26.0% | 8.9%(+17.1)#51 | 11.1%(+14.9)#3,875 |
| 52. | Shadow Lake | 25.9% | 8.9%(+17.0)#52 | 11.1%(+14.8)#3,899 |
| 53. | Uniontown | 25.0% | 8.9%(+16.1)#53 | 11.1%(+13.9)#4,111 |
| 54. | Republic | 24.6% | 8.9%(+15.7)#54 | 11.1%(+13.5)#4,249 |
| 55. | Gleed | 23.8% | 8.9%(+14.8)#55 | 11.1%(+12.7)#4,441 |
| 56. | Hunts Point | 23.5% | 8.9%(+14.5)#56 | 11.1%(+12.4)#4,526 |
| 57. | Mossyrock | 22.5% | 8.9%(+13.6)#57 | 11.1%(+11.4)#4,797 |
| 58. | Mattawa | 21.9% | 8.9%(+13.0)#58 | 11.1%(+10.8)#4,993 |
| 59. | Keller | 21.4% | 8.9%(+12.5)#59 | 11.1%(+10.4)#5,151 |
| 60. | Eastmont | 20.9% | 8.9%(+11.9)#60 | 11.1%(+9.80)#5,302 |
| 61. | Othello | 20.6% | 8.9%(+11.6)#61 | 11.1%(+9.49)#5,410 |
| 62. | Woods Creek | 19.8% | 8.9%(+10.9)#62 | 11.1%(+8.77)#5,746 |
| 63. | Wilbur | 19.8% | 8.9%(+10.9)#63 | 11.1%(+8.77)#5,749 |
| 64. | South Cle Elum | 19.6% | 8.9%(+10.6)#64 | 11.1%(+8.50)#5,831 |
| 65. | Kingston | 19.3% | 8.9%(+10.4)#65 | 11.1%(+8.26)#5,921 |
| 66. | Roche Harbor | 19.3% | 8.9%(+10.4)#66 | 11.1%(+8.24)#5,931 |
| 67. | Brinnon | 19.3% | 8.9%(+10.4)#67 | 11.1%(+8.22)#5,944 |
| 68. | Lynnwood | 19.0% | 8.9%(+10.1)#68 | 11.1%(+7.97)#6,060 |
| 69. | Ocean Park | 18.8% | 8.9%(+9.86)#69 | 11.1%(+7.71)#6,144 |
| 70. | College Place | 18.8% | 8.9%(+9.83)#70 | 11.1%(+7.68)#6,150 |
| 71. | Elma | 18.5% | 8.9%(+9.61)#71 | 11.1%(+7.46)#6,248 |
| 72. | St John | 18.5% | 8.9%(+9.54)#72 | 11.1%(+7.39)#6,282 |
| 73. | Newcastle | 18.2% | 8.9%(+9.28)#73 | 11.1%(+7.14)#6,384 |
| 74. | Humptulips | 18.2% | 8.9%(+9.26)#74 | 11.1%(+7.11)#6,437 |
| 75. | Lake Stickney | 17.9% | 8.9%(+8.99)#75 | 11.1%(+6.85)#6,540 |
| 76. | High Bridge | 17.9% | 8.9%(+8.97)#76 | 11.1%(+6.83)#6,549 |
| 77. | Ahtanum | 17.7% | 8.9%(+8.75)#77 | 11.1%(+6.61)#6,658 |
| 78. | Waterville | 17.6% | 8.9%(+8.72)#78 | 11.1%(+6.58)#6,662 |
| 79. | Sunnyside | 17.5% | 8.9%(+8.54)#79 | 11.1%(+6.39)#6,763 |
| 80. | Maple Heights Lake Desire | 17.4% | 8.9%(+8.51)#80 | 11.1%(+6.37)#6,769 |
| 81. | Moses Lake | 16.7% | 8.9%(+7.75)#81 | 11.1%(+5.61)#7,073 |
| 82. | Crocker | 16.7% | 8.9%(+7.74)#82 | 11.1%(+5.60)#7,106 |
| 83. | Redmond | 16.6% | 8.9%(+7.68)#83 | 11.1%(+5.53)#7,248 |
| 84. | Ridgefield | 16.4% | 8.9%(+7.48)#84 | 11.1%(+5.34)#7,329 |
| 85. | Stevenson | 16.3% | 8.9%(+7.40)#85 | 11.1%(+5.26)#7,353 |
| 86. | Cashmere | 16.2% | 8.9%(+7.30)#86 | 11.1%(+5.16)#7,399 |
| 87. | White Salmon | 16.1% | 8.9%(+7.19)#87 | 11.1%(+5.04)#7,460 |
| 88. | North Bend | 15.8% | 8.9%(+6.90)#88 | 11.1%(+4.76)#7,603 |
| 89. | Granger | 15.8% | 8.9%(+6.87)#89 | 11.1%(+4.72)#7,615 |
| 90. | Friday Harbor | 15.8% | 8.9%(+6.87)#90 | 11.1%(+4.72)#7,617 |
| 91. | Clover Creek | 15.6% | 8.9%(+6.67)#91 | 11.1%(+4.52)#7,730 |
| 92. | Graham | 15.5% | 8.9%(+6.60)#92 | 11.1%(+4.46)#7,764 |
| 93. | Esperance | 15.5% | 8.9%(+6.56)#93 | 11.1%(+4.42)#7,794 |
| 94. | Trout Lake | 15.2% | 8.9%(+6.30)#94 | 11.1%(+4.15)#7,945 |
| 95. | Tenino | 14.8% | 8.9%(+5.89)#95 | 11.1%(+3.75)#8,157 |
| 96. | Entiat | 14.7% | 8.9%(+5.78)#96 | 11.1%(+3.64)#8,237 |
| 97. | Lake Mcmurray | 14.6% | 8.9%(+5.71)#97 | 11.1%(+3.57)#8,293 |
| 98. | Seattle | 14.5% | 8.9%(+5.60)#98 | 11.1%(+3.45)#8,356 |
| 99. | Gold Bar | 14.5% | 8.9%(+5.55)#99 | 11.1%(+3.41)#8,384 |
| 100. | Millwood | 14.4% | 8.9%(+5.51)#100 | 11.1%(+3.37)#8,405 |
Common Questions
What are the Top 10 Cities with the Highest Poverty Level Among Seniors Over the Age of 75 in Washington?
Top 10 Cities with the Highest Poverty Level Among Seniors Over the Age of 75 in Washington are:
#1
100.0%
#2
100.0%
#3
100.0%
#4
100.0%
#5
100.0%
#6
90.0%
#7
70.0%
#8
62.5%
#9
61.5%
#10
55.6%
What city has the Highest Poverty Level Among Seniors Over the Age of 75 in Washington?
Buena has the Highest Poverty Level Among Seniors Over the Age of 75 in Washington with 100.0%.
What is the Poverty Level Among Seniors Over the Age of 75 in the State of Washington?
Poverty Level Among Seniors Over the Age of 75 in Washington is 8.9%.
What is the Poverty Level Among Seniors Over the Age of 75 in the United States?
Poverty Level Among Seniors Over the Age of 75 in the United States is 11.1%.