Cities with the Highest Median Property Prices in Washington
RELATED REPORTS & OPTIONS
Highest Property Prices
Washington
Compare Cities
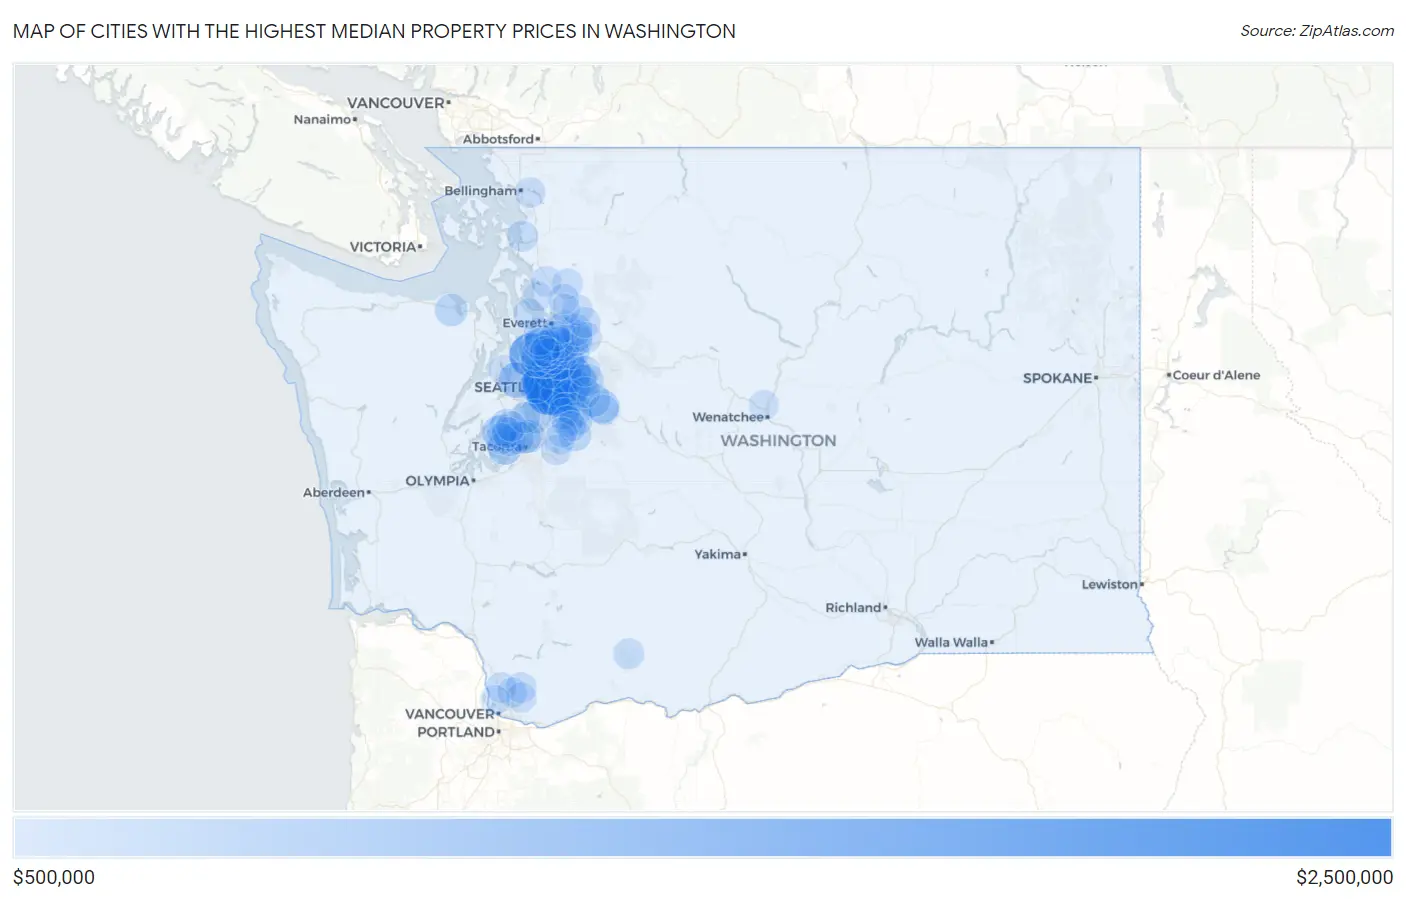
Map of Cities with the Highest Median Property Prices in Washington
$0
$2,500,000
Cities with the Highest Median Property Prices in Washington
| City | Avg Property Price | vs State | vs National | |
| 1. | Clyde Hill | $2,000,001 | $471,015(+1.53m)#1 | $281,181(+1.72m)#35 |
| 2. | Medina | $2,000,001 | $471,015(+1.53m)#2 | $281,181(+1.72m)#38 |
| 3. | Yarrow Point | $2,000,001 | $471,015(+1.53m)#3 | $281,181(+1.72m)#54 |
| 4. | Hunts Point | $2,000,001 | $471,015(+1.53m)#4 | $281,181(+1.72m)#69 |
| 5. | Beaux Arts Village | $1,927,447 | $471,015(+1.46m)#5 | $281,181(+1.65m)#90 |
| 6. | Mercer Island | $1,677,459 | $471,015(+1.21m)#6 | $281,181(+1.40m)#139 |
| 7. | Woodway | $1,578,925 | $471,015(+1.11m)#7 | $281,181(+1.30m)#173 |
| 8. | Sammamish | $1,139,220 | $471,015(+668k)#8 | $281,181(+858k)#362 |
| 9. | Bellevue | $1,138,042 | $471,015(+667k)#9 | $281,181(+857k)#366 |
| 10. | Union Hill Novelty Hill | $1,103,120 | $471,015(+632k)#10 | $281,181(+822k)#391 |
| 11. | Cottage Lake | $1,093,112 | $471,015(+622k)#11 | $281,181(+812k)#399 |
| 12. | Newcastle | $1,027,351 | $471,015(+556k)#12 | $281,181(+746k)#458 |
| 13. | Redmond | $1,026,917 | $471,015(+556k)#13 | $281,181(+746k)#461 |
| 14. | Ames Lake | $985,814 | $471,015(+515k)#14 | $281,181(+705k)#508 |
| 15. | Bainbridge Island | $978,221 | $471,015(+507k)#15 | $281,181(+697k)#517 |
| 16. | Riverpoint | $955,164 | $471,015(+484k)#16 | $281,181(+674k)#546 |
| 17. | Kirkland | $938,355 | $471,015(+467k)#17 | $281,181(+657k)#574 |
| 18. | Bothell East | $928,333 | $471,015(+457k)#18 | $281,181(+647k)#588 |
| 19. | Woodinville | $916,836 | $471,015(+446k)#19 | $281,181(+636k)#603 |
| 20. | Fox Island | $900,723 | $471,015(+430k)#20 | $281,181(+620k)#635 |
| 21. | Seattle | $879,805 | $471,015(+409k)#21 | $281,181(+599k)#668 |
| 22. | Mirrormont | $874,575 | $471,015(+404k)#22 | $281,181(+593k)#679 |
| 23. | Issaquah | $872,881 | $471,015(+402k)#23 | $281,181(+592k)#682 |
| 24. | Lake Forest Park | $869,289 | $471,015(+398k)#24 | $281,181(+588k)#693 |
| 25. | Normandy Park | $869,030 | $471,015(+398k)#25 | $281,181(+588k)#695 |
| 26. | Roche Harbor | $857,211 | $471,015(+386k)#26 | $281,181(+576k)#721 |
| 27. | Raft Island | $853,779 | $471,015(+383k)#27 | $281,181(+573k)#728 |
| 28. | North Bend | $852,484 | $471,015(+381k)#28 | $281,181(+571k)#731 |
| 29. | High Bridge | $849,015 | $471,015(+378k)#29 | $281,181(+568k)#737 |
| 30. | Snoqualmie | $844,152 | $471,015(+373k)#30 | $281,181(+563k)#749 |
| 31. | Dash Point | $827,680 | $471,015(+357k)#31 | $281,181(+546k)#793 |
| 32. | Hobart | $823,880 | $471,015(+353k)#32 | $281,181(+543k)#800 |
| 33. | Maltby | $801,343 | $471,015(+330k)#33 | $281,181(+520k)#852 |
| 34. | Kenmore | $797,059 | $471,015(+326k)#34 | $281,181(+516k)#862 |
| 35. | Bothell | $795,629 | $471,015(+325k)#35 | $281,181(+514k)#866 |
| 36. | Brier | $788,129 | $471,015(+317k)#36 | $281,181(+507k)#892 |
| 37. | Ruston | $783,822 | $471,015(+313k)#37 | $281,181(+503k)#900 |
| 38. | Clearview | $782,853 | $471,015(+312k)#38 | $281,181(+502k)#903 |
| 39. | Mill Creek | $776,209 | $471,015(+305k)#39 | $281,181(+495k)#920 |
| 40. | Bell Hill | $771,798 | $471,015(+301k)#40 | $281,181(+491k)#932 |
| 41. | Mill Creek East | $769,323 | $471,015(+298k)#41 | $281,181(+488k)#945 |
| 42. | Edmonds | $761,205 | $471,015(+290k)#42 | $281,181(+480k)#964 |
| 43. | Mukilteo | $761,191 | $471,015(+290k)#43 | $281,181(+480k)#965 |
| 44. | Monroe North | $759,968 | $471,015(+289k)#44 | $281,181(+479k)#967 |
| 45. | Cathcart | $759,541 | $471,015(+289k)#45 | $281,181(+478k)#968 |
| 46. | Black Diamond | $758,120 | $471,015(+287k)#46 | $281,181(+477k)#972 |
| 47. | Canterwood | $745,609 | $471,015(+275k)#47 | $281,181(+464k)#1,001 |
| 48. | Wollochet | $732,769 | $471,015(+262k)#48 | $281,181(+452k)#1,038 |
| 49. | Carnation | $729,378 | $471,015(+258k)#49 | $281,181(+448k)#1,046 |
| 50. | Chain Lake | $729,110 | $471,015(+258k)#50 | $281,181(+448k)#1,048 |
| 51. | Three Lakes | $726,485 | $471,015(+255k)#51 | $281,181(+445k)#1,059 |
| 52. | Browns Point | $716,711 | $471,015(+246k)#52 | $281,181(+436k)#1,094 |
| 53. | Bunk Foss | $715,600 | $471,015(+245k)#53 | $281,181(+434k)#1,097 |
| 54. | Rosedale | $714,000 | $471,015(+243k)#54 | $281,181(+433k)#1,104 |
| 55. | Silver Firs | $712,939 | $471,015(+242k)#55 | $281,181(+432k)#1,109 |
| 56. | Larch Way | $712,063 | $471,015(+241k)#56 | $281,181(+431k)#1,113 |
| 57. | Shoreline | $711,534 | $471,015(+241k)#57 | $281,181(+430k)#1,114 |
| 58. | East Renton Highlands | $703,335 | $471,015(+232k)#58 | $281,181(+422k)#1,148 |
| 59. | Maple Heights Lake Desire | $702,965 | $471,015(+232k)#59 | $281,181(+422k)#1,149 |
| 60. | Artondale | $702,369 | $471,015(+231k)#60 | $281,181(+421k)#1,151 |
| 61. | Shadow Lake | $698,910 | $471,015(+228k)#61 | $281,181(+418k)#1,166 |
| 62. | Esperance | $698,166 | $471,015(+227k)#62 | $281,181(+417k)#1,168 |
| 63. | Martha Lake | $676,210 | $471,015(+205k)#63 | $281,181(+395k)#1,256 |
| 64. | Vashon | $674,831 | $471,015(+204k)#64 | $281,181(+394k)#1,263 |
| 65. | Lake Holm | $672,659 | $471,015(+202k)#65 | $281,181(+391k)#1,271 |
| 66. | Fobes Hill | $671,986 | $471,015(+201k)#66 | $281,181(+391k)#1,277 |
| 67. | Meadowdale | $670,138 | $471,015(+199k)#67 | $281,181(+389k)#1,286 |
| 68. | Bay View | $668,912 | $471,015(+198k)#68 | $281,181(+388k)#1,294 |
| 69. | Bothell West | $664,056 | $471,015(+193k)#69 | $281,181(+383k)#1,314 |
| 70. | Fall City | $663,972 | $471,015(+193k)#70 | $281,181(+383k)#1,315 |
| 71. | Tehaleh | $661,654 | $471,015(+191k)#71 | $281,181(+380k)#1,331 |
| 72. | Trout Lake | $661,566 | $471,015(+191k)#72 | $281,181(+380k)#1,332 |
| 73. | Picnic Point | $659,625 | $471,015(+189k)#73 | $281,181(+378k)#1,345 |
| 74. | Langley | $656,278 | $471,015(+185k)#74 | $281,181(+375k)#1,360 |
| 75. | Lake Marcel Stillwater | $655,424 | $471,015(+184k)#75 | $281,181(+374k)#1,372 |
| 76. | Gig Harbor | $653,053 | $471,015(+182k)#76 | $281,181(+372k)#1,381 |
| 77. | Lake Bosworth | $652,791 | $471,015(+182k)#77 | $281,181(+372k)#1,382 |
| 78. | Woods Creek | $647,764 | $471,015(+177k)#78 | $281,181(+367k)#1,408 |
| 79. | Arlington Heights | $645,406 | $471,015(+174k)#79 | $281,181(+364k)#1,421 |
| 80. | Eastmont | $644,436 | $471,015(+173k)#80 | $281,181(+363k)#1,427 |
| 81. | Lake Roesiger | $644,301 | $471,015(+173k)#81 | $281,181(+363k)#1,429 |
| 82. | Venersborg | $642,086 | $471,015(+171k)#82 | $281,181(+361k)#1,440 |
| 83. | Duluth | $640,482 | $471,015(+169k)#83 | $281,181(+359k)#1,448 |
| 84. | Riverbend | $639,409 | $471,015(+168k)#84 | $281,181(+358k)#1,454 |
| 85. | Sunday Lake | $635,288 | $471,015(+164k)#85 | $281,181(+354k)#1,475 |
| 86. | Lake Tapps | $633,983 | $471,015(+163k)#86 | $281,181(+353k)#1,485 |
| 87. | Sisco Heights | $626,835 | $471,015(+156k)#87 | $281,181(+346k)#1,516 |
| 88. | Geneva | $625,306 | $471,015(+154k)#88 | $281,181(+344k)#1,528 |
| 89. | Maplewood | $625,181 | $471,015(+154k)#89 | $281,181(+344k)#1,529 |
| 90. | Lake Cassidy | $623,998 | $471,015(+153k)#90 | $281,181(+343k)#1,533 |
| 91. | Maple Valley | $622,706 | $471,015(+152k)#91 | $281,181(+342k)#1,542 |
| 92. | Alderwood Manor | $621,043 | $471,015(+150k)#92 | $281,181(+340k)#1,556 |
| 93. | Hockinson | $619,262 | $471,015(+148k)#93 | $281,181(+338k)#1,564 |
| 94. | Kayak Point | $615,303 | $471,015(+144k)#94 | $281,181(+334k)#1,589 |
| 95. | Fairwood Cdp King County | $615,102 | $471,015(+144k)#95 | $281,181(+334k)#1,594 |
| 96. | Sunnyslope | $613,003 | $471,015(+142k)#96 | $281,181(+332k)#1,609 |
| 97. | Meadow Glade | $606,882 | $471,015(+136k)#97 | $281,181(+326k)#1,654 |
| 98. | Keyport | $605,503 | $471,015(+134k)#98 | $281,181(+324k)#1,663 |
| 99. | Lake Morton Berrydale | $604,050 | $471,015(+133k)#99 | $281,181(+323k)#1,675 |
| 100. | Felida | $603,910 | $471,015(+133k)#100 | $281,181(+323k)#1,677 |
Common Questions
What are the Top 10 Cities with the Highest Median Property Prices in Washington?
Top 10 Cities with the Highest Median Property Prices in Washington are:
#1
$2,000,001
#2
$2,000,001
#3
$2,000,001
#4
$2,000,001
#5
$1,927,447
#6
$1,677,459
#7
$1,578,925
#8
$1,139,220
#9
$1,138,042
#10
$1,103,120
What city has the Highest Median Property Prices in Washington?
Clyde Hill has the Highest Median Property Prices in Washington with $2,000,001.
What is the Median Property Prices in the State of Washington?
Median Property Prices in Washington is $471,015.
What is the Median Property Prices in the United States?
Median Property Prices in the United States is $281,181.