Cities with the Highest Percentage of Households Heated by Utility Gas in Washington
RELATED REPORTS & OPTIONS
Utility Gas Heating
Washington
Compare Cities
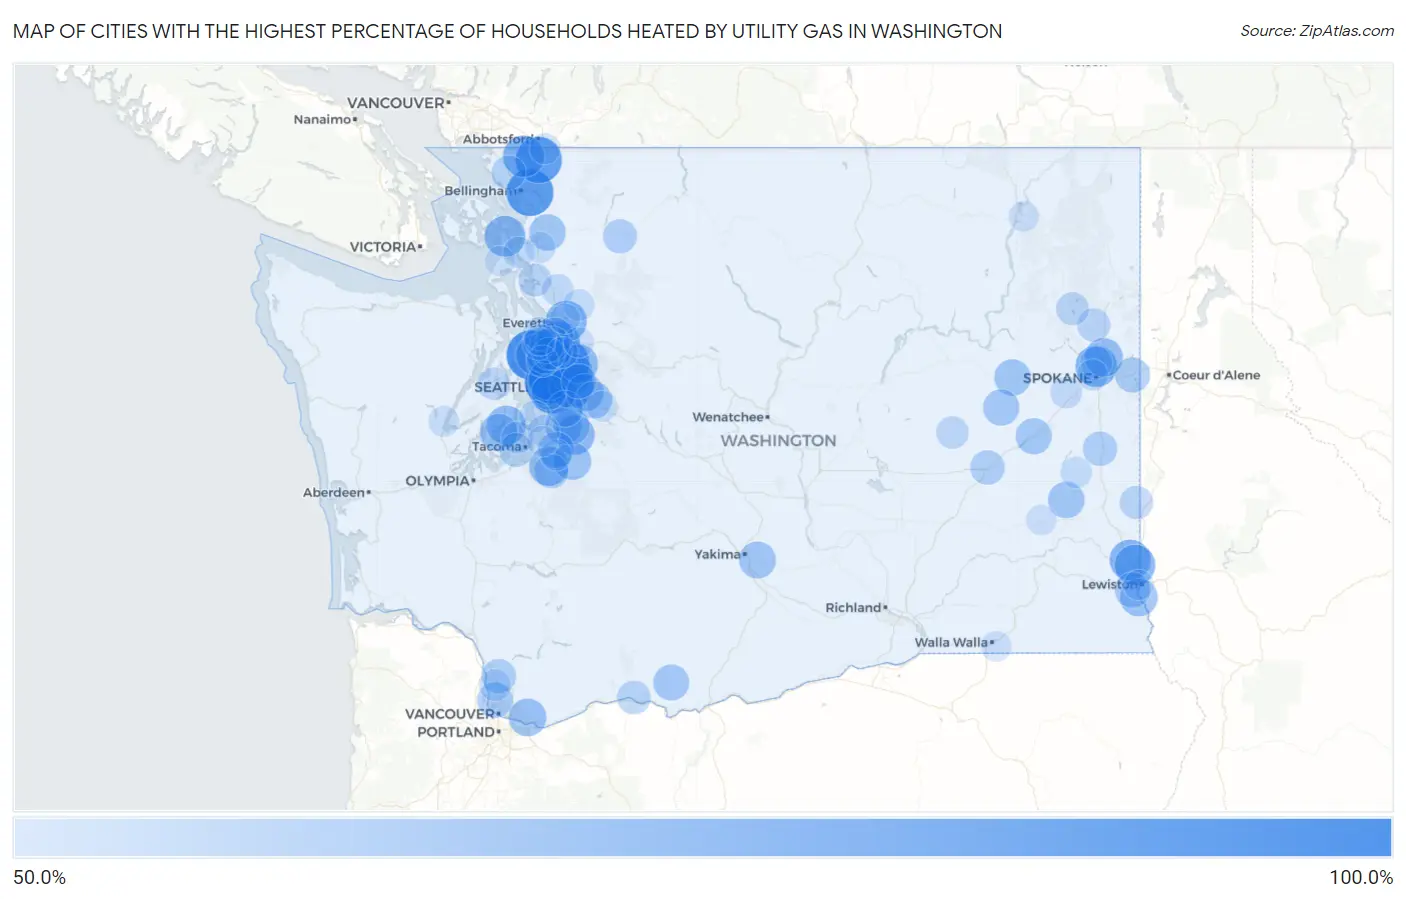
Map of Cities with the Highest Percentage of Households Heated by Utility Gas in Washington
0.0%
100.0%
Cities with the Highest Percentage of Households Heated by Utility Gas in Washington
| City | Utility Gas Heating | vs State | vs National | |
| 1. | Woodway | 85.8% | 33.9%(+51.9)#1 | 47.1%(+38.7)#2,441 |
| 2. | Yarrow Point | 82.2% | 33.9%(+48.3)#2 | 47.1%(+35.1)#3,688 |
| 3. | Geneva | 81.3% | 33.9%(+47.4)#3 | 47.1%(+34.2)#4,038 |
| 4. | Beaux Arts Village | 81.3% | 33.9%(+47.4)#4 | 47.1%(+34.2)#4,060 |
| 5. | Nooksack | 80.2% | 33.9%(+46.3)#5 | 47.1%(+33.1)#4,466 |
| 6. | Cottage Lake | 79.9% | 33.9%(+46.0)#6 | 47.1%(+32.8)#4,580 |
| 7. | Medina | 79.1% | 33.9%(+45.2)#7 | 47.1%(+32.0)#4,881 |
| 8. | Clyde Hill | 77.0% | 33.9%(+43.1)#8 | 47.1%(+29.9)#5,675 |
| 9. | Sammamish | 76.7% | 33.9%(+42.8)#9 | 47.1%(+29.6)#5,780 |
| 10. | Silver Firs | 73.6% | 33.9%(+39.7)#10 | 47.1%(+26.5)#7,008 |
| 11. | Lynden | 71.8% | 33.9%(+37.9)#11 | 47.1%(+24.7)#7,670 |
| 12. | Town And Country | 71.7% | 33.9%(+37.8)#12 | 47.1%(+24.6)#7,701 |
| 13. | Union Hill Novelty Hill | 71.0% | 33.9%(+37.1)#13 | 47.1%(+23.9)#7,942 |
| 14. | Cavalero | 70.8% | 33.9%(+36.9)#14 | 47.1%(+23.7)#8,014 |
| 15. | Anacortes | 70.4% | 33.9%(+36.5)#15 | 47.1%(+23.3)#8,132 |
| 16. | Esperance | 70.4% | 33.9%(+36.5)#16 | 47.1%(+23.3)#8,144 |
| 17. | Colton | 70.2% | 33.9%(+36.3)#17 | 47.1%(+23.1)#8,238 |
| 18. | Uniontown | 70.1% | 33.9%(+36.2)#18 | 47.1%(+23.0)#8,266 |
| 19. | Hunts Point | 69.9% | 33.9%(+36.0)#19 | 47.1%(+22.8)#8,334 |
| 20. | Black Diamond | 68.0% | 33.9%(+34.1)#20 | 47.1%(+20.9)#8,903 |
| 21. | Mcmillin | 67.8% | 33.9%(+33.9)#21 | 47.1%(+20.7)#8,981 |
| 22. | Canterwood | 67.2% | 33.9%(+33.3)#22 | 47.1%(+20.1)#9,166 |
| 23. | Duvall | 66.6% | 33.9%(+32.7)#23 | 47.1%(+19.5)#9,376 |
| 24. | Mead | 66.2% | 33.9%(+32.3)#24 | 47.1%(+19.1)#9,482 |
| 25. | Mill Creek East | 65.8% | 33.9%(+31.9)#25 | 47.1%(+18.7)#9,617 |
| 26. | Asotin | 65.3% | 33.9%(+31.4)#26 | 47.1%(+18.2)#9,776 |
| 27. | Camas | 65.1% | 33.9%(+31.2)#27 | 47.1%(+18.0)#9,815 |
| 28. | Raft Island | 64.8% | 33.9%(+30.9)#28 | 47.1%(+17.7)#9,919 |
| 29. | Buckley | 64.6% | 33.9%(+30.7)#29 | 47.1%(+17.5)#9,961 |
| 30. | Fall City | 64.6% | 33.9%(+30.7)#30 | 47.1%(+17.5)#9,970 |
| 31. | Brier | 64.3% | 33.9%(+30.4)#31 | 47.1%(+17.2)#10,038 |
| 32. | Eastmont | 63.8% | 33.9%(+29.9)#32 | 47.1%(+16.7)#10,183 |
| 33. | Moxee | 63.7% | 33.9%(+29.8)#33 | 47.1%(+16.6)#10,222 |
| 34. | Snoqualmie | 63.6% | 33.9%(+29.7)#34 | 47.1%(+16.5)#10,243 |
| 35. | Covington | 63.4% | 33.9%(+29.5)#35 | 47.1%(+16.3)#10,301 |
| 36. | Fairwood Cdp Spokane County | 63.4% | 33.9%(+29.5)#36 | 47.1%(+16.3)#10,304 |
| 37. | Maple Valley | 63.2% | 33.9%(+29.3)#37 | 47.1%(+16.1)#10,377 |
| 38. | Sedro Woolley | 63.0% | 33.9%(+29.1)#38 | 47.1%(+15.9)#10,429 |
| 39. | Endicott | 63.0% | 33.9%(+29.1)#39 | 47.1%(+15.9)#10,445 |
| 40. | Davenport | 62.8% | 33.9%(+28.9)#40 | 47.1%(+15.7)#10,481 |
| 41. | East Renton Highlands | 62.7% | 33.9%(+28.8)#41 | 47.1%(+15.6)#10,498 |
| 42. | Harrington | 62.6% | 33.9%(+28.7)#42 | 47.1%(+15.5)#10,555 |
| 43. | Sprague | 62.4% | 33.9%(+28.5)#43 | 47.1%(+15.3)#10,610 |
| 44. | Lake Tapps | 62.1% | 33.9%(+28.2)#44 | 47.1%(+15.0)#10,670 |
| 45. | Klickitat | 62.1% | 33.9%(+28.2)#45 | 47.1%(+15.0)#10,690 |
| 46. | Felida | 61.4% | 33.9%(+27.5)#46 | 47.1%(+14.3)#10,832 |
| 47. | Clarkston Heights Vineland | 61.3% | 33.9%(+27.4)#47 | 47.1%(+14.2)#10,862 |
| 48. | Tehaleh | 61.1% | 33.9%(+27.2)#48 | 47.1%(+14.0)#10,902 |
| 49. | Bothell East | 60.7% | 33.9%(+26.8)#49 | 47.1%(+13.6)#10,992 |
| 50. | Liberty Lake | 60.5% | 33.9%(+26.6)#50 | 47.1%(+13.4)#11,037 |
| 51. | Mill Creek | 60.1% | 33.9%(+26.2)#51 | 47.1%(+13.0)#11,121 |
| 52. | Mercer Island | 60.0% | 33.9%(+26.1)#52 | 47.1%(+12.9)#11,150 |
| 53. | Ames Lake | 60.0% | 33.9%(+26.1)#53 | 47.1%(+12.9)#11,162 |
| 54. | Riverpoint | 59.7% | 33.9%(+25.8)#54 | 47.1%(+12.6)#11,256 |
| 55. | Ritzville | 59.6% | 33.9%(+25.7)#55 | 47.1%(+12.5)#11,273 |
| 56. | La Center | 59.5% | 33.9%(+25.6)#56 | 47.1%(+12.4)#11,293 |
| 57. | Orting | 59.4% | 33.9%(+25.5)#57 | 47.1%(+12.3)#11,318 |
| 58. | Rosalia | 59.4% | 33.9%(+25.5)#58 | 47.1%(+12.3)#11,328 |
| 59. | Larch Way | 59.0% | 33.9%(+25.1)#59 | 47.1%(+11.9)#11,421 |
| 60. | Fairwood Cdp King County | 58.9% | 33.9%(+25.0)#60 | 47.1%(+11.8)#11,438 |
| 61. | Rockport | 58.8% | 33.9%(+24.9)#61 | 47.1%(+11.7)#11,494 |
| 62. | Ferndale | 58.7% | 33.9%(+24.8)#62 | 47.1%(+11.6)#11,497 |
| 63. | Fircrest | 58.6% | 33.9%(+24.7)#63 | 47.1%(+11.5)#11,528 |
| 64. | White Salmon | 58.0% | 33.9%(+24.1)#64 | 47.1%(+10.9)#11,708 |
| 65. | Mukilteo | 57.8% | 33.9%(+23.9)#65 | 47.1%(+10.7)#11,758 |
| 66. | Palouse | 57.5% | 33.9%(+23.6)#66 | 47.1%(+10.4)#11,839 |
| 67. | Deer Park | 57.4% | 33.9%(+23.5)#67 | 47.1%(+10.3)#11,862 |
| 68. | Stanwood | 57.1% | 33.9%(+23.2)#68 | 47.1%(+10.0)#11,923 |
| 69. | Loon Lake | 57.0% | 33.9%(+23.1)#69 | 47.1%(+9.90)#11,952 |
| 70. | Odessa | 56.3% | 33.9%(+22.4)#70 | 47.1%(+9.20)#12,124 |
| 71. | Chico | 56.1% | 33.9%(+22.2)#71 | 47.1%(+9.00)#12,160 |
| 72. | Bothell West | 55.8% | 33.9%(+21.9)#72 | 47.1%(+8.70)#12,229 |
| 73. | Meadowdale | 55.8% | 33.9%(+21.9)#73 | 47.1%(+8.70)#12,234 |
| 74. | Ruston | 55.4% | 33.9%(+21.5)#74 | 47.1%(+8.30)#12,340 |
| 75. | Country Homes | 55.3% | 33.9%(+21.4)#75 | 47.1%(+8.20)#12,355 |
| 76. | Lakeland North | 55.1% | 33.9%(+21.2)#76 | 47.1%(+8.00)#12,402 |
| 77. | Medical Lake | 55.0% | 33.9%(+21.1)#77 | 47.1%(+7.90)#12,430 |
| 78. | Arlington | 54.9% | 33.9%(+21.0)#78 | 47.1%(+7.80)#12,452 |
| 79. | Ridgefield | 54.7% | 33.9%(+20.8)#79 | 47.1%(+7.60)#12,501 |
| 80. | Normandy Park | 54.7% | 33.9%(+20.8)#80 | 47.1%(+7.60)#12,502 |
| 81. | Lake Forest Park | 54.6% | 33.9%(+20.7)#81 | 47.1%(+7.50)#12,527 |
| 82. | Picnic Point | 54.5% | 33.9%(+20.6)#82 | 47.1%(+7.40)#12,549 |
| 83. | Granite Falls | 54.4% | 33.9%(+20.5)#83 | 47.1%(+7.30)#12,585 |
| 84. | La Conner | 54.4% | 33.9%(+20.5)#84 | 47.1%(+7.30)#12,596 |
| 85. | St John | 54.3% | 33.9%(+20.4)#85 | 47.1%(+7.20)#12,628 |
| 86. | Spokane | 53.8% | 33.9%(+19.9)#86 | 47.1%(+6.70)#12,710 |
| 87. | Bonney Lake | 53.7% | 33.9%(+19.8)#87 | 47.1%(+6.60)#12,737 |
| 88. | Mount Vernon | 53.5% | 33.9%(+19.6)#88 | 47.1%(+6.40)#12,788 |
| 89. | Maltby | 53.5% | 33.9%(+19.6)#89 | 47.1%(+6.40)#12,790 |
| 90. | North Bend | 53.5% | 33.9%(+19.6)#90 | 47.1%(+6.40)#12,792 |
| 91. | Sumas | 53.5% | 33.9%(+19.6)#91 | 47.1%(+6.40)#12,800 |
| 92. | Lakeland South | 53.2% | 33.9%(+19.3)#92 | 47.1%(+6.10)#12,852 |
| 93. | Hoodsport | 53.2% | 33.9%(+19.3)#93 | 47.1%(+6.10)#12,868 |
| 94. | Walla Walla East | 53.1% | 33.9%(+19.2)#94 | 47.1%(+6.00)#12,880 |
| 95. | Lacrosse | 52.9% | 33.9%(+19.0)#95 | 47.1%(+5.80)#12,925 |
| 96. | Monroe | 52.7% | 33.9%(+18.8)#96 | 47.1%(+5.60)#12,960 |
| 97. | Kettle Falls | 52.7% | 33.9%(+18.8)#97 | 47.1%(+5.60)#12,972 |
| 98. | Clarkston | 52.4% | 33.9%(+18.5)#98 | 47.1%(+5.30)#13,038 |
| 99. | Whidbey Island Station | 52.4% | 33.9%(+18.5)#99 | 47.1%(+5.30)#13,043 |
| 100. | Lake Stevens | 52.3% | 33.9%(+18.4)#100 | 47.1%(+5.20)#13,060 |
Common Questions
What are the Top 10 Cities with the Highest Percentage of Households Heated by Utility Gas in Washington?
Top 10 Cities with the Highest Percentage of Households Heated by Utility Gas in Washington are:
#1
85.8%
#2
82.2%
#3
81.3%
#4
81.3%
#5
80.2%
#6
79.9%
#7
79.1%
#8
77.0%
#9
76.7%
#10
73.6%
What city has the Highest Percentage of Households Heated by Utility Gas in Washington?
Woodway has the Highest Percentage of Households Heated by Utility Gas in Washington with 85.8%.
What is the Percentage of Households Heated by Utility Gas in the State of Washington?
Percentage of Households Heated by Utility Gas in Washington is 33.9%.
What is the Percentage of Households Heated by Utility Gas in the United States?
Percentage of Households Heated by Utility Gas in the United States is 47.1%.