Deming, WA Map & Demographics
Deming Map
Deming Overview
$28,552
PER CAPITA INCOME
$81,194
AVG HOUSEHOLD INCOME
0.17
INEQUALITY / GINI INDEX
427
TOTAL POPULATION
281
MALE POPULATION
146
FEMALE POPULATION
192.47
MALES / 100 FEMALES
51.96
FEMALES / 100 MALES
23.9
MEDIAN AGE
3.9
AVG FAMILY SIZE
2.8
AVG HOUSEHOLD SIZE
181
LABOR FORCE [ PEOPLE ]
57.5%
PERCENT IN LABOR FORCE
29.3%
UNEMPLOYMENT RATE
Deming Zip Codes
Deming Area Codes
Income in Deming
Income Overview in Deming
| Characteristic | Number | Measure |
| Per Capita Income | 427 | $28,552 |
| Median Family Income | 54 | $0 |
| Mean Family Income | 54 | $0 |
| Median Household Income | 155 | $81,194 |
| Mean Household Income | 155 | $85,058 |
| Income Deficit | 54 | $0 |
| Wage / Income Gap (%) | 427 | 0.00% |
| Wage / Income Gap ($) | 427 | 100.00¢ per $1 |
| Gini / Inequality Index | 427 | 0.17 |
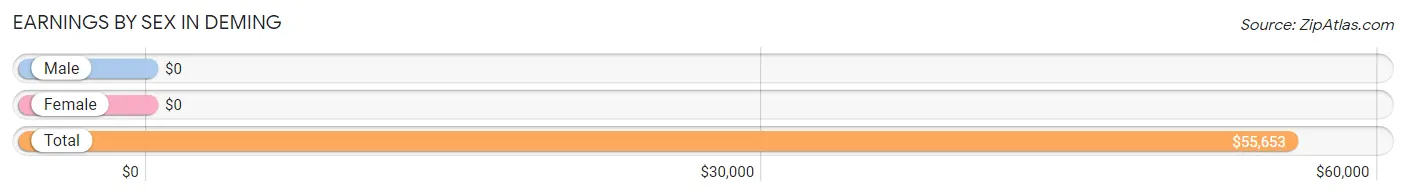
Earnings by Sex in Deming
| Sex | Number | Average Earnings |
| Male | 136 (75.1%) | $0 |
| Female | 45 (24.9%) | $0 |
| Total | 181 (100.0%) | $55,653 |
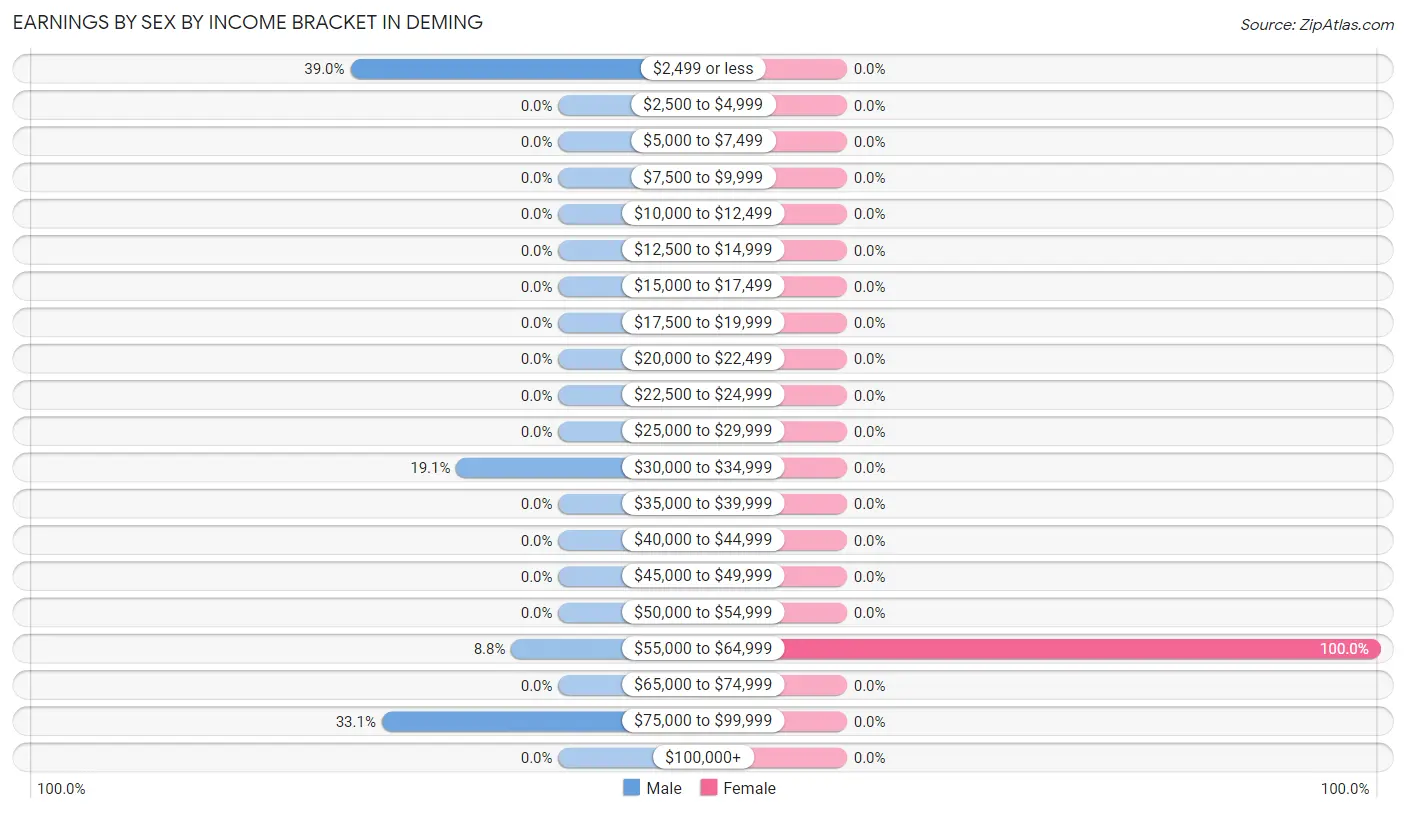
Earnings by Sex by Income Bracket in Deming
The most common earnings brackets in Deming are $2,499 or less for men (53 | 39.0%) and $55,000 to $64,999 for women (45 | 100.0%).
| Income | Male | Female |
| $2,499 or less | 53 (39.0%) | 0 (0.0%) |
| $2,500 to $4,999 | 0 (0.0%) | 0 (0.0%) |
| $5,000 to $7,499 | 0 (0.0%) | 0 (0.0%) |
| $7,500 to $9,999 | 0 (0.0%) | 0 (0.0%) |
| $10,000 to $12,499 | 0 (0.0%) | 0 (0.0%) |
| $12,500 to $14,999 | 0 (0.0%) | 0 (0.0%) |
| $15,000 to $17,499 | 0 (0.0%) | 0 (0.0%) |
| $17,500 to $19,999 | 0 (0.0%) | 0 (0.0%) |
| $20,000 to $22,499 | 0 (0.0%) | 0 (0.0%) |
| $22,500 to $24,999 | 0 (0.0%) | 0 (0.0%) |
| $25,000 to $29,999 | 0 (0.0%) | 0 (0.0%) |
| $30,000 to $34,999 | 26 (19.1%) | 0 (0.0%) |
| $35,000 to $39,999 | 0 (0.0%) | 0 (0.0%) |
| $40,000 to $44,999 | 0 (0.0%) | 0 (0.0%) |
| $45,000 to $49,999 | 0 (0.0%) | 0 (0.0%) |
| $50,000 to $54,999 | 0 (0.0%) | 0 (0.0%) |
| $55,000 to $64,999 | 12 (8.8%) | 45 (100.0%) |
| $65,000 to $74,999 | 0 (0.0%) | 0 (0.0%) |
| $75,000 to $99,999 | 45 (33.1%) | 0 (0.0%) |
| $100,000+ | 0 (0.0%) | 0 (0.0%) |
| Total | 136 (100.0%) | 45 (100.0%) |
Earnings by Sex by Educational Attainment in Deming
| Educational Attainment | Male Income | Female Income |
| Less than High School | - | - |
| High School Diploma | - | - |
| College or Associate's Degree | - | - |
| Bachelor's Degree | - | - |
| Graduate Degree | - | - |
| Total | - | - |
Family Income in Deming
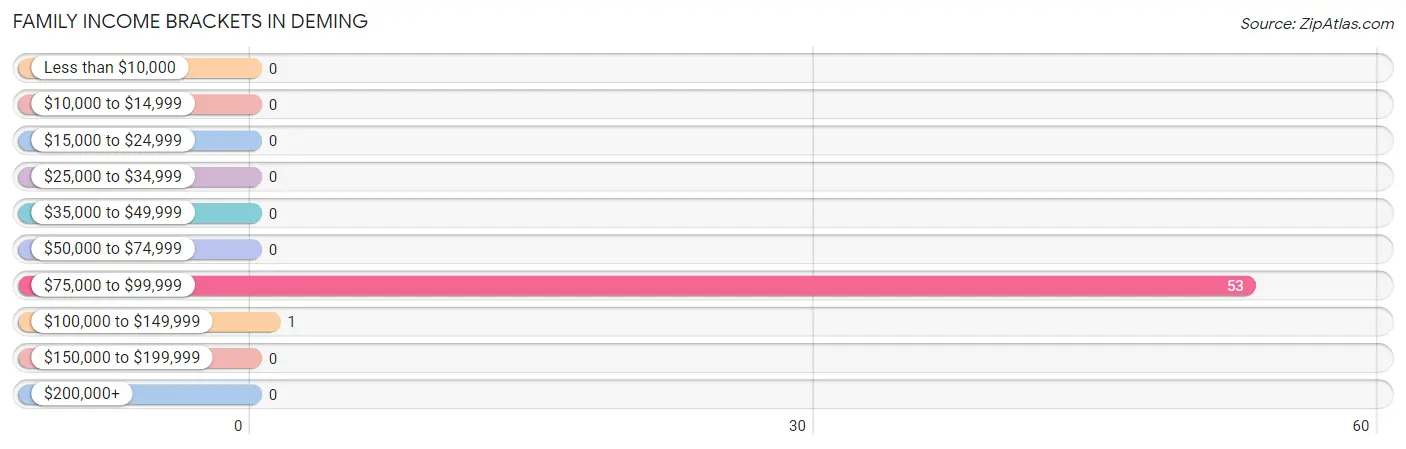
Family Income Brackets in Deming
According to the Deming family income data, there are 53 families falling into the $75,000 to $99,999 income range, which is the most common income bracket and makes up 98.2% of all families.
| Income Bracket | # Families | % Families |
| Less than $10,000 | 0 | 0.0% |
| $10,000 to $14,999 | 0 | 0.0% |
| $15,000 to $24,999 | 0 | 0.0% |
| $25,000 to $34,999 | 0 | 0.0% |
| $35,000 to $49,999 | 0 | 0.0% |
| $50,000 to $74,999 | 0 | 0.0% |
| $75,000 to $99,999 | 53 | 98.1% |
| $100,000 to $149,999 | 1 | 1.9% |
| $150,000 to $199,999 | 0 | 0.0% |
| $200,000+ | 0 | 0.0% |
Family Income by Famaliy Size in Deming
| Income Bracket | # Families | Median Income |
| 2-Person Families | 1 (1.8%) | $0 |
| 3-Person Families | 0 (0.0%) | $0 |
| 4-Person Families | 53 (98.2%) | $0 |
| 5-Person Families | 0 (0.0%) | $0 |
| 6-Person Families | 0 (0.0%) | $0 |
| 7+ Person Families | 0 (0.0%) | $0 |
| Total | 54 (100.0%) | $0 |
Family Income by Number of Earners in Deming
| Number of Earners | # Families | Median Income |
| No Earners | 0 (0.0%) | $0 |
| 1 Earner | 54 (100.0%) | $0 |
| 2 Earners | 0 (0.0%) | $0 |
| 3+ Earners | 0 (0.0%) | $0 |
| Total | 54 (100.0%) | $0 |
Household Income in Deming
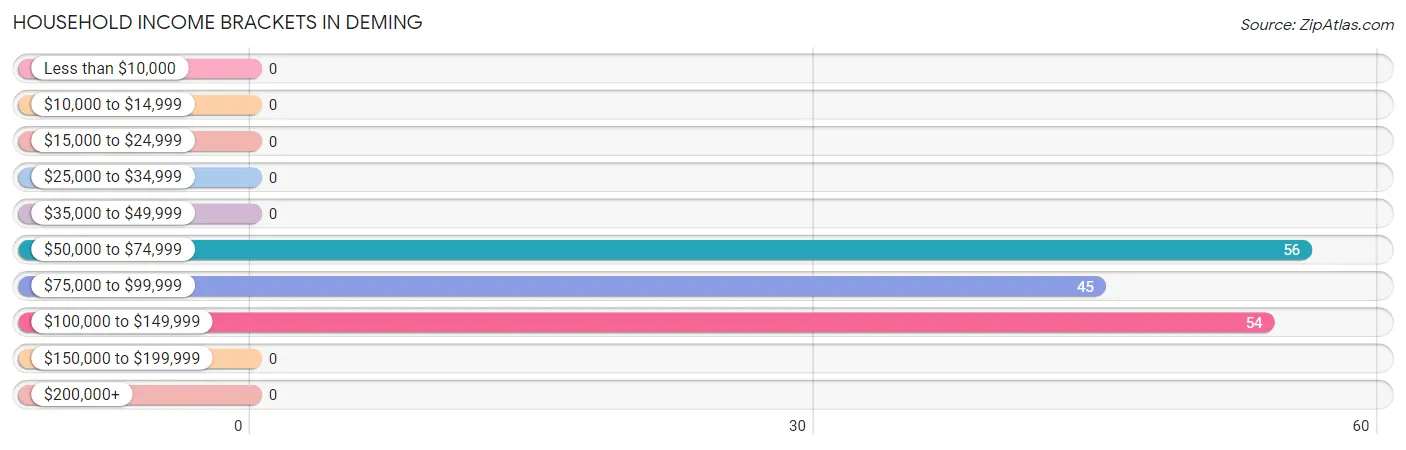
Household Income Brackets in Deming
With 56 households falling in the category, the $50,000 to $74,999 income range is the most frequent in Deming, accounting for 36.1% of all households.
| Income Bracket | # Households | % Households |
| Less than $10,000 | 0 | 0.0% |
| $10,000 to $14,999 | 0 | 0.0% |
| $15,000 to $24,999 | 0 | 0.0% |
| $25,000 to $34,999 | 0 | 0.0% |
| $35,000 to $49,999 | 0 | 0.0% |
| $50,000 to $74,999 | 56 | 36.1% |
| $75,000 to $99,999 | 45 | 29.0% |
| $100,000 to $149,999 | 54 | 34.8% |
| $150,000 to $199,999 | 0 | 0.0% |
| $200,000+ | 0 | 0.0% |
Household Income by Householder Age in Deming
| Income Bracket | # Households | Median Income |
| 15 to 24 Years | 0 (0.0%) | $0 |
| 25 to 44 Years | 45 (29.0%) | $0 |
| 45 to 64 Years | 110 (71.0%) | $0 |
| 65+ Years | 0 (0.0%) | $0 |
| Total | 155 (100.0%) | $81,194 |
Poverty in Deming
Income Below Poverty by Sex and Age in Deming
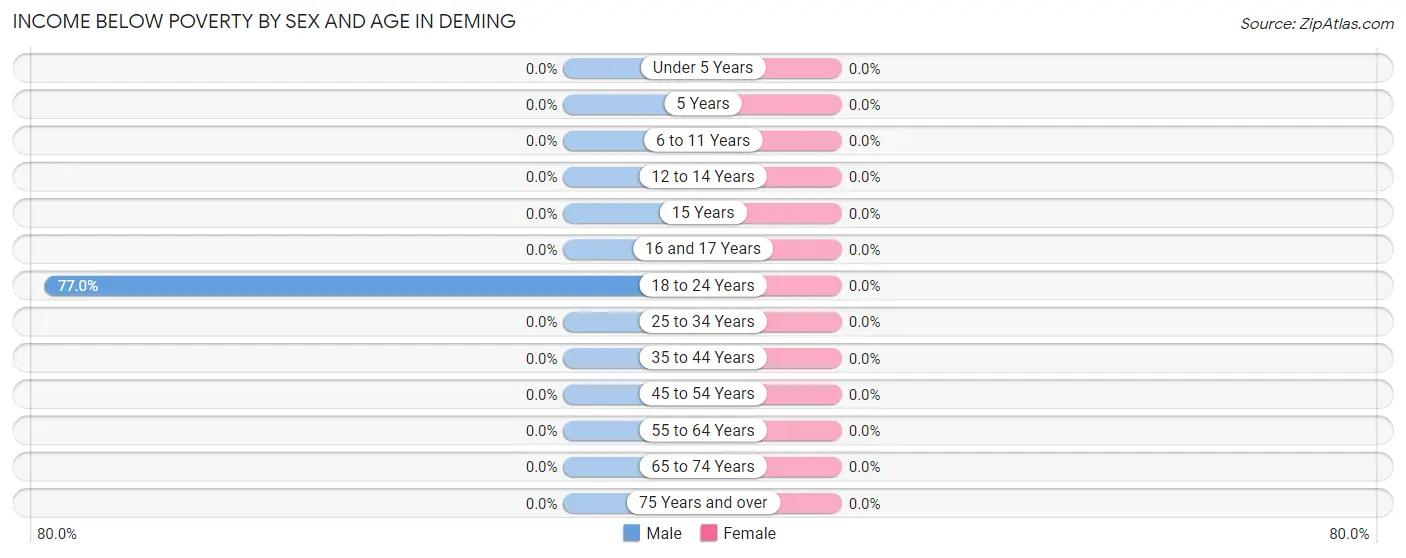
| Age Bracket | Male | Female |
| Under 5 Years | 0 (0.0%) | 0 (0.0%) |
| 5 Years | 0 (0.0%) | 0 (0.0%) |
| 6 to 11 Years | 0 (0.0%) | 0 (0.0%) |
| 12 to 14 Years | 0 (0.0%) | 0 (0.0%) |
| 15 Years | 0 (0.0%) | 0 (0.0%) |
| 16 and 17 Years | 0 (0.0%) | 0 (0.0%) |
| 18 to 24 Years | 87 (77.0%) | 0 (0.0%) |
| 25 to 34 Years | 0 (0.0%) | 0 (0.0%) |
| 35 to 44 Years | 0 (0.0%) | 0 (0.0%) |
| 45 to 54 Years | 0 (0.0%) | 0 (0.0%) |
| 55 to 64 Years | 0 (0.0%) | 0 (0.0%) |
| 65 to 74 Years | 0 (0.0%) | 0 (0.0%) |
| 75 Years and over | 0 (0.0%) | 0 (0.0%) |
| Total | 87 (31.0%) | 0 (0.0%) |
Income Above Poverty by Sex and Age in Deming
According to the poverty statistics in Deming, males aged 12 to 14 years and females aged 12 to 14 years are the age groups that are most secure financially, with 100.0% of males and 100.0% of females in these age groups living above the poverty line.
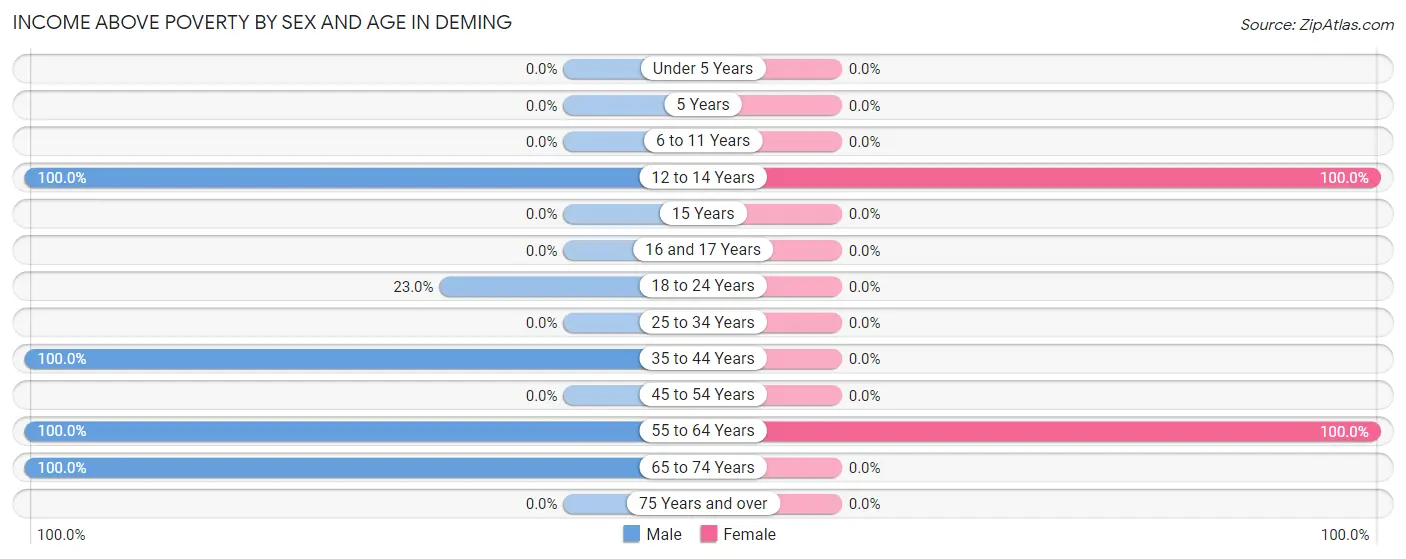
| Age Bracket | Male | Female |
| Under 5 Years | 0 (0.0%) | 0 (0.0%) |
| 5 Years | 0 (0.0%) | 0 (0.0%) |
| 6 to 11 Years | 0 (0.0%) | 0 (0.0%) |
| 12 to 14 Years | 57 (100.0%) | 55 (100.0%) |
| 15 Years | 0 (0.0%) | 0 (0.0%) |
| 16 and 17 Years | 0 (0.0%) | 0 (0.0%) |
| 18 to 24 Years | 26 (23.0%) | 0 (0.0%) |
| 25 to 34 Years | 0 (0.0%) | 0 (0.0%) |
| 35 to 44 Years | 45 (100.0%) | 0 (0.0%) |
| 45 to 54 Years | 0 (0.0%) | 0 (0.0%) |
| 55 to 64 Years | 65 (100.0%) | 91 (100.0%) |
| 65 to 74 Years | 1 (100.0%) | 0 (0.0%) |
| 75 Years and over | 0 (0.0%) | 0 (0.0%) |
| Total | 194 (69.0%) | 146 (100.0%) |
Income Below Poverty Among Married-Couple Families in Deming
| Children | Above Poverty | Below Poverty |
| No Children | 1 (100.0%) | 0 (0.0%) |
| 1 or 2 Children | 53 (100.0%) | 0 (0.0%) |
| 3 or 4 Children | 0 (0.0%) | 0 (0.0%) |
| 5 or more Children | 0 (0.0%) | 0 (0.0%) |
| Total | 54 (100.0%) | 0 (0.0%) |
Income Below Poverty Among Single-Parent Households in Deming
| Children | Single Father | Single Mother |
| No Children | 0 (0.0%) | 0 (0.0%) |
| 1 or 2 Children | 0 (0.0%) | 0 (0.0%) |
| 3 or 4 Children | 0 (0.0%) | 0 (0.0%) |
| 5 or more Children | 0 (0.0%) | 0 (0.0%) |
| Total | 0 (0.0%) | 0 (0.0%) |
Income Below Poverty Among Married-Couple vs Single-Parent Households in Deming
| Children | Married-Couple Families | Single-Parent Households |
| No Children | 0 (0.0%) | 0 (0.0%) |
| 1 or 2 Children | 0 (0.0%) | 0 (0.0%) |
| 3 or 4 Children | 0 (0.0%) | 0 (0.0%) |
| 5 or more Children | 0 (0.0%) | 0 (0.0%) |
| Total | 0 (0.0%) | 0 (0.0%) |
Race in Deming
The most populous races in Deming are White / Caucasian (312 | 73.1%), Asian (113 | 26.5%), and Hispanic or Latino (1 | 0.2%).
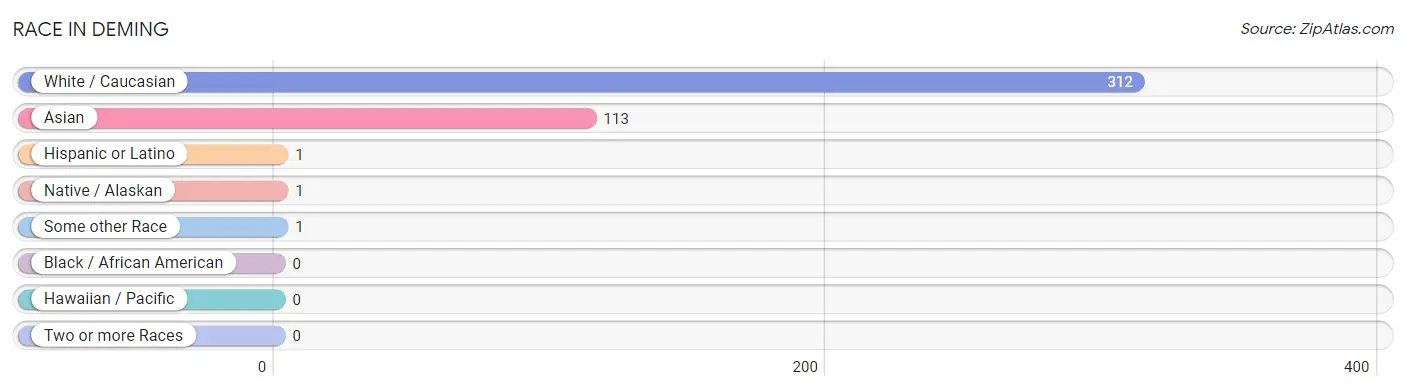
| Race | # Population | % Population |
| Asian | 113 | 26.5% |
| Black / African American | 0 | 0.0% |
| Hawaiian / Pacific | 0 | 0.0% |
| Hispanic or Latino | 1 | 0.2% |
| Native / Alaskan | 1 | 0.2% |
| White / Caucasian | 312 | 73.1% |
| Two or more Races | 0 | 0.0% |
| Some other Race | 1 | 0.2% |
| Total | 427 | 100.0% |
Ancestry in Deming
The most populous ancestries reported in Deming are English (165 | 38.6%), Sri Lankan (113 | 26.5%), Norwegian (65 | 15.2%), German (45 | 10.5%), and Swedish (45 | 10.5%), together accounting for 101.4% of all Deming residents.
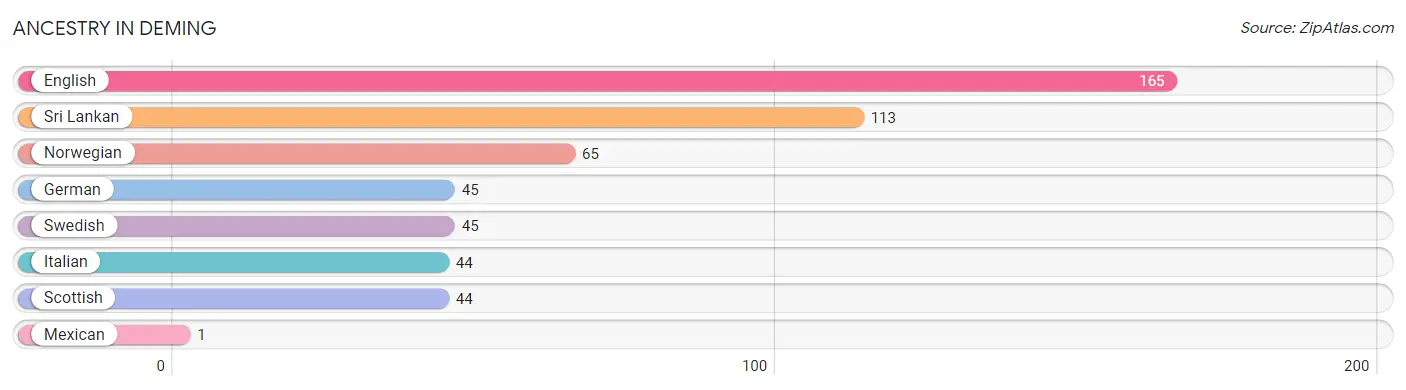
| Ancestry | # Population | % Population |
| English | 165 | 38.6% |
| German | 45 | 10.5% |
| Italian | 44 | 10.3% |
| Mexican | 1 | 0.2% |
| Norwegian | 65 | 15.2% |
| Scottish | 44 | 10.3% |
| Sri Lankan | 113 | 26.5% |
| Swedish | 45 | 10.5% | View All 8 Rows |
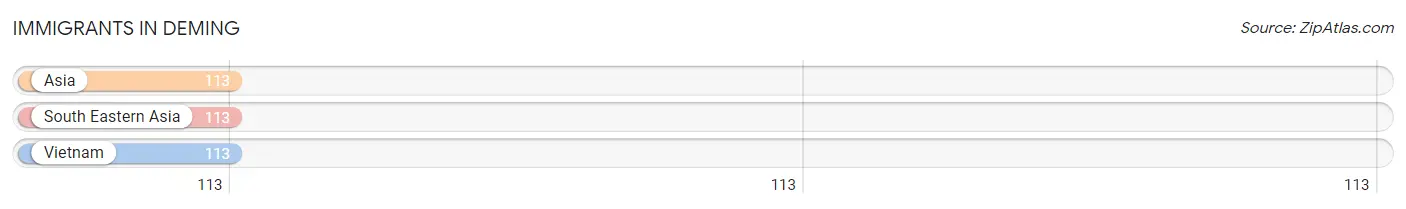
Immigrants in Deming
The most numerous immigrant groups reported in Deming came from Asia (113 | 26.5%), South Eastern Asia (113 | 26.5%), and Vietnam (113 | 26.5%), together accounting for 79.4% of all Deming residents.
| Immigration Origin | # Population | % Population |
| Asia | 113 | 26.5% |
| South Eastern Asia | 113 | 26.5% |
| Vietnam | 113 | 26.5% | View All 3 Rows |
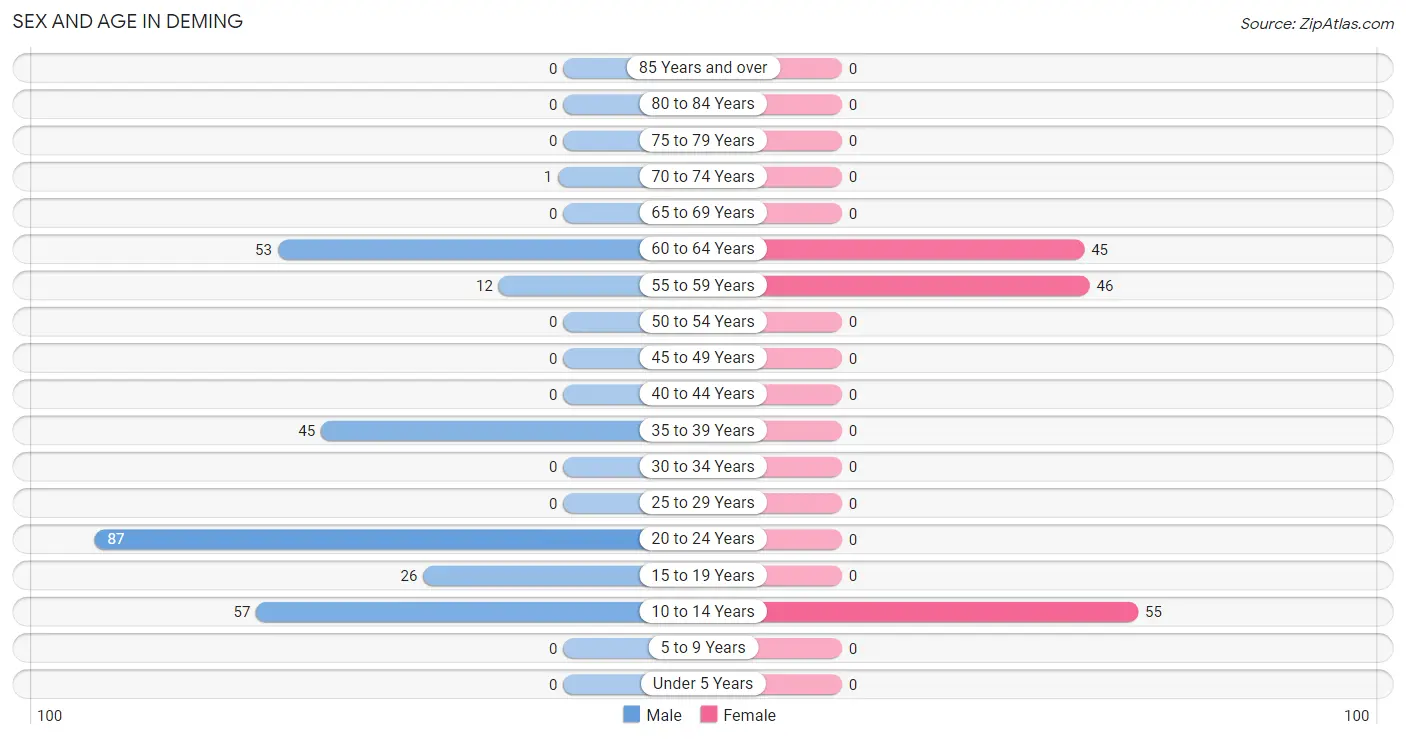
Sex and Age in Deming
Sex and Age in Deming
The most populous age groups in Deming are 20 to 24 Years (87 | 31.0%) for men and 10 to 14 Years (55 | 37.7%) for women.
| Age Bracket | Male | Female |
| Under 5 Years | 0 (0.0%) | 0 (0.0%) |
| 5 to 9 Years | 0 (0.0%) | 0 (0.0%) |
| 10 to 14 Years | 57 (20.3%) | 55 (37.7%) |
| 15 to 19 Years | 26 (9.2%) | 0 (0.0%) |
| 20 to 24 Years | 87 (31.0%) | 0 (0.0%) |
| 25 to 29 Years | 0 (0.0%) | 0 (0.0%) |
| 30 to 34 Years | 0 (0.0%) | 0 (0.0%) |
| 35 to 39 Years | 45 (16.0%) | 0 (0.0%) |
| 40 to 44 Years | 0 (0.0%) | 0 (0.0%) |
| 45 to 49 Years | 0 (0.0%) | 0 (0.0%) |
| 50 to 54 Years | 0 (0.0%) | 0 (0.0%) |
| 55 to 59 Years | 12 (4.3%) | 46 (31.5%) |
| 60 to 64 Years | 53 (18.9%) | 45 (30.8%) |
| 65 to 69 Years | 0 (0.0%) | 0 (0.0%) |
| 70 to 74 Years | 1 (0.4%) | 0 (0.0%) |
| 75 to 79 Years | 0 (0.0%) | 0 (0.0%) |
| 80 to 84 Years | 0 (0.0%) | 0 (0.0%) |
| 85 Years and over | 0 (0.0%) | 0 (0.0%) |
| Total | 281 (100.0%) | 146 (100.0%) |
Families and Households in Deming
Median Family Size in Deming
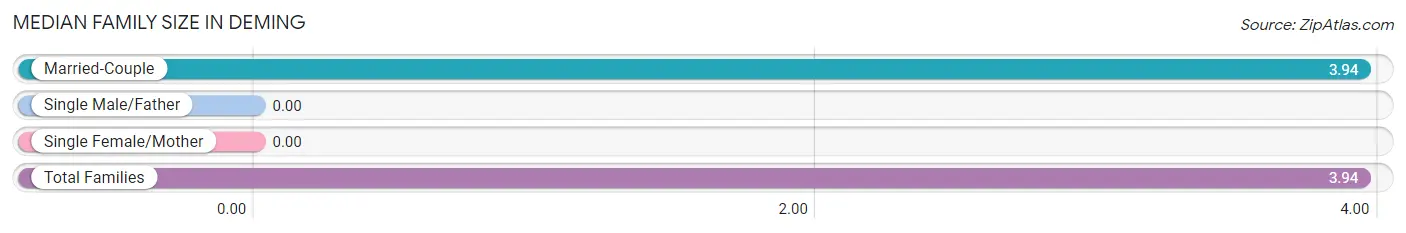
| Family Type | # Families | Family Size |
| Married-Couple | 54 (100.0%) | 3.94 |
| Single Male/Father | 0 (0.0%) | - |
| Single Female/Mother | 0 (0.0%) | - |
| Total Families | 54 (100.0%) | 3.94 |
Median Household Size in Deming
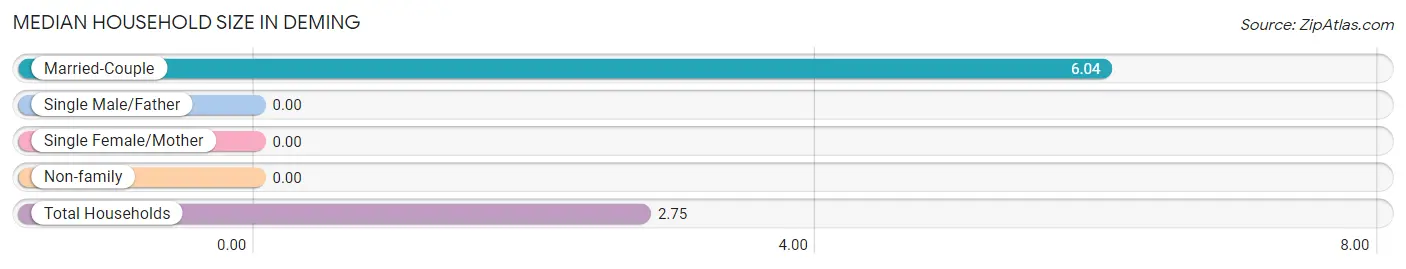
| Household Type | # Households | Household Size |
| Married-Couple | 54 (34.8%) | 6.04 |
| Single Male/Father | 0 (0.0%) | - |
| Single Female/Mother | 0 (0.0%) | - |
| Non-family | 101 (65.2%) | - |
| Total Households | 155 (100.0%) | 2.75 |
Household Size by Marriage Status in Deming
Out of a total of 155 households in Deming, 54 (34.8%) are family households, while 101 (65.2%) are nonfamily households. The most numerous type of family households are 6-person households, comprising 53, and the most common type of nonfamily households are 1-person households, comprising 101.
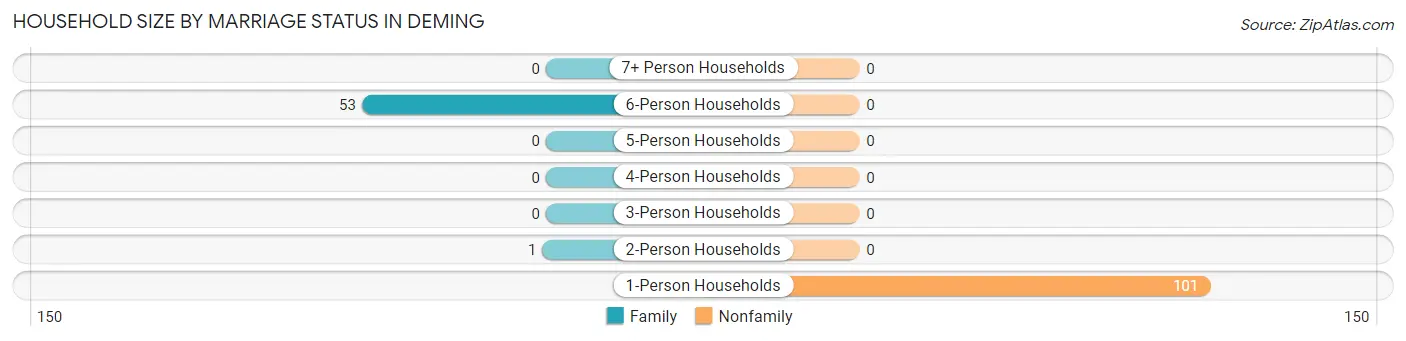
| Household Size | Family Households | Nonfamily Households |
| 1-Person Households | - | 101 (65.2%) |
| 2-Person Households | 1 (0.6%) | 0 (0.0%) |
| 3-Person Households | 0 (0.0%) | 0 (0.0%) |
| 4-Person Households | 0 (0.0%) | 0 (0.0%) |
| 5-Person Households | 0 (0.0%) | 0 (0.0%) |
| 6-Person Households | 53 (34.2%) | 0 (0.0%) |
| 7+ Person Households | 0 (0.0%) | 0 (0.0%) |
| Total | 54 (34.8%) | 101 (65.2%) |
Female Fertility in Deming
Fertility by Age in Deming
| Age Bracket | Women with Births | Births / 1,000 Women |
| 15 to 19 years | 0 (0.0%) | 0.0 |
| 20 to 34 years | 0 (0.0%) | 0.0 |
| 35 to 50 years | 0 (0.0%) | 0.0 |
| Total | 0 (0.0%) | 0.0 |
Fertility by Age by Marriage Status in Deming
| Age Bracket | Married | Unmarried |
| 15 to 19 years | 0 (0.0%) | 0 (0.0%) |
| 20 to 34 years | 0 (0.0%) | 0 (0.0%) |
| 35 to 50 years | 0 (0.0%) | 0 (0.0%) |
| Total | 0 (0.0%) | 0 (0.0%) |
Fertility by Education in Deming
| Educational Attainment | Women with Births | Births / 1,000 Women |
| Less than High School | 0 (0.0%) | 0.0 |
| High School Diploma | 0 (0.0%) | 0.0 |
| College or Associate's Degree | 0 (0.0%) | 0.0 |
| Bachelor's Degree | 0 (0.0%) | 0.0 |
| Graduate Degree | 0 (0.0%) | 0.0 |
| Total | 0 (0.0%) | 0.0 |
Fertility by Education by Marriage Status in Deming
| Educational Attainment | Married | Unmarried |
| Less than High School | 0 (0.0%) | 0 (0.0%) |
| High School Diploma | 0 (0.0%) | 0 (0.0%) |
| College or Associate's Degree | 0 (0.0%) | 0 (0.0%) |
| Bachelor's Degree | 0 (0.0%) | 0 (0.0%) |
| Graduate Degree | 0 (0.0%) | 0 (0.0%) |
| Total | 0 (0.0%) | 0 (0.0%) |
Employment Characteristics in Deming
Employment by Class of Employer in Deming
Among the 128 employed individuals in Deming, private company employees (82 | 64.1%), self-employed (incorporated) (45 | 35.2%), and self-employed (not incorporated) (1 | 0.8%) make up the most common classes of employment.
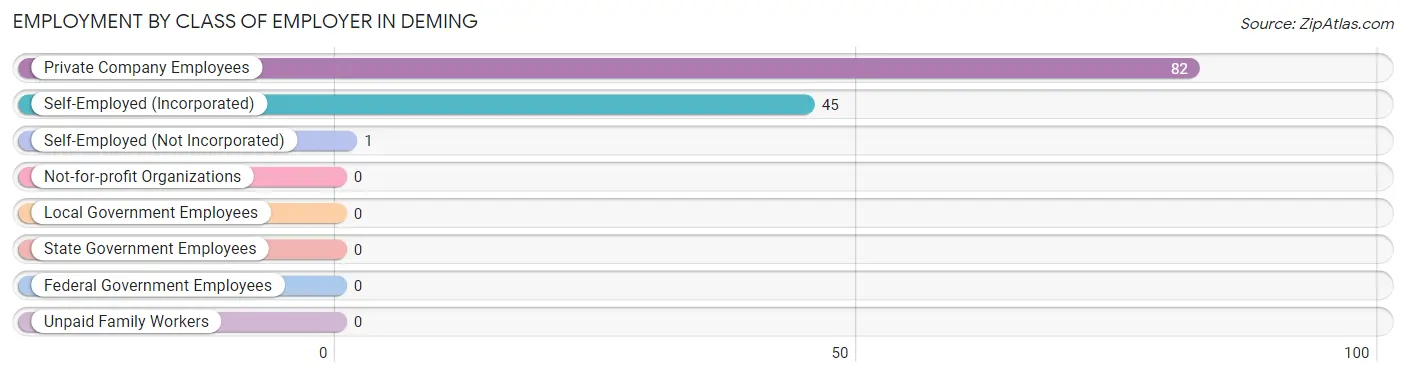
| Employer Class | # Employees | % Employees |
| Private Company Employees | 82 | 64.1% |
| Self-Employed (Incorporated) | 45 | 35.2% |
| Self-Employed (Not Incorporated) | 1 | 0.8% |
| Not-for-profit Organizations | 0 | 0.0% |
| Local Government Employees | 0 | 0.0% |
| State Government Employees | 0 | 0.0% |
| Federal Government Employees | 0 | 0.0% |
| Unpaid Family Workers | 0 | 0.0% |
| Total | 128 | 100.0% |
Employment Status by Age in Deming
According to the labor force statistics for Deming, out of the total population over 16 years of age (315), 57.5% or 181 individuals are in the labor force, with 29.3% or 53 of them unemployed. The age group with the highest labor force participation rate is 16 to 19 years, with 100.0% or 26 individuals in the labor force. Within the labor force, the 60 to 64 years age range has the highest percentage of unemployed individuals, with 54.1% or 53 of them being unemployed.
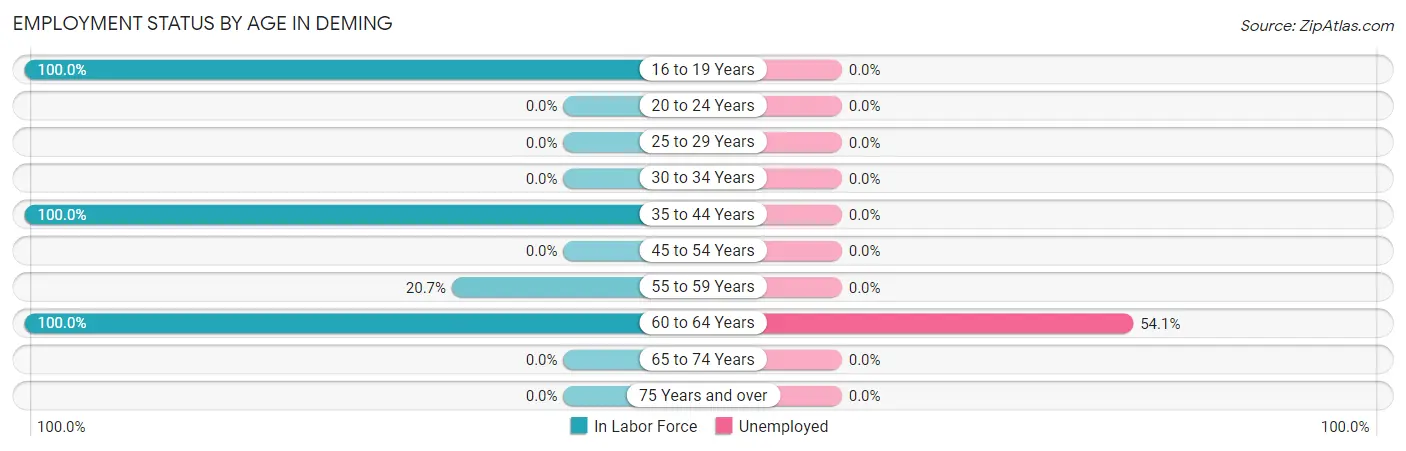
| Age Bracket | In Labor Force | Unemployed |
| 16 to 19 Years | 26 (100.0%) | 0 (0.0%) |
| 20 to 24 Years | 0 (0.0%) | 0 (0.0%) |
| 25 to 29 Years | 0 (0.0%) | 0 (0.0%) |
| 30 to 34 Years | 0 (0.0%) | 0 (0.0%) |
| 35 to 44 Years | 45 (100.0%) | 0 (0.0%) |
| 45 to 54 Years | 0 (0.0%) | 0 (0.0%) |
| 55 to 59 Years | 12 (20.7%) | 0 (0.0%) |
| 60 to 64 Years | 98 (100.0%) | 53 (54.1%) |
| 65 to 74 Years | 0 (0.0%) | 0 (0.0%) |
| 75 Years and over | 0 (0.0%) | 0 (0.0%) |
| Total | 181 (57.5%) | 53 (29.3%) |
Employment Status by Educational Attainment in Deming
According to labor force statistics for Deming, 77.1% of individuals (155) out of the total population between 25 and 64 years of age (201) are in the labor force, with 34.2% or 53 of them being unemployed. The group with the highest labor force participation rate are those with the educational attainment of bachelor's degree or higher, with 100.0% or 54 individuals in the labor force. Within the labor force, individuals with bachelor's degree or higher education have the highest percentage of unemployment, with 98.1% or 53 of them being unemployed.
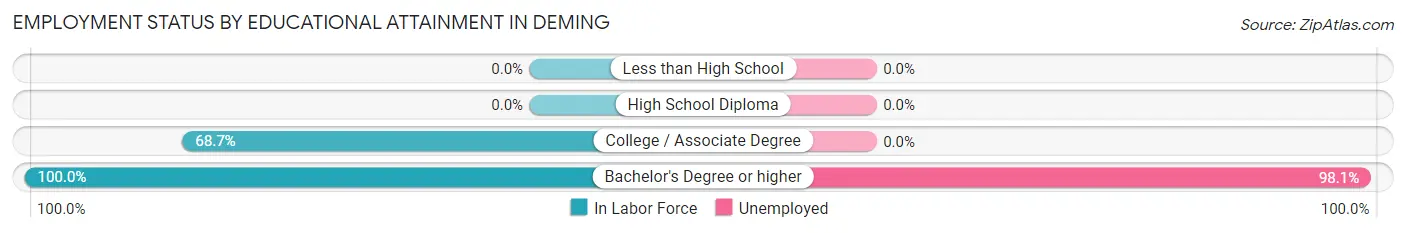
| Educational Attainment | In Labor Force | Unemployed |
| Less than High School | 0 (0.0%) | 0 (0.0%) |
| High School Diploma | 0 (0.0%) | 0 (0.0%) |
| College / Associate Degree | 101 (68.7%) | 0 (0.0%) |
| Bachelor's Degree or higher | 54 (100.0%) | 53 (98.1%) |
| Total | 155 (77.1%) | 69 (34.2%) |
Employment Occupations by Sex in Deming
Management, Business, Science and Arts Occupations
The most common Management, Business, Science and Arts occupations in Deming are Community & Social Service (1 | 0.8%), and Education Instruction & Library (1 | 0.8%).
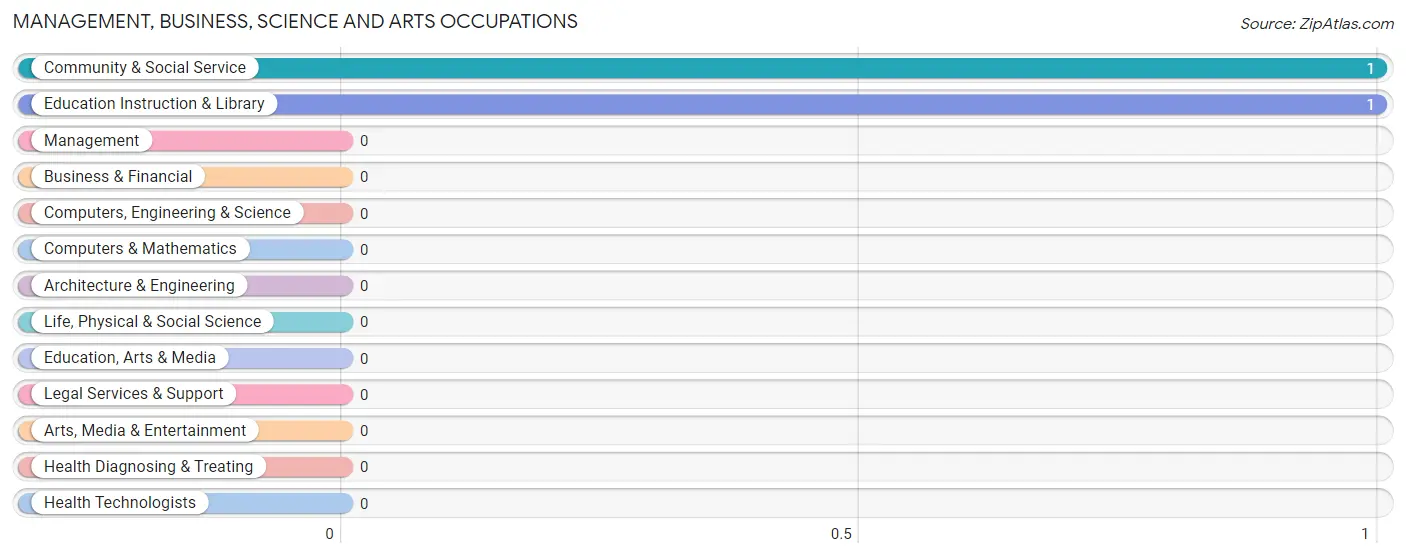
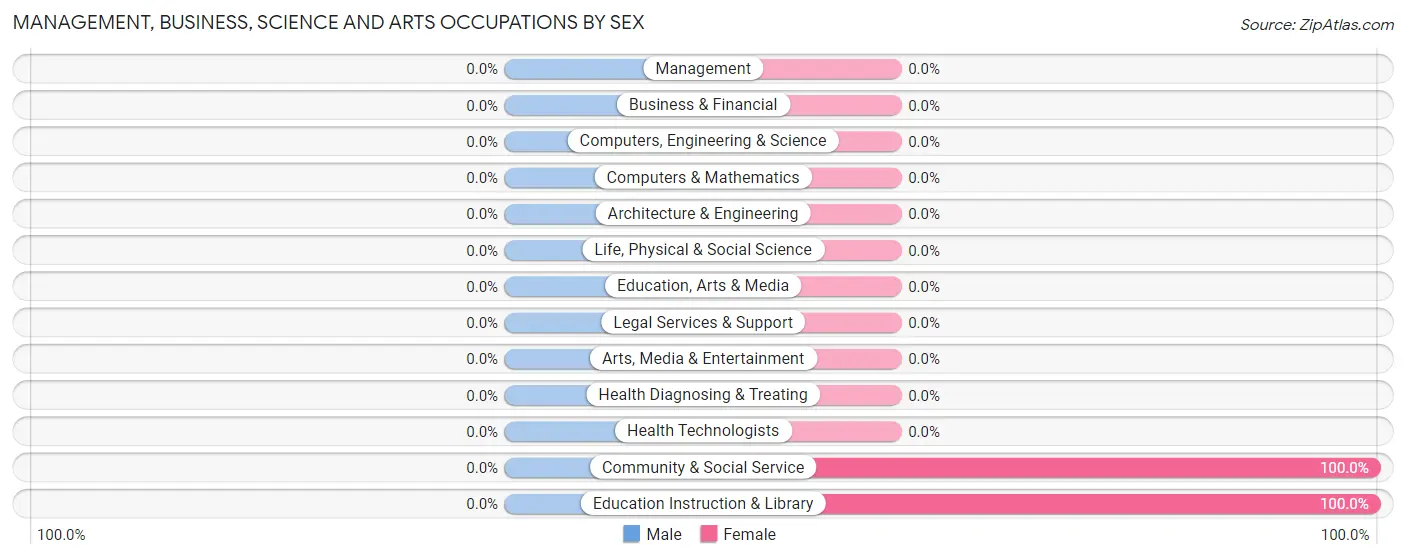
Management, Business, Science and Arts Occupations by Sex
| Occupation | Male | Female |
| Management | 0 (0.0%) | 0 (0.0%) |
| Business & Financial | 0 (0.0%) | 0 (0.0%) |
| Computers, Engineering & Science | 0 (0.0%) | 0 (0.0%) |
| Computers & Mathematics | 0 (0.0%) | 0 (0.0%) |
| Architecture & Engineering | 0 (0.0%) | 0 (0.0%) |
| Life, Physical & Social Science | 0 (0.0%) | 0 (0.0%) |
| Community & Social Service | 0 (0.0%) | 1 (100.0%) |
| Education, Arts & Media | 0 (0.0%) | 0 (0.0%) |
| Legal Services & Support | 0 (0.0%) | 0 (0.0%) |
| Education Instruction & Library | 0 (0.0%) | 1 (100.0%) |
| Arts, Media & Entertainment | 0 (0.0%) | 0 (0.0%) |
| Health Diagnosing & Treating | 0 (0.0%) | 0 (0.0%) |
| Health Technologists | 0 (0.0%) | 0 (0.0%) |
| Total (Category) | 0 (0.0%) | 1 (100.0%) |
| Total (Overall) | 83 (64.8%) | 45 (35.2%) |
Services Occupations
The most common Services occupations in Deming are , and Food Preparation & Serving (26 | 20.3%).
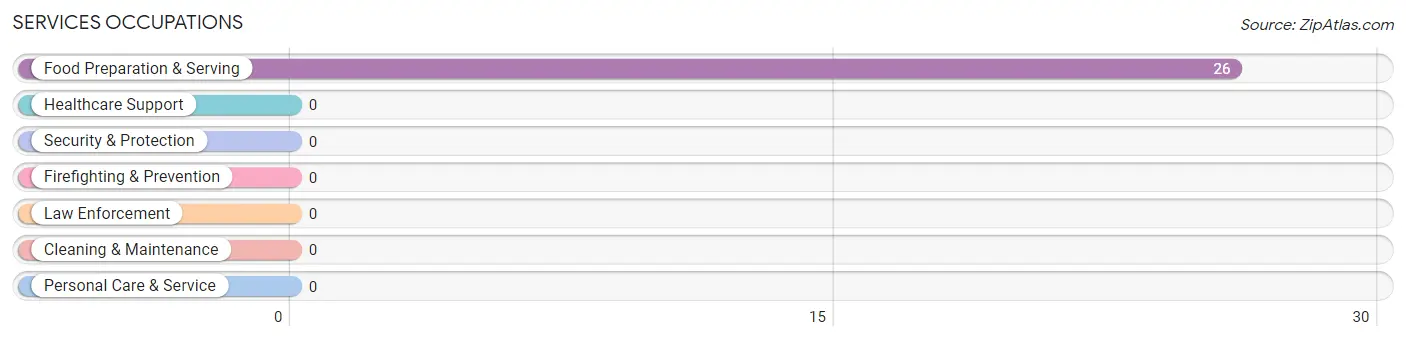
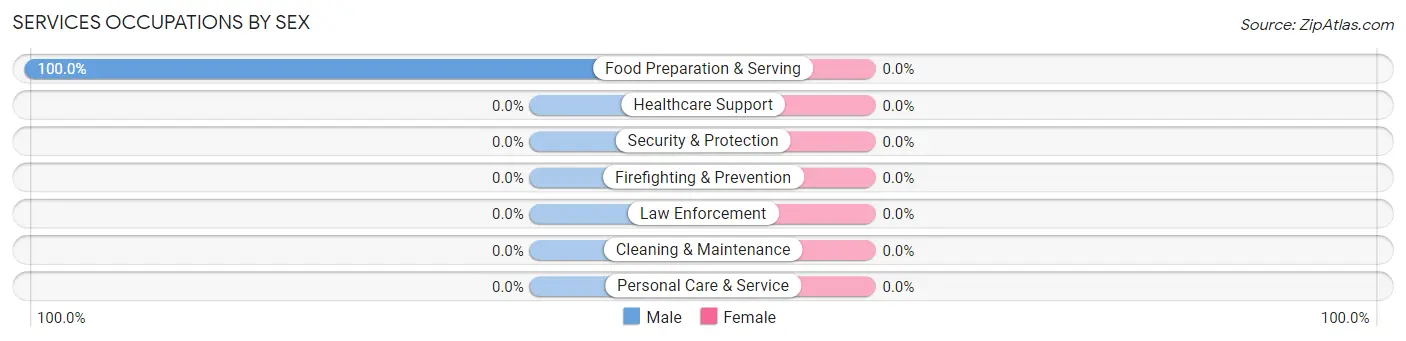
Services Occupations by Sex
| Occupation | Male | Female |
| Healthcare Support | 0 (0.0%) | 0 (0.0%) |
| Security & Protection | 0 (0.0%) | 0 (0.0%) |
| Firefighting & Prevention | 0 (0.0%) | 0 (0.0%) |
| Law Enforcement | 0 (0.0%) | 0 (0.0%) |
| Food Preparation & Serving | 26 (100.0%) | 0 (0.0%) |
| Cleaning & Maintenance | 0 (0.0%) | 0 (0.0%) |
| Personal Care & Service | 0 (0.0%) | 0 (0.0%) |
| Total (Category) | 26 (100.0%) | 0 (0.0%) |
| Total (Overall) | 83 (64.8%) | 45 (35.2%) |
Sales and Office Occupations
Sales and Office Occupations by Sex
| Occupation | Male | Female |
| Sales & Related | 0 (0.0%) | 0 (0.0%) |
| Office & Administration | 0 (0.0%) | 0 (0.0%) |
| Total (Category) | 0 (0.0%) | 0 (0.0%) |
| Total (Overall) | 83 (64.8%) | 45 (35.2%) |
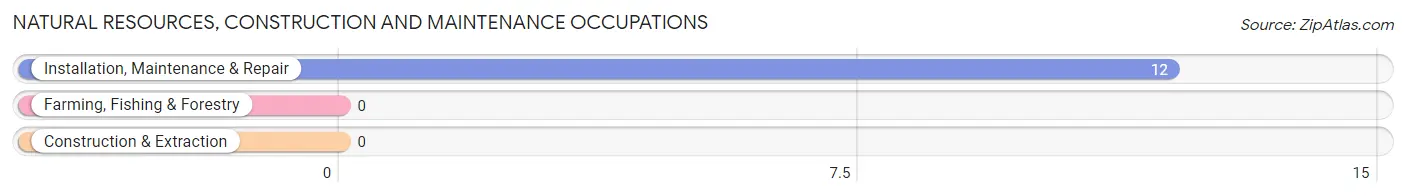
Natural Resources, Construction and Maintenance Occupations
The most common Natural Resources, Construction and Maintenance occupations in Deming are , and Installation, Maintenance & Repair (12 | 9.4%).
Natural Resources, Construction and Maintenance Occupations by Sex
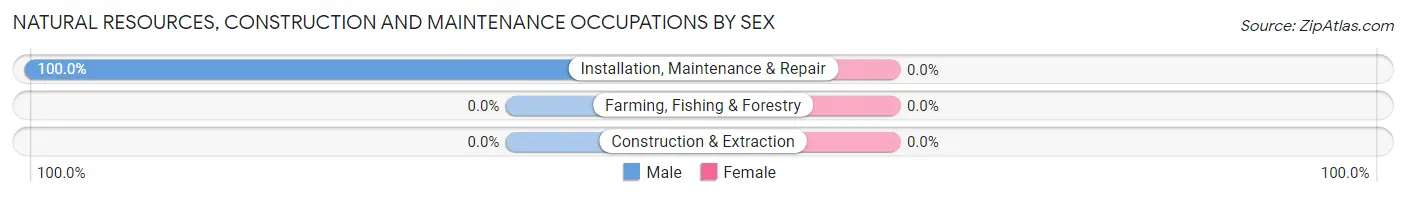
| Occupation | Male | Female |
| Farming, Fishing & Forestry | 0 (0.0%) | 0 (0.0%) |
| Construction & Extraction | 0 (0.0%) | 0 (0.0%) |
| Installation, Maintenance & Repair | 12 (100.0%) | 0 (0.0%) |
| Total (Category) | 12 (100.0%) | 0 (0.0%) |
| Total (Overall) | 83 (64.8%) | 45 (35.2%) |
Production, Transportation and Moving Occupations
The most common Production, Transportation and Moving occupations in Deming are Production (45 | 35.2%), and Material Moving (44 | 34.4%).
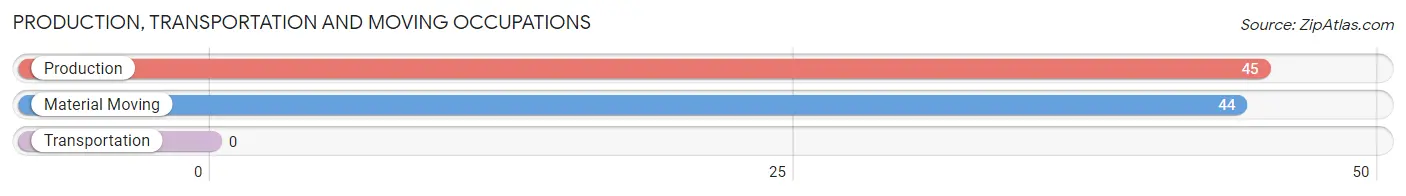
Production, Transportation and Moving Occupations by Sex
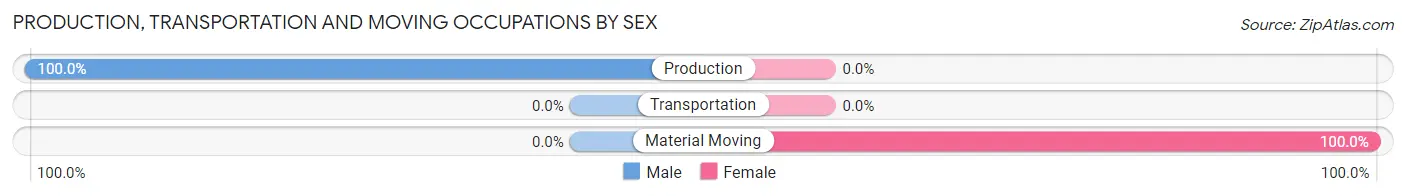
| Occupation | Male | Female |
| Production | 45 (100.0%) | 0 (0.0%) |
| Transportation | 0 (0.0%) | 0 (0.0%) |
| Material Moving | 0 (0.0%) | 44 (100.0%) |
| Total (Category) | 45 (50.6%) | 44 (49.4%) |
| Total (Overall) | 83 (64.8%) | 45 (35.2%) |
Employment Industries by Sex in Deming
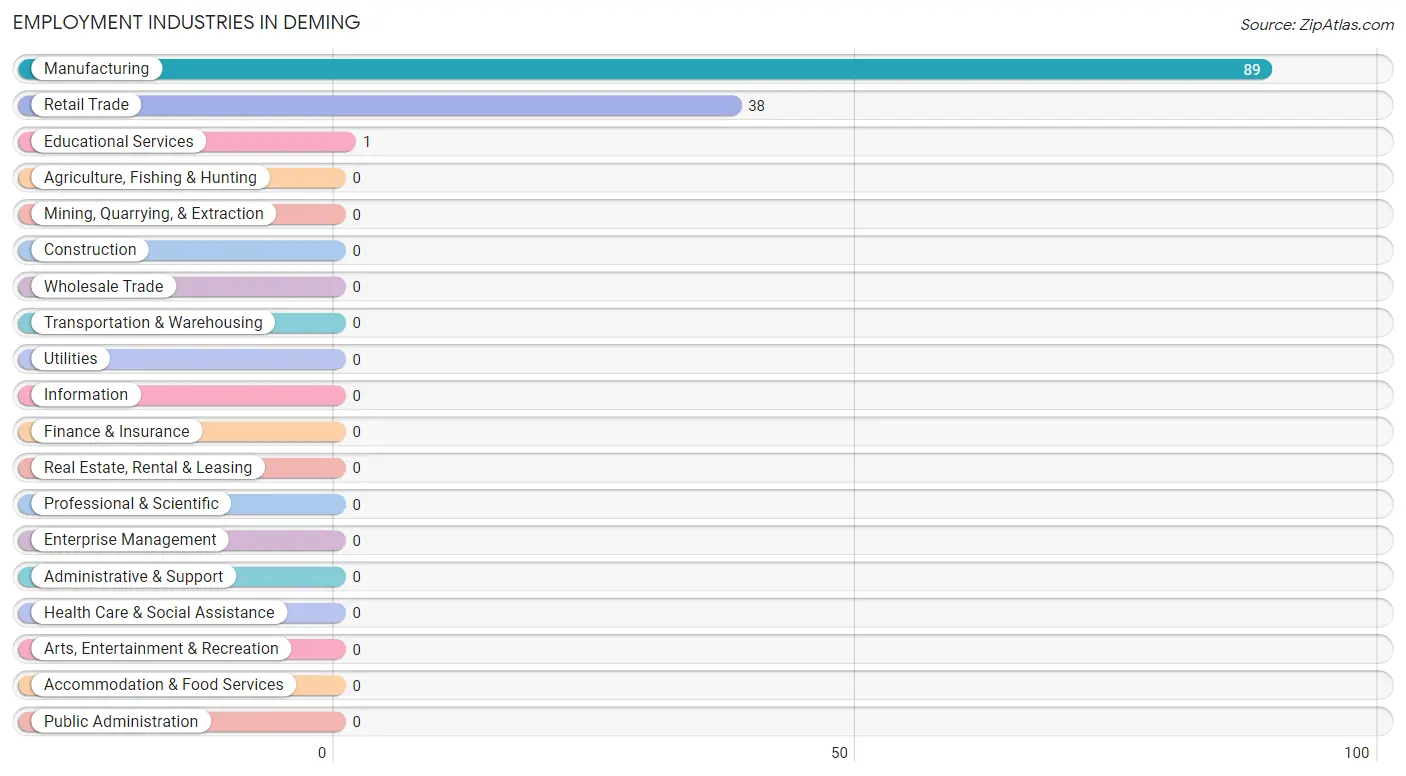
Employment Industries in Deming
The major employment industries in Deming include Manufacturing (89 | 69.5%), Retail Trade (38 | 29.7%), and Educational Services (1 | 0.8%).
Employment Industries by Sex in Deming
The Deming industries that see more men than women are Retail Trade (100.0%), and Manufacturing (50.6%), whereas the industries that tend to have a higher number of women are Educational Services (100.0%), and Manufacturing (49.4%).
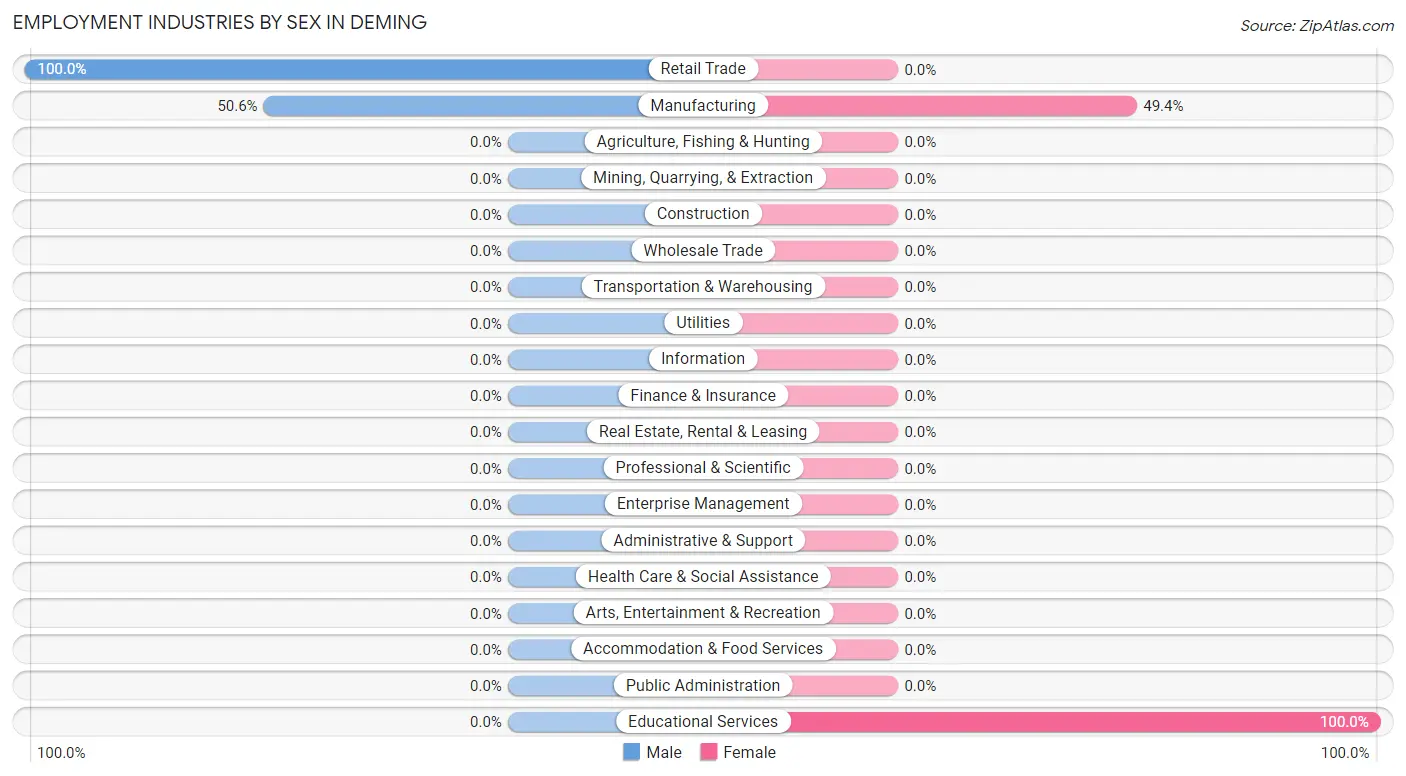
| Industry | Male | Female |
| Agriculture, Fishing & Hunting | 0 (0.0%) | 0 (0.0%) |
| Mining, Quarrying, & Extraction | 0 (0.0%) | 0 (0.0%) |
| Construction | 0 (0.0%) | 0 (0.0%) |
| Manufacturing | 45 (50.6%) | 44 (49.4%) |
| Wholesale Trade | 0 (0.0%) | 0 (0.0%) |
| Retail Trade | 38 (100.0%) | 0 (0.0%) |
| Transportation & Warehousing | 0 (0.0%) | 0 (0.0%) |
| Utilities | 0 (0.0%) | 0 (0.0%) |
| Information | 0 (0.0%) | 0 (0.0%) |
| Finance & Insurance | 0 (0.0%) | 0 (0.0%) |
| Real Estate, Rental & Leasing | 0 (0.0%) | 0 (0.0%) |
| Professional & Scientific | 0 (0.0%) | 0 (0.0%) |
| Enterprise Management | 0 (0.0%) | 0 (0.0%) |
| Administrative & Support | 0 (0.0%) | 0 (0.0%) |
| Educational Services | 0 (0.0%) | 1 (100.0%) |
| Health Care & Social Assistance | 0 (0.0%) | 0 (0.0%) |
| Arts, Entertainment & Recreation | 0 (0.0%) | 0 (0.0%) |
| Accommodation & Food Services | 0 (0.0%) | 0 (0.0%) |
| Public Administration | 0 (0.0%) | 0 (0.0%) |
| Total | 83 (64.8%) | 45 (35.2%) |
Education in Deming
School Enrollment in Deming
The most common levels of schooling among the 271 students in Deming are college / undergraduate (159 | 58.7%), and middle school (112 | 41.3%).
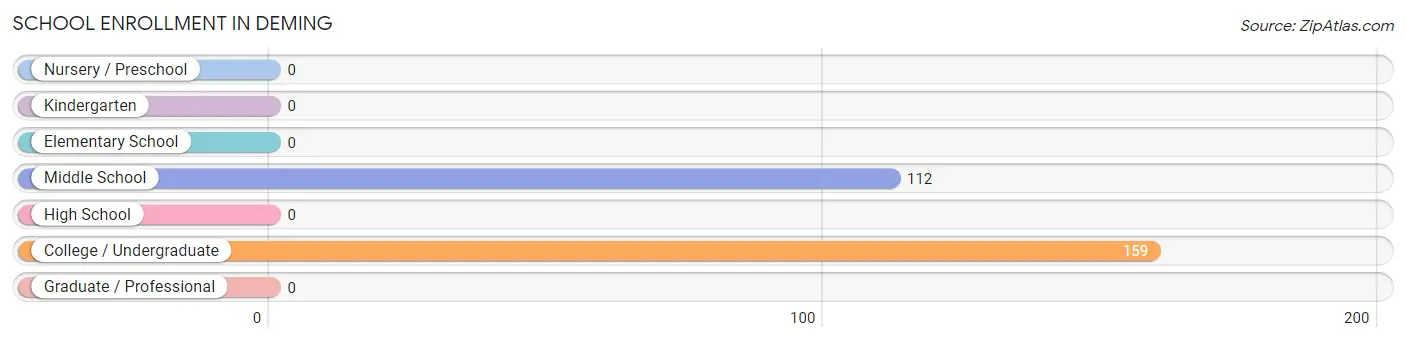
| School Level | # Students | % Students |
| Nursery / Preschool | 0 | 0.0% |
| Kindergarten | 0 | 0.0% |
| Elementary School | 0 | 0.0% |
| Middle School | 112 | 41.3% |
| High School | 0 | 0.0% |
| College / Undergraduate | 159 | 58.7% |
| Graduate / Professional | 0 | 0.0% |
| Total | 271 | 100.0% |
School Enrollment by Age by Funding Source in Deming
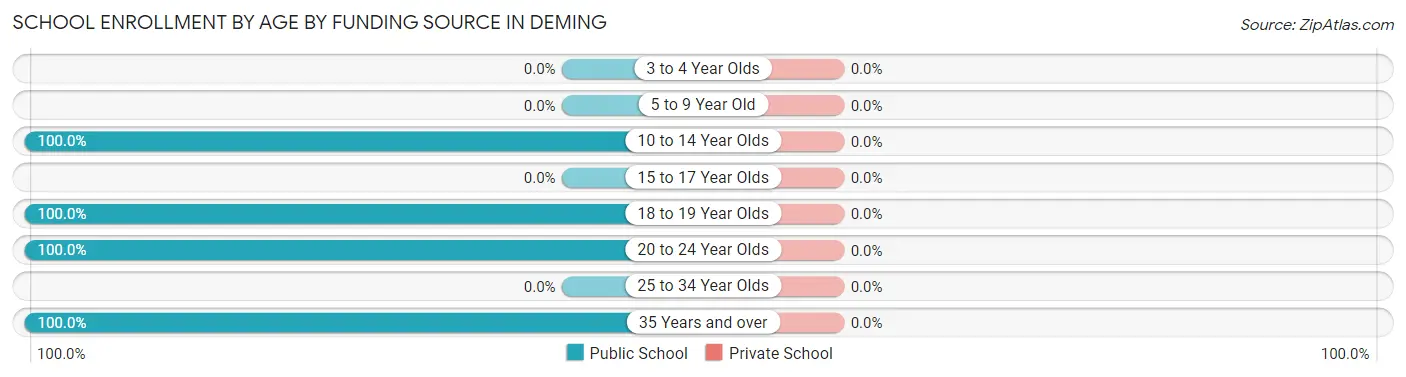
| Age Bracket | Public School | Private School |
| 3 to 4 Year Olds | 0 (0.0%) | 0 (0.0%) |
| 5 to 9 Year Old | 0 (0.0%) | 0 (0.0%) |
| 10 to 14 Year Olds | 112 (100.0%) | 0 (0.0%) |
| 15 to 17 Year Olds | 0 (0.0%) | 0 (0.0%) |
| 18 to 19 Year Olds | 26 (100.0%) | 0 (0.0%) |
| 20 to 24 Year Olds | 87 (100.0%) | 0 (0.0%) |
| 25 to 34 Year Olds | 0 (0.0%) | 0 (0.0%) |
| 35 Years and over | 46 (100.0%) | 0 (0.0%) |
| Total | 271 (100.0%) | 0 (0.0%) |
Educational Attainment by Field of Study in Deming
Engineering (53 | 96.4%), and bio, nature & agricultural (2 | 3.6%) are the most common fields of study among 55 individuals in Deming who have obtained a bachelor's degree or higher.
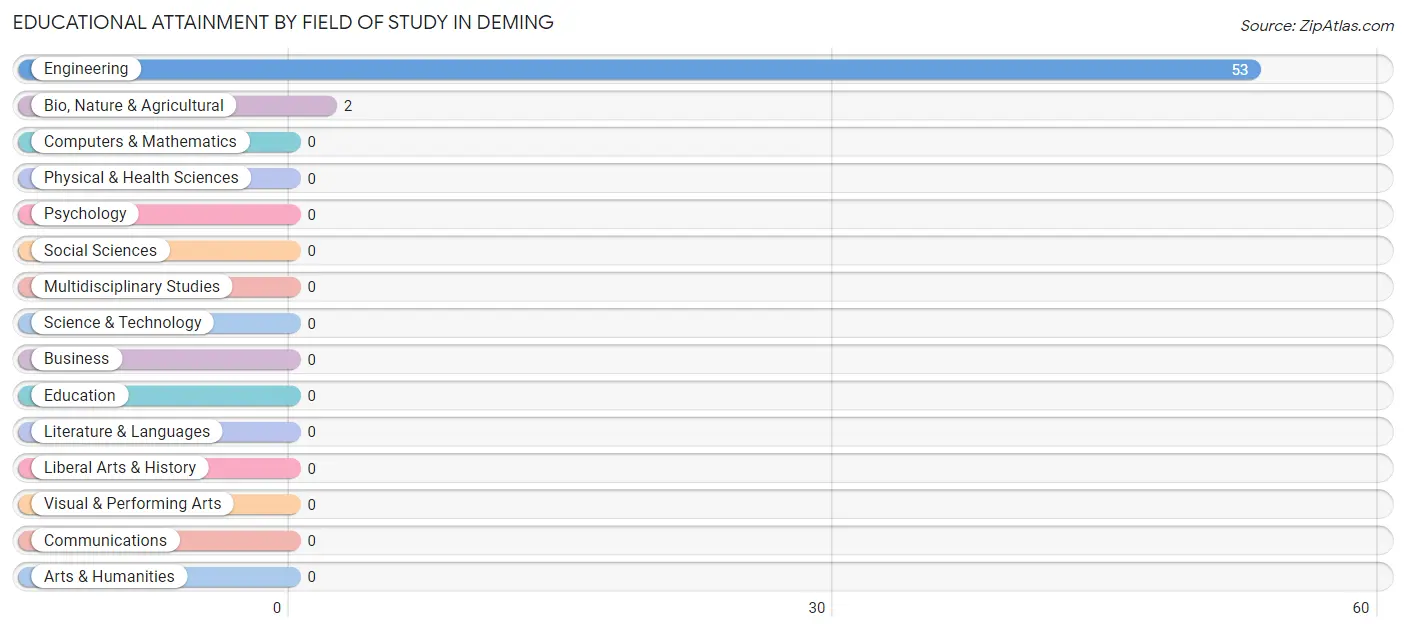
| Field of Study | # Graduates | % Graduates |
| Computers & Mathematics | 0 | 0.0% |
| Bio, Nature & Agricultural | 2 | 3.6% |
| Physical & Health Sciences | 0 | 0.0% |
| Psychology | 0 | 0.0% |
| Social Sciences | 0 | 0.0% |
| Engineering | 53 | 96.4% |
| Multidisciplinary Studies | 0 | 0.0% |
| Science & Technology | 0 | 0.0% |
| Business | 0 | 0.0% |
| Education | 0 | 0.0% |
| Literature & Languages | 0 | 0.0% |
| Liberal Arts & History | 0 | 0.0% |
| Visual & Performing Arts | 0 | 0.0% |
| Communications | 0 | 0.0% |
| Arts & Humanities | 0 | 0.0% |
| Total | 55 | 100.0% |
Transportation & Commute in Deming
Vehicle Availability by Sex in Deming
The most prevalent vehicle ownership categories in Deming are males with 3 vehicles (71, accounting for 85.5%) and females with 3 vehicles (1, making up 157.8%).
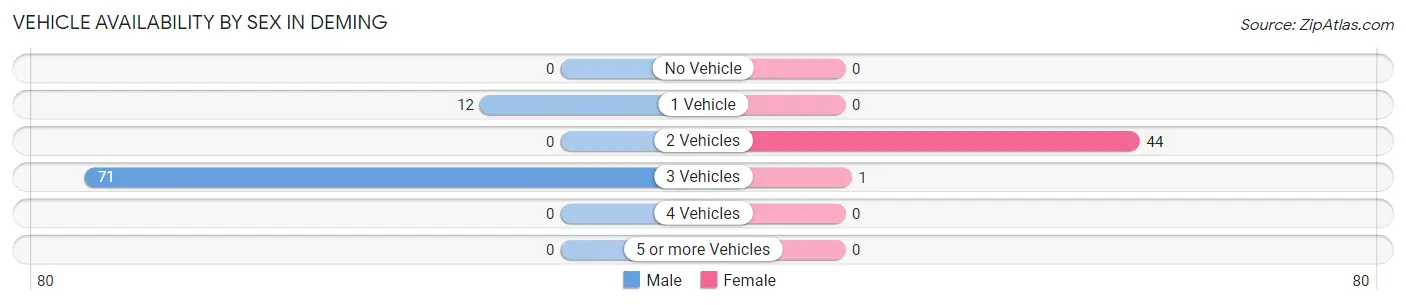
| Vehicles Available | Male | Female |
| No Vehicle | 0 (0.0%) | 0 (0.0%) |
| 1 Vehicle | 12 (14.5%) | 0 (0.0%) |
| 2 Vehicles | 0 (0.0%) | 44 (97.8%) |
| 3 Vehicles | 71 (85.5%) | 1 (2.2%) |
| 4 Vehicles | 0 (0.0%) | 0 (0.0%) |
| 5 or more Vehicles | 0 (0.0%) | 0 (0.0%) |
| Total | 83 (100.0%) | 45 (100.0%) |
Commute Time in Deming
The most frequently occuring commute durations in Deming are 35 to 39 minutes (45 commuters, 35.2%), 45 to 59 minutes (44 commuters, 34.4%), and 15 to 19 minutes (26 commuters, 20.3%).
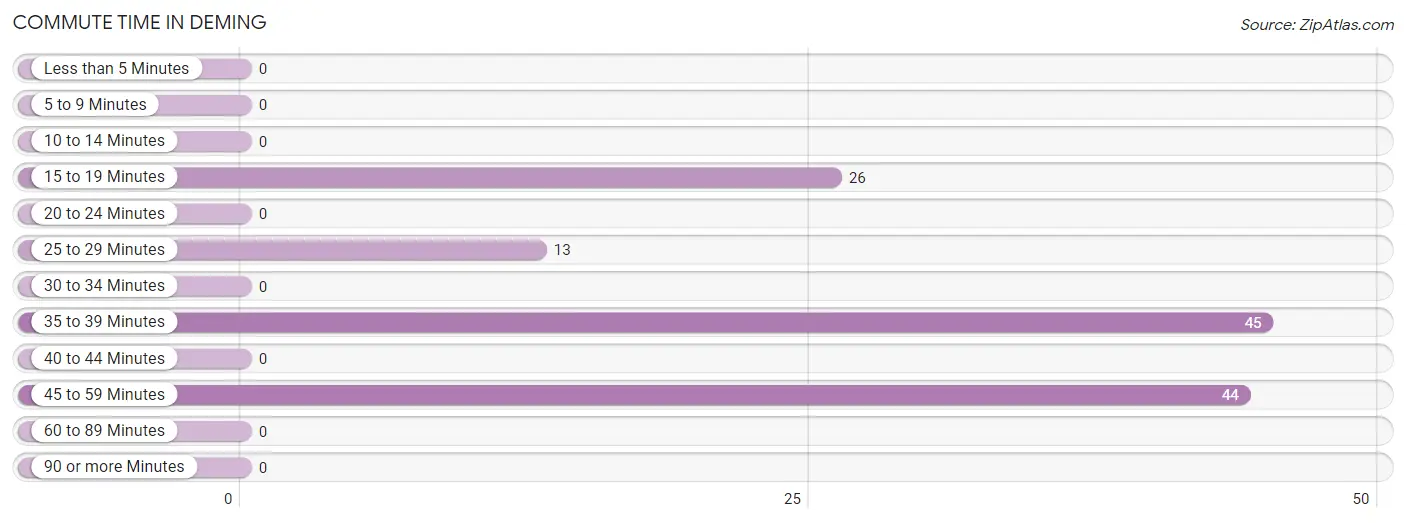
| Commute Time | # Commuters | % Commuters |
| Less than 5 Minutes | 0 | 0.0% |
| 5 to 9 Minutes | 0 | 0.0% |
| 10 to 14 Minutes | 0 | 0.0% |
| 15 to 19 Minutes | 26 | 20.3% |
| 20 to 24 Minutes | 0 | 0.0% |
| 25 to 29 Minutes | 13 | 10.2% |
| 30 to 34 Minutes | 0 | 0.0% |
| 35 to 39 Minutes | 45 | 35.2% |
| 40 to 44 Minutes | 0 | 0.0% |
| 45 to 59 Minutes | 44 | 34.4% |
| 60 to 89 Minutes | 0 | 0.0% |
| 90 or more Minutes | 0 | 0.0% |
Commute Time by Sex in Deming
The most common commute times in Deming are 35 to 39 minutes (45 commuters, 54.2%) for males and 45 to 59 minutes (44 commuters, 97.8%) for females.
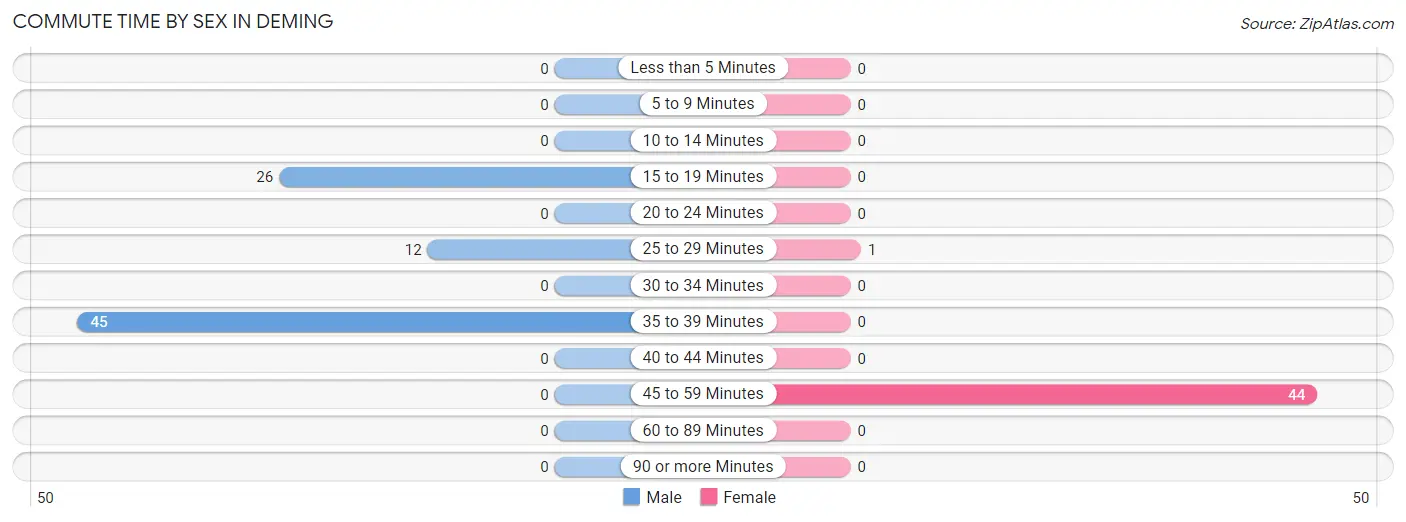
| Commute Time | Male | Female |
| Less than 5 Minutes | 0 (0.0%) | 0 (0.0%) |
| 5 to 9 Minutes | 0 (0.0%) | 0 (0.0%) |
| 10 to 14 Minutes | 0 (0.0%) | 0 (0.0%) |
| 15 to 19 Minutes | 26 (31.3%) | 0 (0.0%) |
| 20 to 24 Minutes | 0 (0.0%) | 0 (0.0%) |
| 25 to 29 Minutes | 12 (14.5%) | 1 (2.2%) |
| 30 to 34 Minutes | 0 (0.0%) | 0 (0.0%) |
| 35 to 39 Minutes | 45 (54.2%) | 0 (0.0%) |
| 40 to 44 Minutes | 0 (0.0%) | 0 (0.0%) |
| 45 to 59 Minutes | 0 (0.0%) | 44 (97.8%) |
| 60 to 89 Minutes | 0 (0.0%) | 0 (0.0%) |
| 90 or more Minutes | 0 (0.0%) | 0 (0.0%) |
Time of Departure to Work by Sex in Deming
The most frequent times of departure to work in Deming are 6:30 AM to 6:59 AM (45, 54.2%) for males and 12:00 AM to 4:59 AM (44, 97.8%) for females.
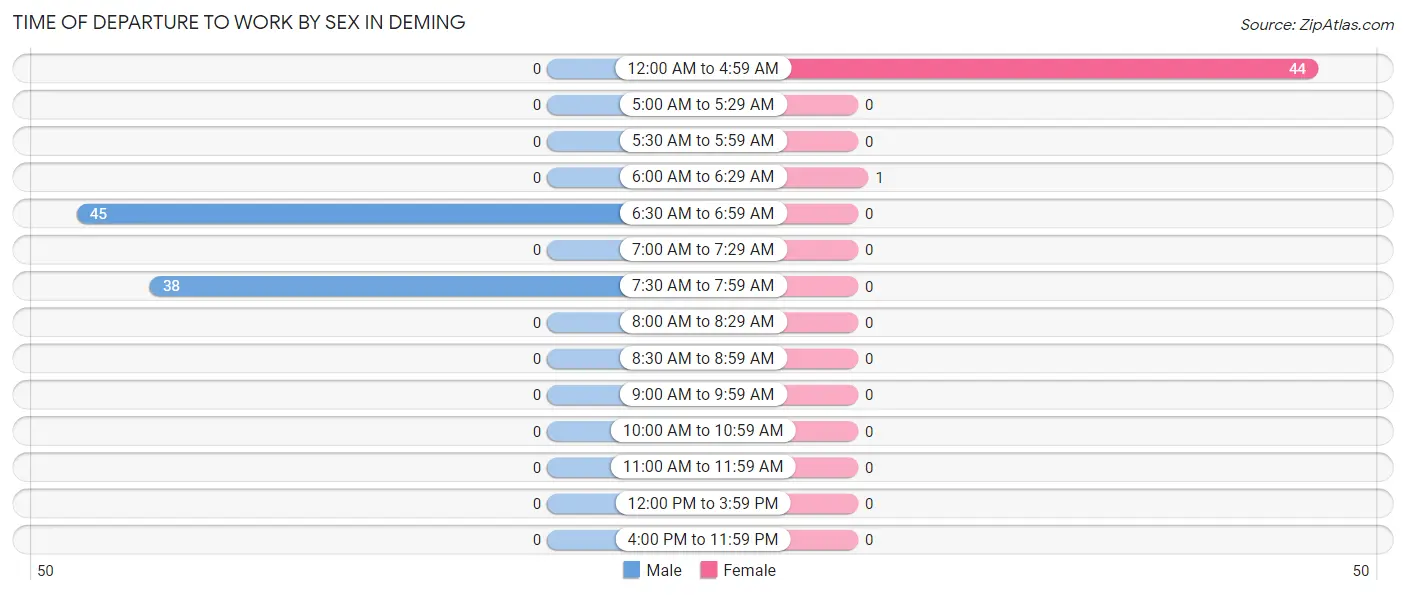
| Time of Departure | Male | Female |
| 12:00 AM to 4:59 AM | 0 (0.0%) | 44 (97.8%) |
| 5:00 AM to 5:29 AM | 0 (0.0%) | 0 (0.0%) |
| 5:30 AM to 5:59 AM | 0 (0.0%) | 0 (0.0%) |
| 6:00 AM to 6:29 AM | 0 (0.0%) | 1 (2.2%) |
| 6:30 AM to 6:59 AM | 45 (54.2%) | 0 (0.0%) |
| 7:00 AM to 7:29 AM | 0 (0.0%) | 0 (0.0%) |
| 7:30 AM to 7:59 AM | 38 (45.8%) | 0 (0.0%) |
| 8:00 AM to 8:29 AM | 0 (0.0%) | 0 (0.0%) |
| 8:30 AM to 8:59 AM | 0 (0.0%) | 0 (0.0%) |
| 9:00 AM to 9:59 AM | 0 (0.0%) | 0 (0.0%) |
| 10:00 AM to 10:59 AM | 0 (0.0%) | 0 (0.0%) |
| 11:00 AM to 11:59 AM | 0 (0.0%) | 0 (0.0%) |
| 12:00 PM to 3:59 PM | 0 (0.0%) | 0 (0.0%) |
| 4:00 PM to 11:59 PM | 0 (0.0%) | 0 (0.0%) |
| Total | 83 (100.0%) | 45 (100.0%) |
Housing Occupancy in Deming
Occupancy by Ownership in Deming
Of the total 155 dwellings in Deming, owner-occupied units account for 155 (100.0%), while renter-occupied units make up 0 (0.0%).
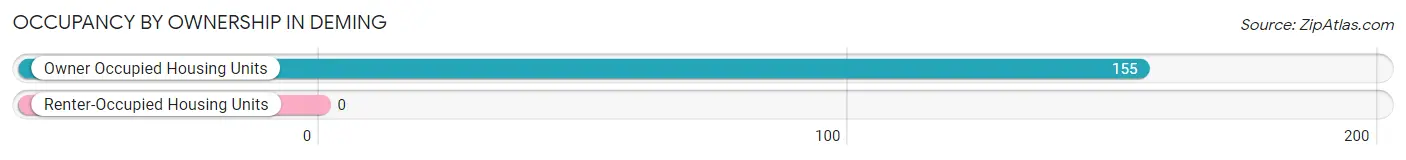
| Occupancy | # Housing Units | % Housing Units |
| Owner Occupied Housing Units | 155 | 100.0% |
| Renter-Occupied Housing Units | 0 | 0.0% |
| Total Occupied Housing Units | 155 | 100.0% |
Occupancy by Household Size in Deming
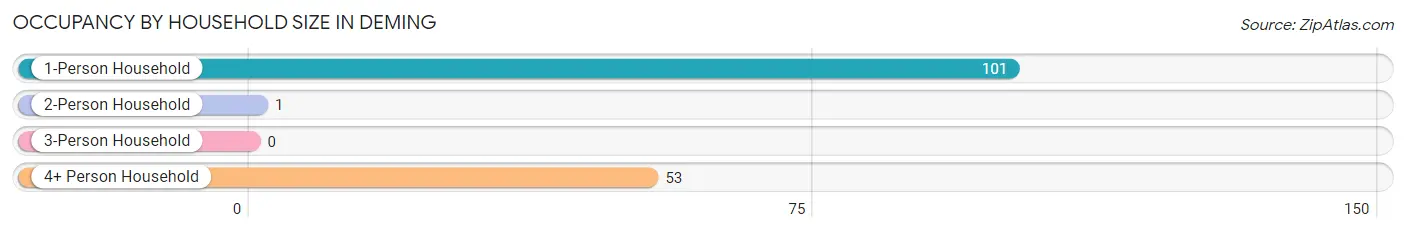
| Household Size | # Housing Units | % Housing Units |
| 1-Person Household | 101 | 65.2% |
| 2-Person Household | 1 | 0.6% |
| 3-Person Household | 0 | 0.0% |
| 4+ Person Household | 53 | 34.2% |
| Total Housing Units | 155 | 100.0% |
Occupancy by Ownership by Household Size in Deming
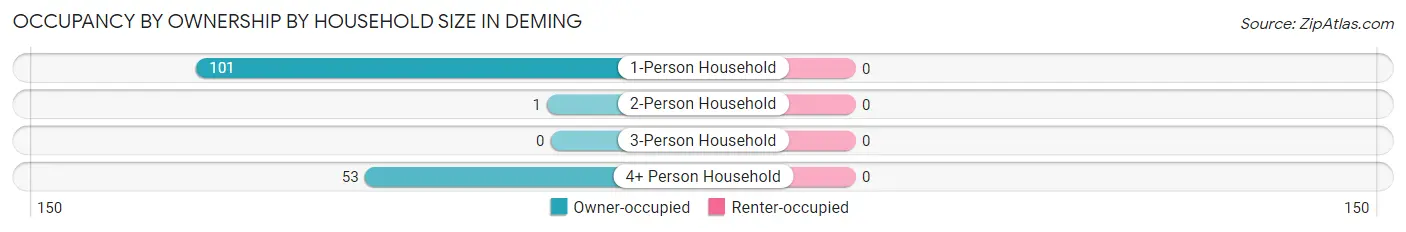
| Household Size | Owner-occupied | Renter-occupied |
| 1-Person Household | 101 (100.0%) | 0 (0.0%) |
| 2-Person Household | 1 (100.0%) | 0 (0.0%) |
| 3-Person Household | 0 (0.0%) | 0 (0.0%) |
| 4+ Person Household | 53 (100.0%) | 0 (0.0%) |
| Total Housing Units | 155 (100.0%) | 0 (0.0%) |
Occupancy by Educational Attainment in Deming
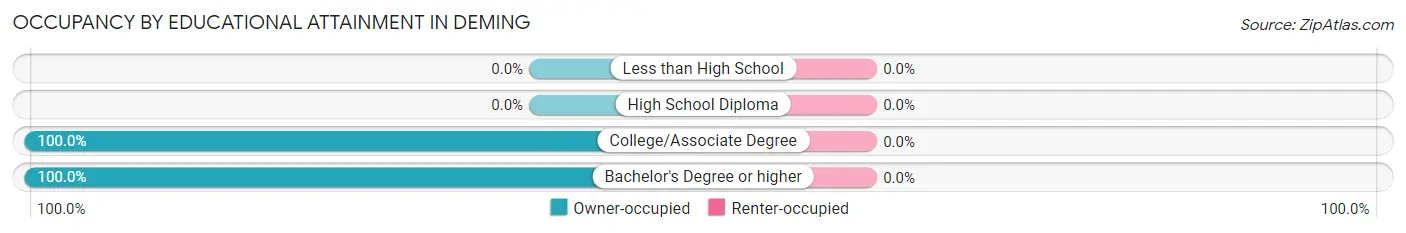
| Household Size | Owner-occupied | Renter-occupied |
| Less than High School | 0 (0.0%) | 0 (0.0%) |
| High School Diploma | 0 (0.0%) | 0 (0.0%) |
| College/Associate Degree | 101 (100.0%) | 0 (0.0%) |
| Bachelor's Degree or higher | 54 (100.0%) | 0 (0.0%) |
Occupancy by Age of Householder in Deming
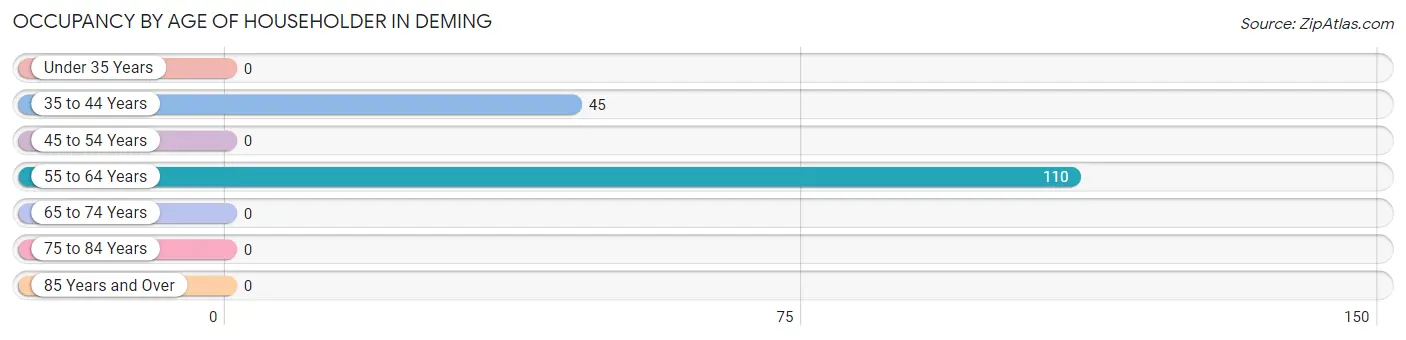
| Age Bracket | # Households | % Households |
| Under 35 Years | 0 | 0.0% |
| 35 to 44 Years | 45 | 29.0% |
| 45 to 54 Years | 0 | 0.0% |
| 55 to 64 Years | 110 | 71.0% |
| 65 to 74 Years | 0 | 0.0% |
| 75 to 84 Years | 0 | 0.0% |
| 85 Years and Over | 0 | 0.0% |
| Total | 155 | 100.0% |
Housing Finances in Deming
Median Income by Occupancy in Deming
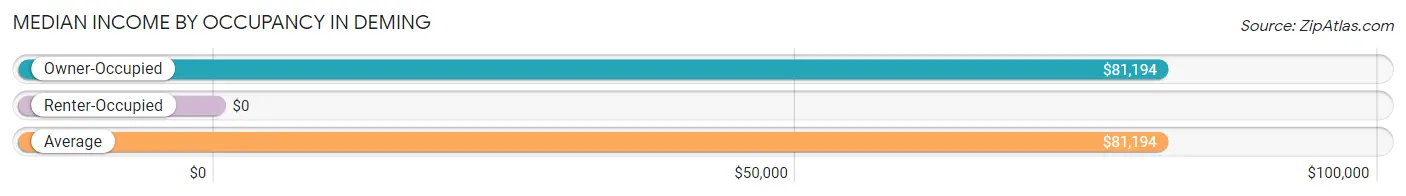
| Occupancy Type | # Households | Median Income |
| Owner-Occupied | 155 (100.0%) | $81,194 |
| Renter-Occupied | 0 (0.0%) | $0 |
| Average | 155 (100.0%) | $81,194 |
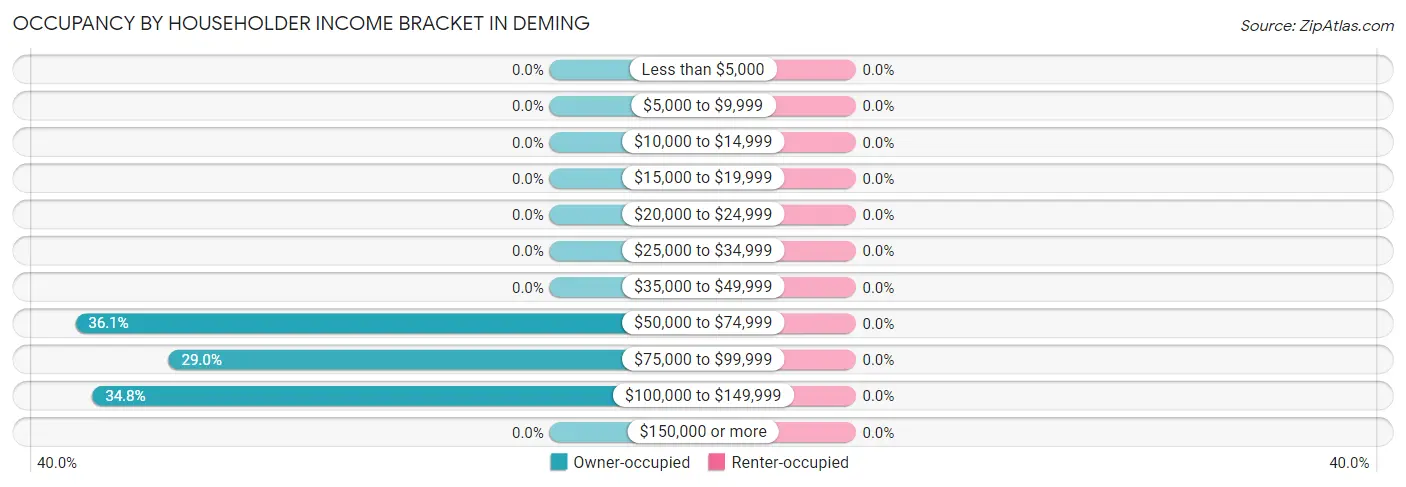
Occupancy by Householder Income Bracket in Deming
| Income Bracket | Owner-occupied | Renter-occupied |
| Less than $5,000 | 0 (0.0%) | 0 (0.0%) |
| $5,000 to $9,999 | 0 (0.0%) | 0 (0.0%) |
| $10,000 to $14,999 | 0 (0.0%) | 0 (0.0%) |
| $15,000 to $19,999 | 0 (0.0%) | 0 (0.0%) |
| $20,000 to $24,999 | 0 (0.0%) | 0 (0.0%) |
| $25,000 to $34,999 | 0 (0.0%) | 0 (0.0%) |
| $35,000 to $49,999 | 0 (0.0%) | 0 (0.0%) |
| $50,000 to $74,999 | 56 (36.1%) | 0 (0.0%) |
| $75,000 to $99,999 | 45 (29.0%) | 0 (0.0%) |
| $100,000 to $149,999 | 54 (34.8%) | 0 (0.0%) |
| $150,000 or more | 0 (0.0%) | 0 (0.0%) |
| Total | 155 (100.0%) | 0 (0.0%) |
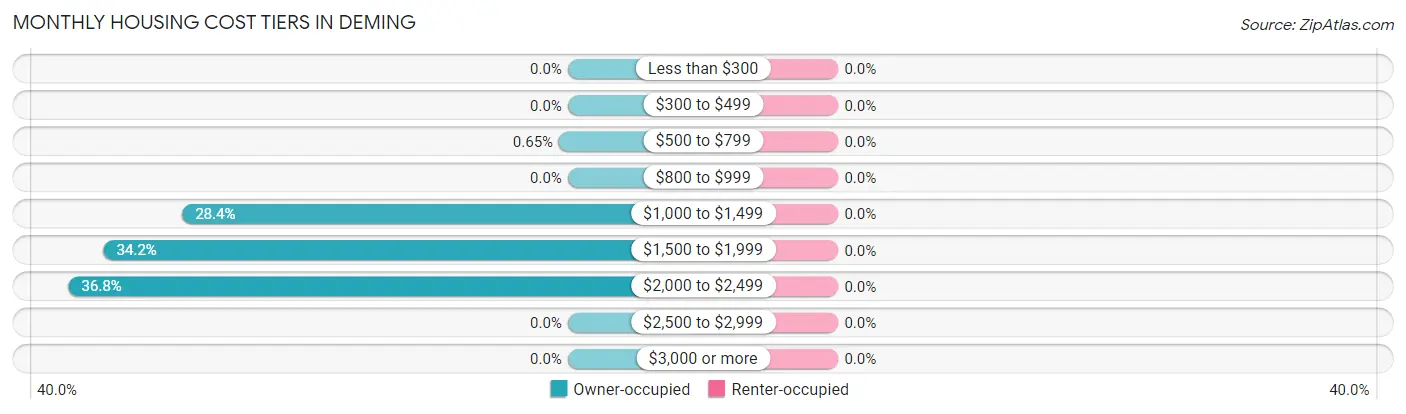
Monthly Housing Cost Tiers in Deming
| Monthly Cost | Owner-occupied | Renter-occupied |
| Less than $300 | 0 (0.0%) | 0 (0.0%) |
| $300 to $499 | 0 (0.0%) | 0 (0.0%) |
| $500 to $799 | 1 (0.6%) | 0 (0.0%) |
| $800 to $999 | 0 (0.0%) | 0 (0.0%) |
| $1,000 to $1,499 | 44 (28.4%) | 0 (0.0%) |
| $1,500 to $1,999 | 53 (34.2%) | 0 (0.0%) |
| $2,000 to $2,499 | 57 (36.8%) | 0 (0.0%) |
| $2,500 to $2,999 | 0 (0.0%) | 0 (0.0%) |
| $3,000 or more | 0 (0.0%) | 0 (0.0%) |
| Total | 155 (100.0%) | 0 (0.0%) |
Physical Housing Characteristics in Deming
Housing Structures in Deming
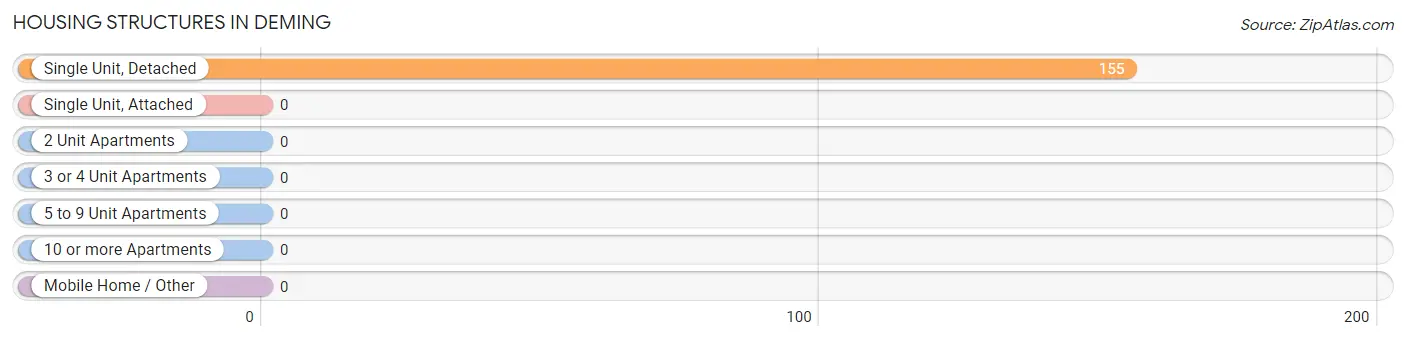
| Structure Type | # Housing Units | % Housing Units |
| Single Unit, Detached | 155 | 100.0% |
| Single Unit, Attached | 0 | 0.0% |
| 2 Unit Apartments | 0 | 0.0% |
| 3 or 4 Unit Apartments | 0 | 0.0% |
| 5 to 9 Unit Apartments | 0 | 0.0% |
| 10 or more Apartments | 0 | 0.0% |
| Mobile Home / Other | 0 | 0.0% |
| Total | 155 | 100.0% |
Housing Structures by Occupancy in Deming
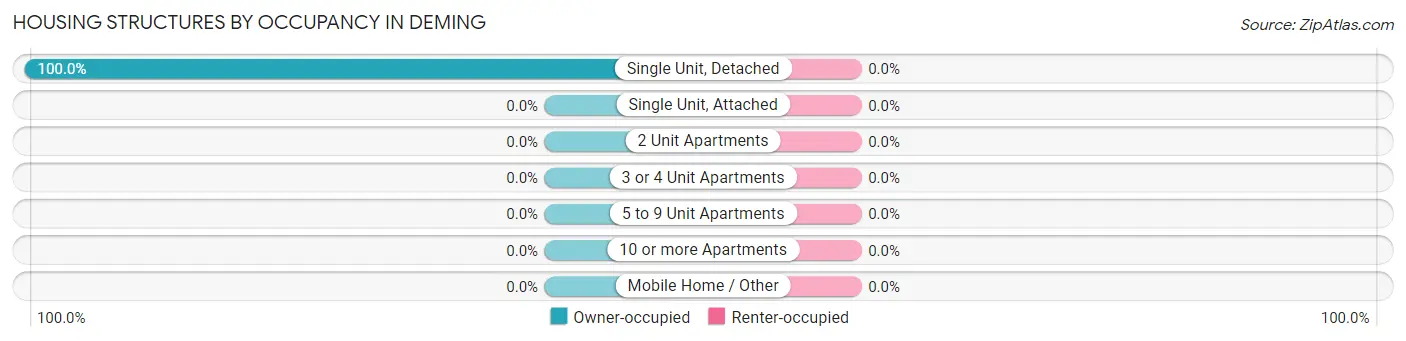
| Structure Type | Owner-occupied | Renter-occupied |
| Single Unit, Detached | 155 (100.0%) | 0 (0.0%) |
| Single Unit, Attached | 0 (0.0%) | 0 (0.0%) |
| 2 Unit Apartments | 0 (0.0%) | 0 (0.0%) |
| 3 or 4 Unit Apartments | 0 (0.0%) | 0 (0.0%) |
| 5 to 9 Unit Apartments | 0 (0.0%) | 0 (0.0%) |
| 10 or more Apartments | 0 (0.0%) | 0 (0.0%) |
| Mobile Home / Other | 0 (0.0%) | 0 (0.0%) |
| Total | 155 (100.0%) | 0 (0.0%) |
Housing Structures by Number of Rooms in Deming
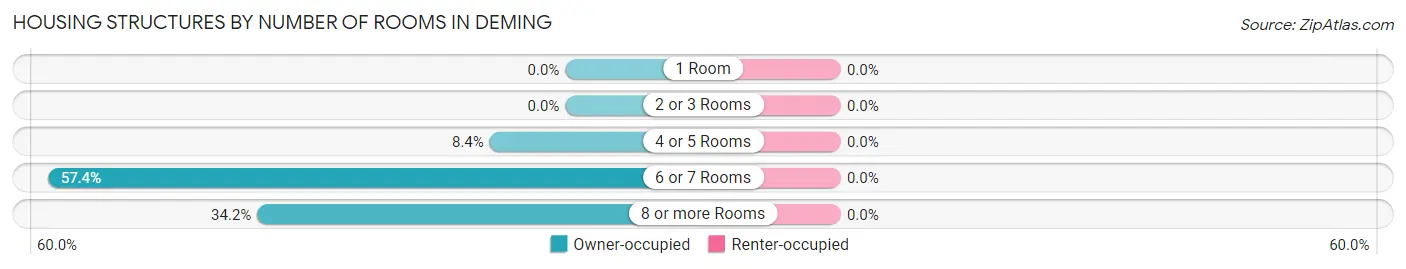
| Number of Rooms | Owner-occupied | Renter-occupied |
| 1 Room | 0 (0.0%) | 0 (0.0%) |
| 2 or 3 Rooms | 0 (0.0%) | 0 (0.0%) |
| 4 or 5 Rooms | 13 (8.4%) | 0 (0.0%) |
| 6 or 7 Rooms | 89 (57.4%) | 0 (0.0%) |
| 8 or more Rooms | 53 (34.2%) | 0 (0.0%) |
| Total | 155 (100.0%) | 0 (0.0%) |
Housing Structure by Heating Type in Deming
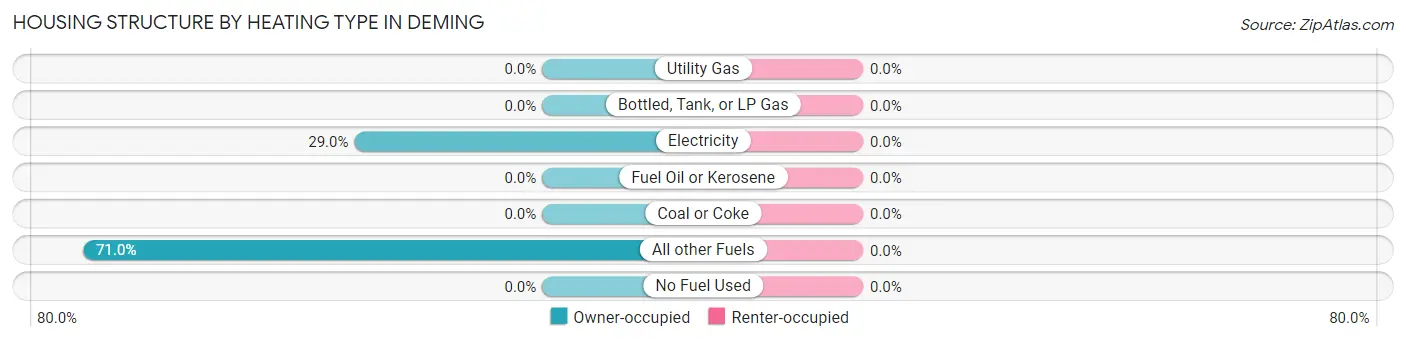
| Heating Type | Owner-occupied | Renter-occupied |
| Utility Gas | 0 (0.0%) | 0 (0.0%) |
| Bottled, Tank, or LP Gas | 0 (0.0%) | 0 (0.0%) |
| Electricity | 45 (29.0%) | 0 (0.0%) |
| Fuel Oil or Kerosene | 0 (0.0%) | 0 (0.0%) |
| Coal or Coke | 0 (0.0%) | 0 (0.0%) |
| All other Fuels | 110 (71.0%) | 0 (0.0%) |
| No Fuel Used | 0 (0.0%) | 0 (0.0%) |
| Total | 155 (100.0%) | 0 (0.0%) |
Household Vehicle Usage in Deming
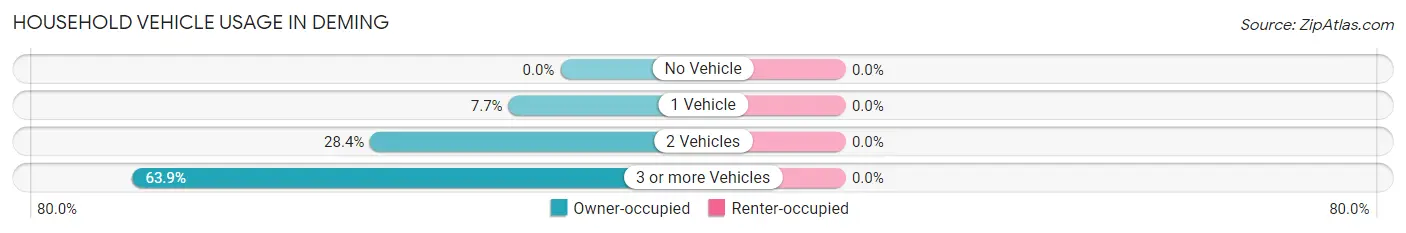
| Vehicles per Household | Owner-occupied | Renter-occupied |
| No Vehicle | 0 (0.0%) | 0 (0.0%) |
| 1 Vehicle | 12 (7.7%) | 0 (0.0%) |
| 2 Vehicles | 44 (28.4%) | 0 (0.0%) |
| 3 or more Vehicles | 99 (63.9%) | 0 (0.0%) |
| Total | 155 (100.0%) | 0 (0.0%) |
Real Estate & Mortgages in Deming
Real Estate and Mortgage Overview in Deming
| Characteristic | Without Mortgage | With Mortgage |
| Housing Units | 1 | 154 |
| Median Property Value | - | - |
| Median Household Income | - | - |
| Monthly Housing Costs | - | - |
| Real Estate Taxes | - | - |
Property Value by Mortgage Status in Deming
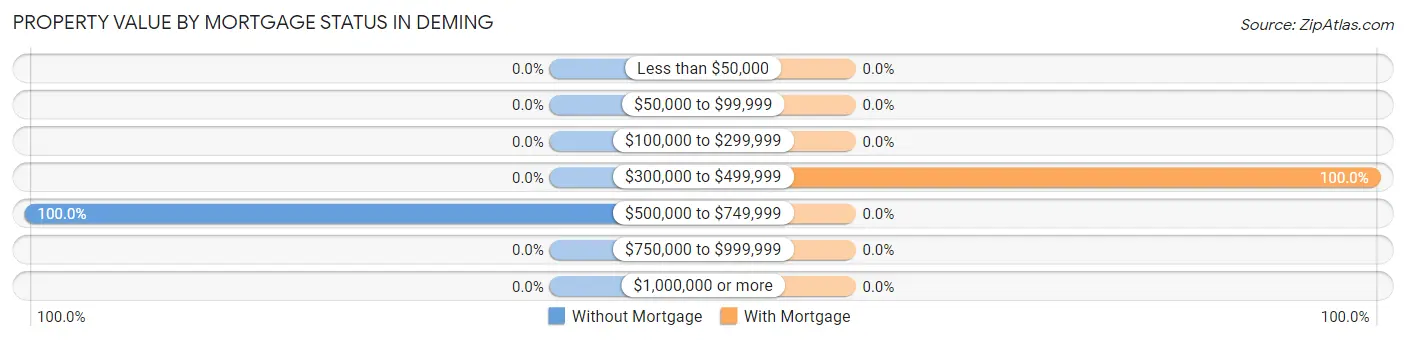
| Property Value | Without Mortgage | With Mortgage |
| Less than $50,000 | 0 (0.0%) | 0 (0.0%) |
| $50,000 to $99,999 | 0 (0.0%) | 0 (0.0%) |
| $100,000 to $299,999 | 0 (0.0%) | 0 (0.0%) |
| $300,000 to $499,999 | 0 (0.0%) | 154 (100.0%) |
| $500,000 to $749,999 | 1 (100.0%) | 0 (0.0%) |
| $750,000 to $999,999 | 0 (0.0%) | 0 (0.0%) |
| $1,000,000 or more | 0 (0.0%) | 0 (0.0%) |
| Total | 1 (100.0%) | 154 (100.0%) |
Household Income by Mortgage Status in Deming
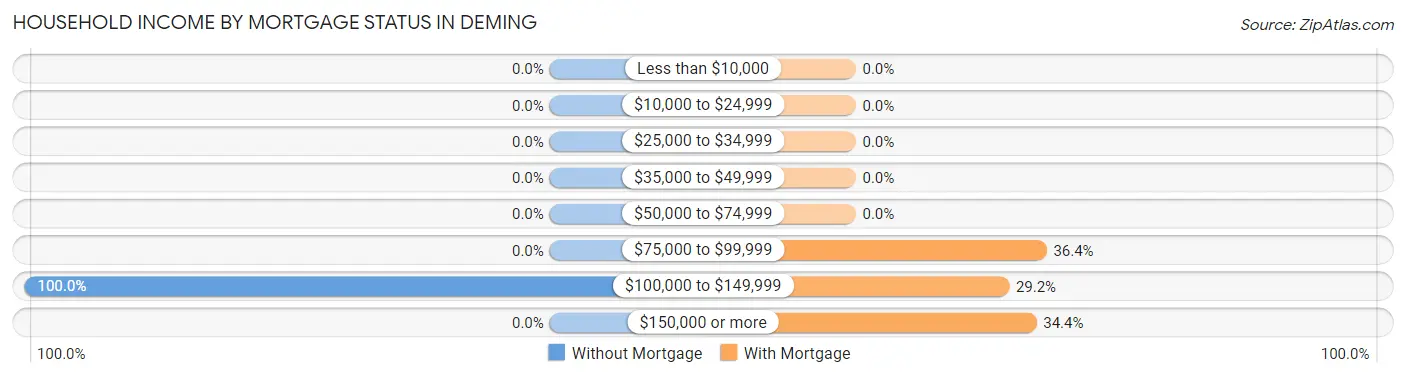
| Household Income | Without Mortgage | With Mortgage |
| Less than $10,000 | 0 (0.0%) | 0 (0.0%) |
| $10,000 to $24,999 | 0 (0.0%) | 0 (0.0%) |
| $25,000 to $34,999 | 0 (0.0%) | 0 (0.0%) |
| $35,000 to $49,999 | 0 (0.0%) | 0 (0.0%) |
| $50,000 to $74,999 | 0 (0.0%) | 0 (0.0%) |
| $75,000 to $99,999 | 0 (0.0%) | 56 (36.4%) |
| $100,000 to $149,999 | 1 (100.0%) | 45 (29.2%) |
| $150,000 or more | 0 (0.0%) | 53 (34.4%) |
| Total | 1 (100.0%) | 154 (100.0%) |
Property Value to Household Income Ratio in Deming
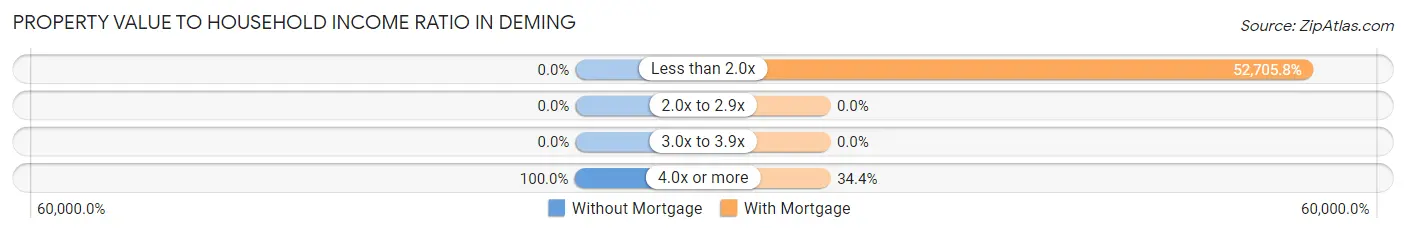
| Value-to-Income Ratio | Without Mortgage | With Mortgage |
| Less than 2.0x | 0 (0.0%) | 81,167 (52,705.8%) |
| 2.0x to 2.9x | 0 (0.0%) | 0 (0.0%) |
| 3.0x to 3.9x | 0 (0.0%) | 0 (0.0%) |
| 4.0x or more | 1 (100.0%) | 53 (34.4%) |
| Total | 1 (100.0%) | 154 (100.0%) |
Real Estate Taxes by Mortgage Status in Deming
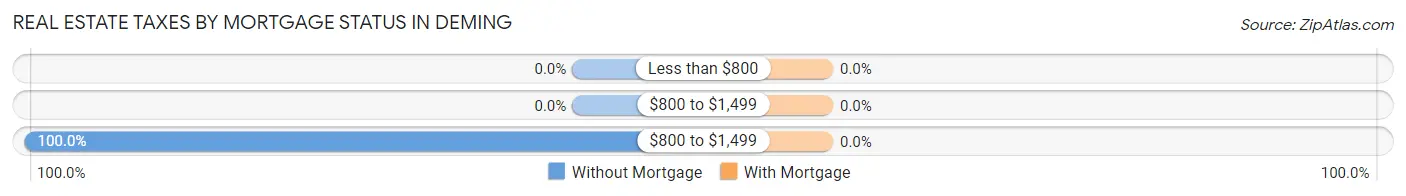
| Property Taxes | Without Mortgage | With Mortgage |
| Less than $800 | 0 (0.0%) | 0 (0.0%) |
| $800 to $1,499 | 0 (0.0%) | 0 (0.0%) |
| $800 to $1,499 | 1 (100.0%) | 0 (0.0%) |
| Total | 1 (100.0%) | 154 (100.0%) |
Health & Disability in Deming
Health Insurance Coverage by Age in Deming
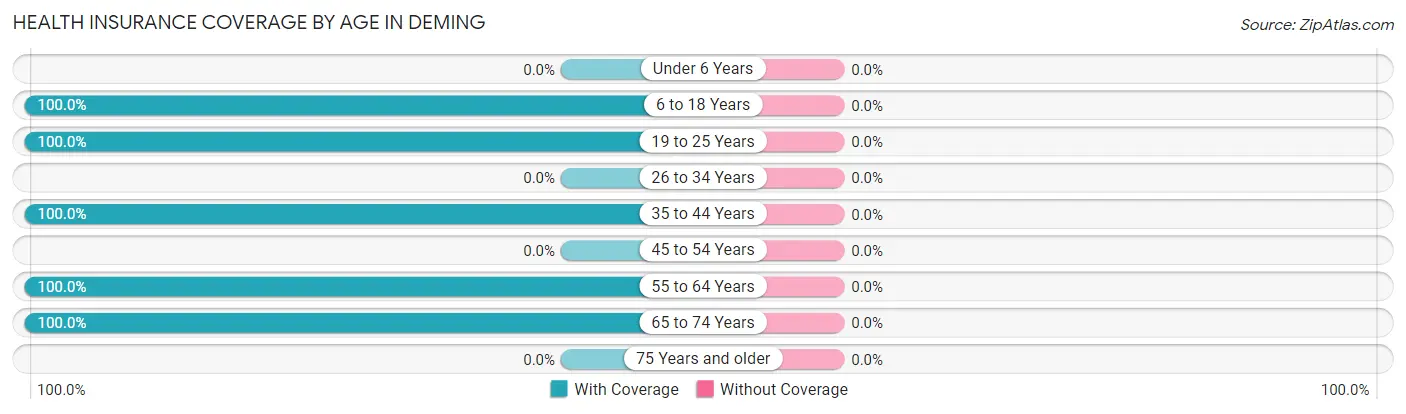
| Age Bracket | With Coverage | Without Coverage |
| Under 6 Years | 0 (0.0%) | 0 (0.0%) |
| 6 to 18 Years | 138 (100.0%) | 0 (0.0%) |
| 19 to 25 Years | 87 (100.0%) | 0 (0.0%) |
| 26 to 34 Years | 0 (0.0%) | 0 (0.0%) |
| 35 to 44 Years | 45 (100.0%) | 0 (0.0%) |
| 45 to 54 Years | 0 (0.0%) | 0 (0.0%) |
| 55 to 64 Years | 156 (100.0%) | 0 (0.0%) |
| 65 to 74 Years | 1 (100.0%) | 0 (0.0%) |
| 75 Years and older | 0 (0.0%) | 0 (0.0%) |
| Total | 427 (100.0%) | 0 (0.0%) |
Health Insurance Coverage by Citizenship Status in Deming
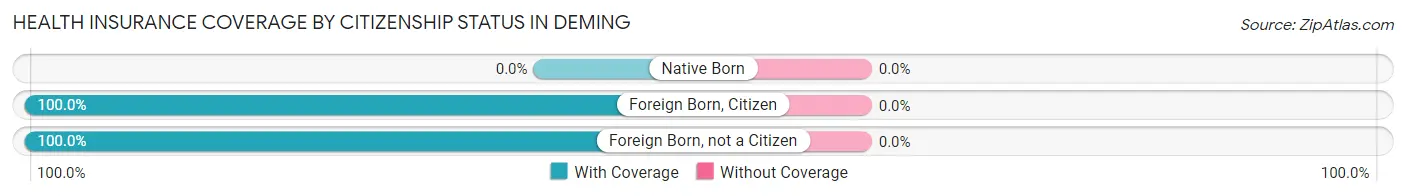
| Citizenship Status | With Coverage | Without Coverage |
| Native Born | 0 (0.0%) | 0 (0.0%) |
| Foreign Born, Citizen | 138 (100.0%) | 0 (0.0%) |
| Foreign Born, not a Citizen | 87 (100.0%) | 0 (0.0%) |
Health Insurance Coverage by Household Income in Deming
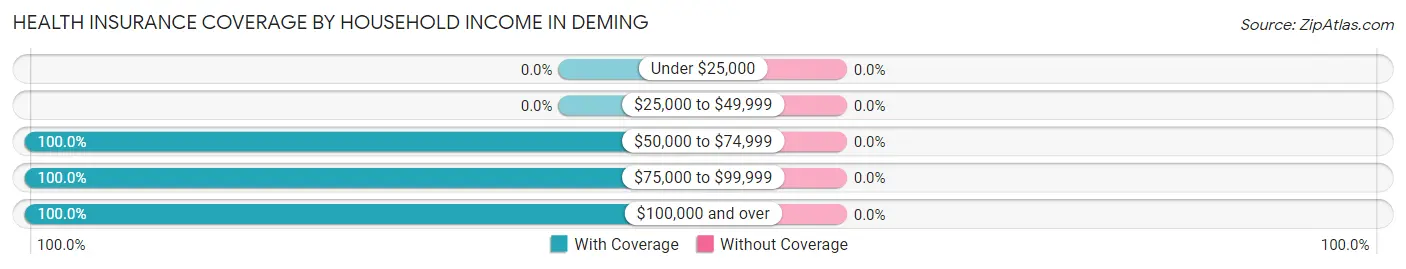
| Household Income | With Coverage | Without Coverage |
| Under $25,000 | 0 (0.0%) | 0 (0.0%) |
| $25,000 to $49,999 | 0 (0.0%) | 0 (0.0%) |
| $50,000 to $74,999 | 56 (100.0%) | 0 (0.0%) |
| $75,000 to $99,999 | 45 (100.0%) | 0 (0.0%) |
| $100,000 and over | 326 (100.0%) | 0 (0.0%) |
Public vs Private Health Insurance Coverage by Age in Deming
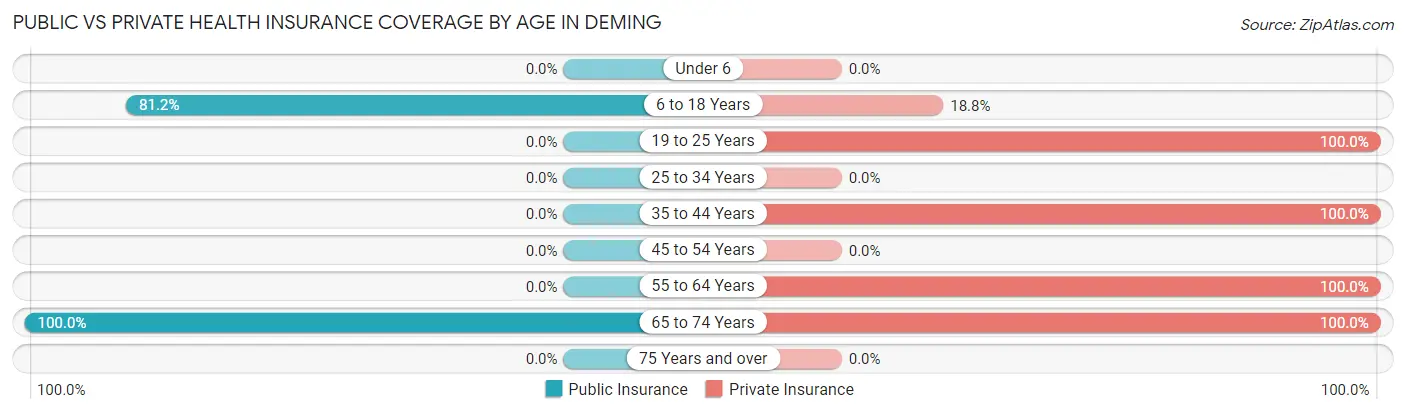
| Age Bracket | Public Insurance | Private Insurance |
| Under 6 | 0 (0.0%) | 0 (0.0%) |
| 6 to 18 Years | 112 (81.2%) | 26 (18.8%) |
| 19 to 25 Years | 0 (0.0%) | 87 (100.0%) |
| 25 to 34 Years | 0 (0.0%) | 0 (0.0%) |
| 35 to 44 Years | 0 (0.0%) | 45 (100.0%) |
| 45 to 54 Years | 0 (0.0%) | 0 (0.0%) |
| 55 to 64 Years | 0 (0.0%) | 156 (100.0%) |
| 65 to 74 Years | 1 (100.0%) | 1 (100.0%) |
| 75 Years and over | 0 (0.0%) | 0 (0.0%) |
| Total | 113 (26.5%) | 315 (73.8%) |
Disability Status by Sex by Age in Deming
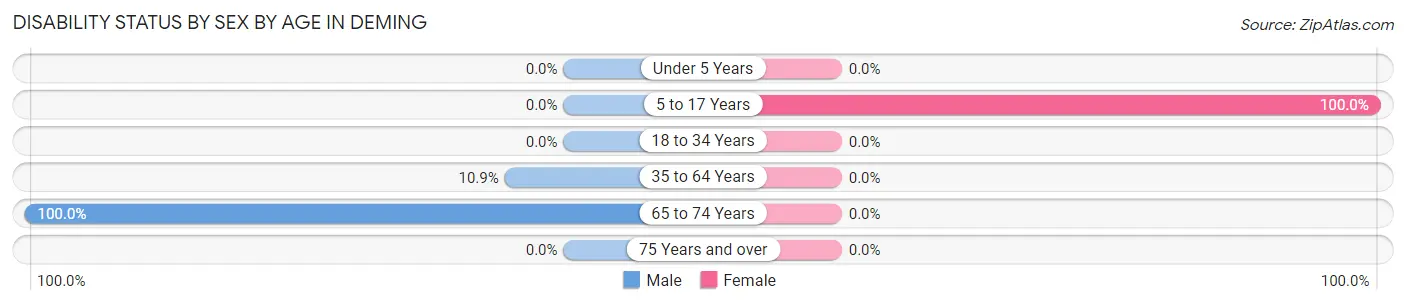
| Age Bracket | Male | Female |
| Under 5 Years | 0 (0.0%) | 0 (0.0%) |
| 5 to 17 Years | 0 (0.0%) | 55 (100.0%) |
| 18 to 34 Years | 0 (0.0%) | 0 (0.0%) |
| 35 to 64 Years | 12 (10.9%) | 0 (0.0%) |
| 65 to 74 Years | 1 (100.0%) | 0 (0.0%) |
| 75 Years and over | 0 (0.0%) | 0 (0.0%) |
Disability Class by Sex by Age in Deming
Disability Class: Hearing Difficulty
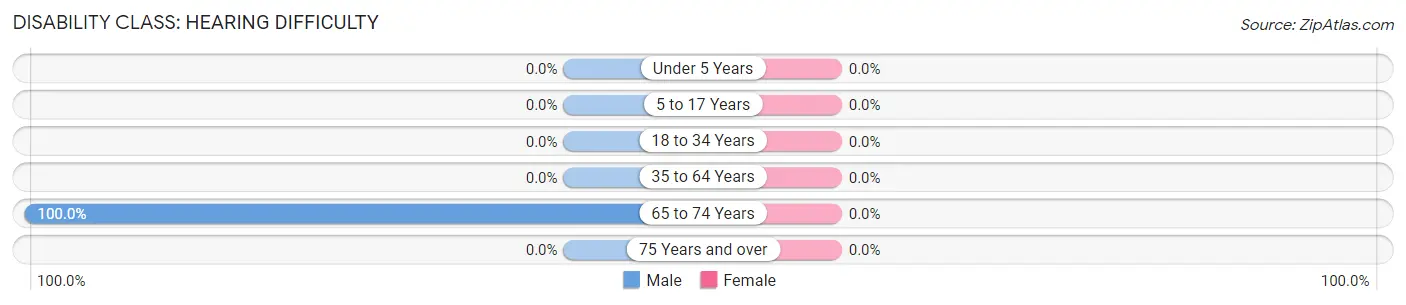
| Age Bracket | Male | Female |
| Under 5 Years | 0 (0.0%) | 0 (0.0%) |
| 5 to 17 Years | 0 (0.0%) | 0 (0.0%) |
| 18 to 34 Years | 0 (0.0%) | 0 (0.0%) |
| 35 to 64 Years | 0 (0.0%) | 0 (0.0%) |
| 65 to 74 Years | 1 (100.0%) | 0 (0.0%) |
| 75 Years and over | 0 (0.0%) | 0 (0.0%) |
Disability Class: Vision Difficulty
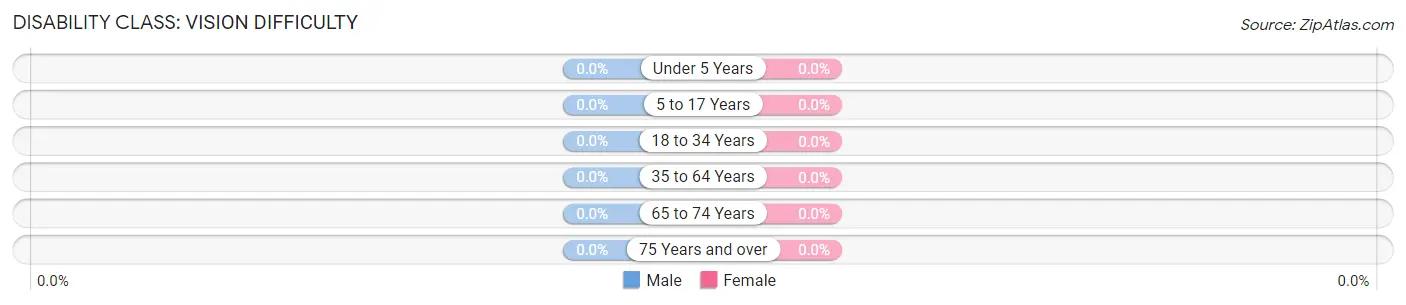
| Age Bracket | Male | Female |
| Under 5 Years | 0 (0.0%) | 0 (0.0%) |
| 5 to 17 Years | 0 (0.0%) | 0 (0.0%) |
| 18 to 34 Years | 0 (0.0%) | 0 (0.0%) |
| 35 to 64 Years | 0 (0.0%) | 0 (0.0%) |
| 65 to 74 Years | 0 (0.0%) | 0 (0.0%) |
| 75 Years and over | 0 (0.0%) | 0 (0.0%) |
Disability Class: Cognitive Difficulty
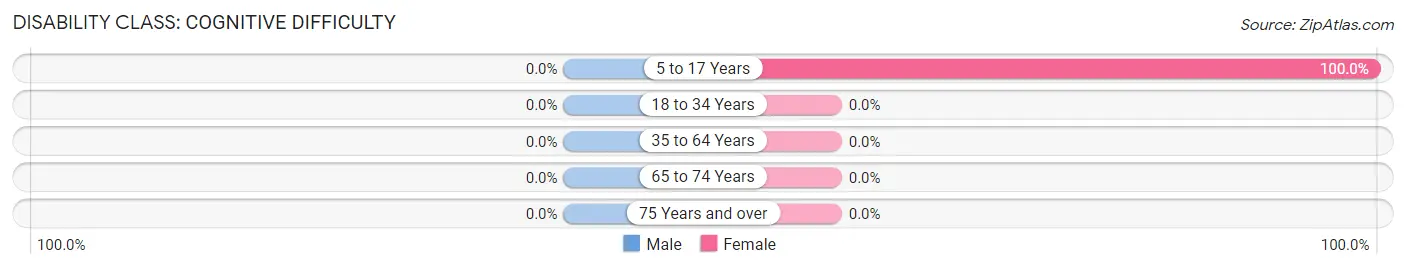
| Age Bracket | Male | Female |
| 5 to 17 Years | 0 (0.0%) | 55 (100.0%) |
| 18 to 34 Years | 0 (0.0%) | 0 (0.0%) |
| 35 to 64 Years | 0 (0.0%) | 0 (0.0%) |
| 65 to 74 Years | 0 (0.0%) | 0 (0.0%) |
| 75 Years and over | 0 (0.0%) | 0 (0.0%) |
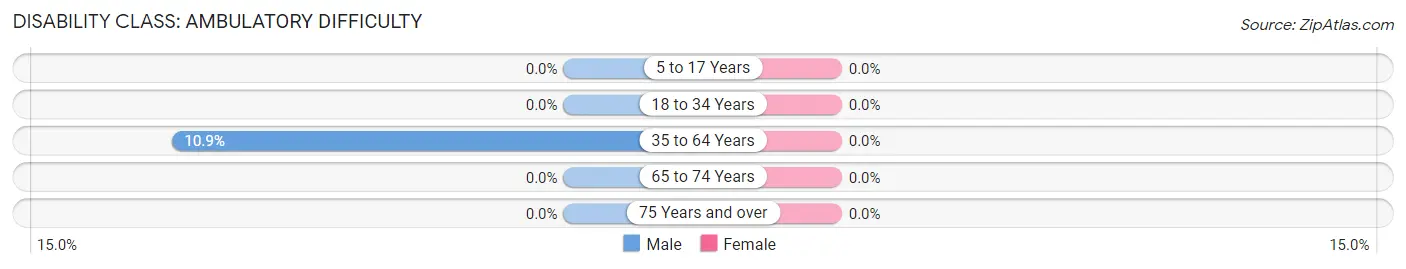
Disability Class: Ambulatory Difficulty
| Age Bracket | Male | Female |
| 5 to 17 Years | 0 (0.0%) | 0 (0.0%) |
| 18 to 34 Years | 0 (0.0%) | 0 (0.0%) |
| 35 to 64 Years | 12 (10.9%) | 0 (0.0%) |
| 65 to 74 Years | 0 (0.0%) | 0 (0.0%) |
| 75 Years and over | 0 (0.0%) | 0 (0.0%) |
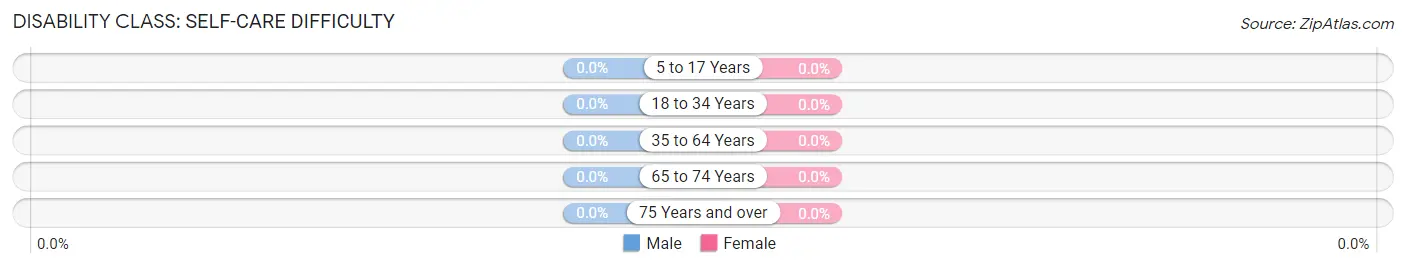
Disability Class: Self-Care Difficulty
| Age Bracket | Male | Female |
| 5 to 17 Years | 0 (0.0%) | 0 (0.0%) |
| 18 to 34 Years | 0 (0.0%) | 0 (0.0%) |
| 35 to 64 Years | 0 (0.0%) | 0 (0.0%) |
| 65 to 74 Years | 0 (0.0%) | 0 (0.0%) |
| 75 Years and over | 0 (0.0%) | 0 (0.0%) |
Technology Access in Deming
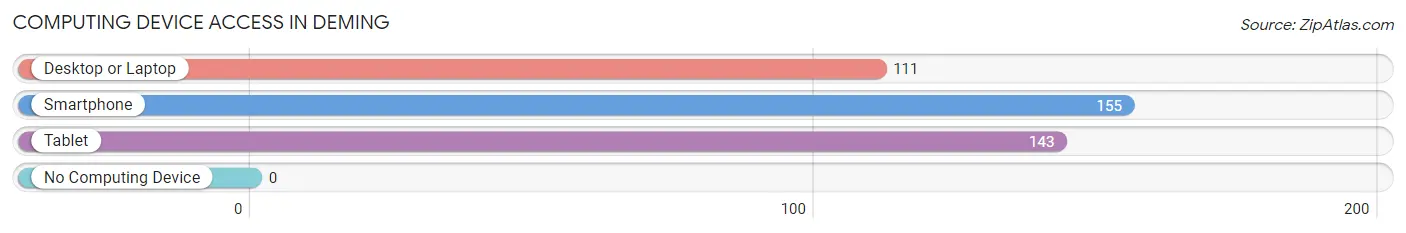
Computing Device Access in Deming
| Device Type | # Households | % Households |
| Desktop or Laptop | 111 | 71.6% |
| Smartphone | 155 | 100.0% |
| Tablet | 143 | 92.3% |
| No Computing Device | 0 | 0.0% |
| Total | 155 | 100.0% |
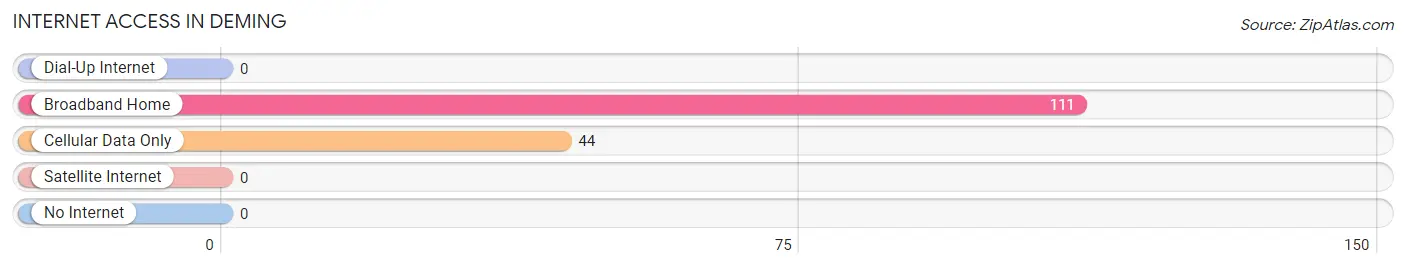
Internet Access in Deming
| Internet Type | # Households | % Households |
| Dial-Up Internet | 0 | 0.0% |
| Broadband Home | 111 | 71.6% |
| Cellular Data Only | 44 | 28.4% |
| Satellite Internet | 0 | 0.0% |
| No Internet | 0 | 0.0% |
| Total | 155 | 100.0% |
Deming Summary
Deming, Washington is a small unincorporated community located in Whatcom County, Washington. It is situated on the banks of the Nooksack River, approximately 10 miles east of Bellingham. The population of Deming was estimated to be 1,092 in 2019.
History
Deming was first settled in the late 1800s by a group of settlers from the Midwest. The town was named after the nearby Deming Mountain, which was named after a local Native American chief. The first post office in Deming was established in 1891.
In the early 1900s, the town was a logging and farming community. The logging industry was the main source of income for the town, and the lumber was used to build homes and businesses in the area. The town also had a sawmill, a general store, and a hotel.
In the 1920s, the town began to experience a decline in population due to the Great Depression. The population decreased from 1,000 in 1920 to just over 500 in 1930.
In the 1940s, the town experienced a resurgence in population due to the construction of the nearby Grand Coulee Dam. The dam provided jobs for many of the town’s residents, and the population increased to over 1,000 by 1950.
Geography
Deming is located in the northwest corner of Whatcom County, Washington. It is situated on the banks of the Nooksack River, approximately 10 miles east of Bellingham. The town is surrounded by the Cascade Mountains to the east and the Olympic Mountains to the west.
The climate in Deming is mild and temperate, with warm summers and cool winters. The average annual temperature is around 50 degrees Fahrenheit. The average annual precipitation is around 40 inches.
Economy
Deming’s economy is largely based on agriculture and tourism. The town is home to several farms, which produce a variety of fruits and vegetables. The town also has several wineries and breweries, which attract tourists from all over the region.
Deming is also home to several small businesses, including restaurants, shops, and services. The town also has a few manufacturing companies, which produce a variety of products.
Demographics
As of 2019, the population of Deming was estimated to be 1,092. The population is predominantly white (90.2%), with the remaining population being made up of Hispanic (4.2%), Asian (2.2%), and African American (1.2%) residents.
The median household income in Deming is $50,945, which is slightly lower than the national average of $57,652. The median home value in Deming is $269,400, which is slightly higher than the national average of $231,200.
Conclusion
Deming, Washington is a small unincorporated community located in Whatcom County, Washington. It is situated on the banks of the Nooksack River, approximately 10 miles east of Bellingham. The population of Deming was estimated to be 1,092 in 2019. The town’s economy is largely based on agriculture and tourism, and the population is predominantly white. The median household income in Deming is $50,945, and the median home value is $269,400.
Common Questions
What is Per Capita Income in Deming?
Per Capita income in Deming is $28,552.
What is the Median Household income in Deming?
Median Household Income in Deming is $81,194.
What is Inequality or Gini Index in Deming?
Inequality or Gini Index in Deming is 0.17.
What is the Total Population of Deming?
Total Population of Deming is 427.
What is the Total Male Population of Deming?
Total Male Population of Deming is 281.
What is the Total Female Population of Deming?
Total Female Population of Deming is 146.
What is the Ratio of Males per 100 Females in Deming?
There are 192.47 Males per 100 Females in Deming.
What is the Ratio of Females per 100 Males in Deming?
There are 51.96 Females per 100 Males in Deming.
What is the Median Population Age in Deming?
Median Population Age in Deming is 23.9 Years.
What is the Average Family Size in Deming
Average Family Size in Deming is 3.9 People.
What is the Average Household Size in Deming
Average Household Size in Deming is 2.8 People.
How Large is the Labor Force in Deming?
There are 181 People in the Labor Forcein in Deming.
What is the Percentage of People in the Labor Force in Deming?
57.5% of People are in the Labor Force in Deming.
What is the Unemployment Rate in Deming?
Unemployment Rate in Deming is 29.3%.