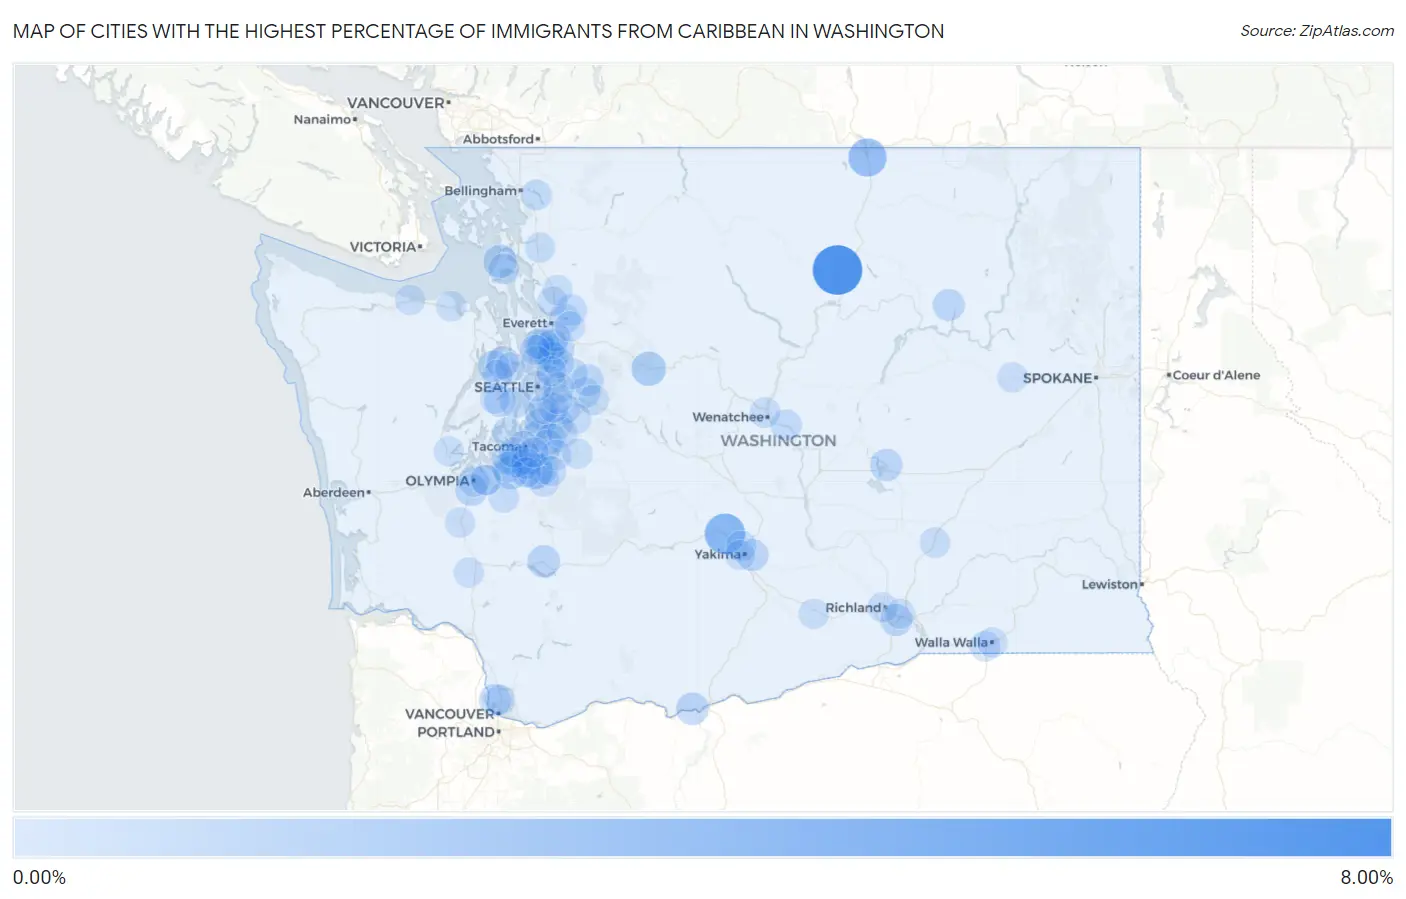
Cities with the Highest Percentage of Immigrants from Caribbean in Washington
RELATED REPORTS & OPTIONS
Caribbean
Washington
Compare Cities
Map of Cities with the Highest Percentage of Immigrants from Caribbean in Washington
0.00%
8.00%
Cities with the Highest Percentage of Immigrants from Caribbean in Washington
| City | Caribbean | vs State | vs National | |
| 1. | Clear Lake Cdp Pierce County | 7.95% | 0.16%(+7.79)#-1 | 1.37%(+6.58)#0 |
| 2. | Malott | 7.77% | 0.16%(+7.60)#0 | 1.37%(+6.39)#1 |
| 3. | Naches | 4.05% | 0.16%(+3.89)#1 | 1.37%(+2.68)#2 |
| 4. | Oroville | 3.14% | 0.16%(+2.97)#2 | 1.37%(+1.77)#3 |
| 5. | Frederickson | 2.18% | 0.16%(+2.01)#3 | 1.37%(+0.806)#4 |
| 6. | Skykomish | 1.72% | 0.16%(+1.56)#4 | 1.37%(+0.352)#5 |
| 7. | Fort Lewis | 1.35% | 0.16%(+1.19)#5 | 1.37%(-0.018)#6 |
| 8. | Whidbey Island Station | 1.29% | 0.16%(+1.13)#6 | 1.37%(-0.083)#7 |
| 9. | Poulsbo | 1.01% | 0.16%(+0.851)#7 | 1.37%(-0.358)#8 |
| 10. | Wishram | 1.00% | 0.16%(+0.832)#8 | 1.37%(-0.376)#9 |
| 11. | Morton | 0.98% | 0.16%(+0.811)#9 | 1.37%(-0.397)#10 |
| 12. | Lakewood | 0.92% | 0.16%(+0.759)#105 | 1.37%(-0.449)#2,052 |
| 13. | Moses Lake | 0.90% | 0.16%(+0.738)#106 | 1.37%(-0.470)#2,053 |
| 14. | Felida | 0.86% | 0.16%(+0.691)#107 | 1.37%(-0.517)#2,054 |
| 15. | Terrace Heights | 0.83% | 0.16%(+0.664)#108 | 1.37%(-0.544)#2,055 |
| 16. | Midland | 0.81% | 0.16%(+0.651)#109 | 1.37%(-0.558)#2,056 |
| 17. | Keller | 0.78% | 0.16%(+0.617)#110 | 1.37%(-0.591)#2,057 |
| 18. | Tumwater | 0.76% | 0.16%(+0.597)#111 | 1.37%(-0.611)#2,058 |
| 19. | Kennewick | 0.75% | 0.16%(+0.589)#112 | 1.37%(-0.620)#2,059 |
| 20. | Carnation | 0.72% | 0.16%(+0.551)#113 | 1.37%(-0.657)#2,060 |
| 21. | Clearview | 0.66% | 0.16%(+0.500)#114 | 1.37%(-0.708)#2,061 |
| 22. | Seatac | 0.66% | 0.16%(+0.499)#115 | 1.37%(-0.710)#2,062 |
| 23. | Bangor Base | 0.61% | 0.16%(+0.448)#116 | 1.37%(-0.760)#2,063 |
| 24. | Port Orchard | 0.60% | 0.16%(+0.436)#117 | 1.37%(-0.772)#2,064 |
| 25. | North Lynnwood | 0.57% | 0.16%(+0.409)#118 | 1.37%(-0.799)#2,065 |
| 26. | Federal Way | 0.55% | 0.16%(+0.389)#119 | 1.37%(-0.819)#2,066 |
| 27. | Steilacoom | 0.54% | 0.16%(+0.375)#120 | 1.37%(-0.834)#2,067 |
| 28. | Lochsloy | 0.52% | 0.16%(+0.358)#121 | 1.37%(-0.850)#2,068 |
| 29. | Rock Island | 0.48% | 0.16%(+0.312)#122 | 1.37%(-0.896)#2,069 |
| 30. | Bothell West | 0.45% | 0.16%(+0.284)#123 | 1.37%(-0.924)#2,070 |
| 31. | Southworth | 0.41% | 0.16%(+0.245)#124 | 1.37%(-0.963)#2,071 |
| 32. | Olympia | 0.41% | 0.16%(+0.244)#125 | 1.37%(-0.964)#2,105 |
| 33. | Fairwood Cdp King County | 0.40% | 0.16%(+0.233)#126 | 1.37%(-0.975)#2,106 |
| 34. | North Fort Lewis | 0.38% | 0.16%(+0.218)#127 | 1.37%(-0.991)#2,107 |
| 35. | Lynnwood | 0.38% | 0.16%(+0.217)#128 | 1.37%(-0.991)#2,108 |
| 36. | Selah | 0.37% | 0.16%(+0.201)#129 | 1.37%(-1.01)#2,109 |
| 37. | Sudden Valley | 0.35% | 0.16%(+0.188)#130 | 1.37%(-1.02)#2,110 |
| 38. | Fall City | 0.35% | 0.16%(+0.183)#131 | 1.37%(-1.03)#2,111 |
| 39. | Oak Harbor | 0.34% | 0.16%(+0.179)#132 | 1.37%(-1.03)#2,112 |
| 40. | Bothell | 0.34% | 0.16%(+0.178)#133 | 1.37%(-1.03)#2,113 |
| 41. | Union Hill Novelty Hill | 0.33% | 0.16%(+0.168)#134 | 1.37%(-1.04)#2,114 |
| 42. | Des Moines | 0.33% | 0.16%(+0.166)#135 | 1.37%(-1.04)#2,371 |
| 43. | Lacey | 0.33% | 0.16%(+0.166)#136 | 1.37%(-1.04)#2,372 |
| 44. | Kent | 0.32% | 0.16%(+0.158)#137 | 1.37%(-1.05)#2,373 |
| 45. | Clyde Hill | 0.32% | 0.16%(+0.158)#138 | 1.37%(-1.05)#2,374 |
| 46. | Woodinville | 0.30% | 0.16%(+0.136)#139 | 1.37%(-1.07)#2,375 |
| 47. | South Hill | 0.30% | 0.16%(+0.135)#140 | 1.37%(-1.07)#2,376 |
| 48. | Wenatchee | 0.29% | 0.16%(+0.130)#141 | 1.37%(-1.08)#2,377 |
| 49. | Salmon Creek | 0.29% | 0.16%(+0.121)#142 | 1.37%(-1.09)#2,378 |
| 50. | Pacific | 0.28% | 0.16%(+0.118)#143 | 1.37%(-1.09)#2,379 |
| 51. | Tacoma | 0.27% | 0.16%(+0.107)#144 | 1.37%(-1.10)#2,380 |
| 52. | Clear Lake Cdp Skagit County | 0.27% | 0.16%(+0.103)#145 | 1.37%(-1.10)#2,381 |
| 53. | Graham | 0.27% | 0.16%(+0.103)#146 | 1.37%(-1.11)#2,382 |
| 54. | Meadowdale | 0.27% | 0.16%(+0.103)#147 | 1.37%(-1.11)#2,383 |
| 55. | College Place | 0.27% | 0.16%(+0.101)#148 | 1.37%(-1.11)#2,384 |
| 56. | Lake Stevens | 0.27% | 0.16%(+0.101)#149 | 1.37%(-1.11)#2,385 |
| 57. | Auburn | 0.25% | 0.16%(+0.088)#150 | 1.37%(-1.12)#2,386 |
| 58. | Connell | 0.25% | 0.16%(+0.087)#151 | 1.37%(-1.12)#2,387 |
| 59. | Snoqualmie | 0.24% | 0.16%(+0.076)#152 | 1.37%(-1.13)#2,388 |
| 60. | Eastmont | 0.24% | 0.16%(+0.073)#153 | 1.37%(-1.14)#2,389 |
| 61. | Bellevue | 0.24% | 0.16%(+0.071)#154 | 1.37%(-1.14)#2,390 |
| 62. | Hobart | 0.22% | 0.16%(+0.059)#155 | 1.37%(-1.15)#2,391 |
| 63. | East Renton Highlands | 0.22% | 0.16%(+0.059)#156 | 1.37%(-1.15)#2,392 |
| 64. | Yelm | 0.22% | 0.16%(+0.056)#157 | 1.37%(-1.15)#2,393 |
| 65. | Gig Harbor | 0.22% | 0.16%(+0.054)#158 | 1.37%(-1.15)#2,394 |
| 66. | Lake Morton Berrydale | 0.21% | 0.16%(+0.046)#159 | 1.37%(-1.16)#2,395 |
| 67. | Bonney Lake | 0.20% | 0.16%(+0.039)#160 | 1.37%(-1.17)#2,396 |
| 68. | Mount Vernon | 0.20% | 0.16%(+0.038)#161 | 1.37%(-1.17)#2,397 |
| 69. | Parkland | 0.20% | 0.16%(+0.034)#162 | 1.37%(-1.17)#2,398 |
| 70. | Shoreline | 0.19% | 0.16%(+0.022)#163 | 1.37%(-1.19)#2,399 |
| 71. | Mill Creek | 0.18% | 0.16%(+0.018)#164 | 1.37%(-1.19)#2,400 |
| 72. | Tukwila | 0.18% | 0.16%(+0.012)#165 | 1.37%(-1.20)#2,401 |
| 73. | Sequim | 0.17% | 0.16%(+0.009)#166 | 1.37%(-1.20)#2,402 |
| 74. | University Place | 0.16% | 0.16%(+0.000)#167 | 1.37%(-1.21)#2,403 |
| 75. | Renton | 0.16% | 0.16%(-0.001)#168 | 1.37%(-1.21)#2,404 |
| 76. | Newcastle | 0.16% | 0.16%(-0.002)#169 | 1.37%(-1.21)#2,405 |
| 77. | Davenport | 0.16% | 0.16%(-0.002)#170 | 1.37%(-1.21)#2,406 |
| 78. | Seattle | 0.16% | 0.16%(-0.002)#171 | 1.37%(-1.21)#2,407 |
| 79. | Arlington | 0.16% | 0.16%(-0.006)#172 | 1.37%(-1.21)#2,408 |
| 80. | Richland | 0.16% | 0.16%(-0.007)#173 | 1.37%(-1.21)#2,409 |
| 81. | Tanglewilde | 0.16% | 0.16%(-0.008)#174 | 1.37%(-1.22)#2,410 |
| 82. | Winlock | 0.15% | 0.16%(-0.011)#175 | 1.37%(-1.22)#2,411 |
| 83. | Enumclaw | 0.15% | 0.16%(-0.014)#176 | 1.37%(-1.22)#2,412 |
| 84. | Silverdale | 0.15% | 0.16%(-0.017)#177 | 1.37%(-1.23)#2,413 |
| 85. | Grand Mound | 0.15% | 0.16%(-0.019)#178 | 1.37%(-1.23)#2,414 |
| 86. | Port Angeles | 0.13% | 0.16%(-0.029)#179 | 1.37%(-1.24)#2,415 |
| 87. | Bremerton | 0.13% | 0.16%(-0.035)#180 | 1.37%(-1.24)#2,416 |
| 88. | Yakima | 0.12% | 0.16%(-0.046)#181 | 1.37%(-1.25)#2,417 |
| 89. | Shelton | 0.11% | 0.16%(-0.050)#182 | 1.37%(-1.26)#2,418 |
| 90. | Everett | 0.11% | 0.16%(-0.057)#183 | 1.37%(-1.27)#2,419 |
| 91. | Orting | 0.10% | 0.16%(-0.063)#184 | 1.37%(-1.27)#2,420 |
| 92. | Walla Walla | 0.095% | 0.16%(-0.070)#185 | 1.37%(-1.28)#2,421 |
| 93. | Spanaway | 0.094% | 0.16%(-0.070)#186 | 1.37%(-1.28)#2,422 |
| 94. | Pasco | 0.093% | 0.16%(-0.071)#187 | 1.37%(-1.28)#2,423 |
| 95. | Suquamish | 0.092% | 0.16%(-0.072)#188 | 1.37%(-1.28)#2,424 |
| 96. | Grandview | 0.092% | 0.16%(-0.073)#189 | 1.37%(-1.28)#2,425 |
| 97. | Marysville | 0.089% | 0.16%(-0.075)#190 | 1.37%(-1.28)#2,426 |
| 98. | Waller | 0.088% | 0.16%(-0.077)#191 | 1.37%(-1.28)#2,427 |
| 99. | Kirkland | 0.083% | 0.16%(-0.082)#192 | 1.37%(-1.29)#2,428 |
| 100. | Edmonds | 0.082% | 0.16%(-0.082)#193 | 1.37%(-1.29)#2,429 |
Common Questions
What are the Top 10 Cities with the Highest Percentage of Immigrants from Caribbean in Washington?
Top 10 Cities with the Highest Percentage of Immigrants from Caribbean in Washington are:
#1
7.77%
#2
4.05%
#3
3.14%
#4
2.18%
#5
1.72%
#6
1.35%
#7
1.29%
#8
1.01%
#9
1.00%
#10
0.98%
What city has the Highest Percentage of Immigrants from Caribbean in Washington?
Malott has the Highest Percentage of Immigrants from Caribbean in Washington with 7.77%.
What is the Percentage of Immigrants from Caribbean in the State of Washington?
Percentage of Immigrants from Caribbean in Washington is 0.16%.
What is the Percentage of Immigrants from Caribbean in the United States?
Percentage of Immigrants from Caribbean in the United States is 1.37%.