Cities with the Highest Percentage of Immigrants from Turkey in Washington
RELATED REPORTS & OPTIONS
Turkey
Washington
Compare Cities
Map of Cities with the Highest Percentage of Immigrants from Turkey in Washington
0.00%
80.00%
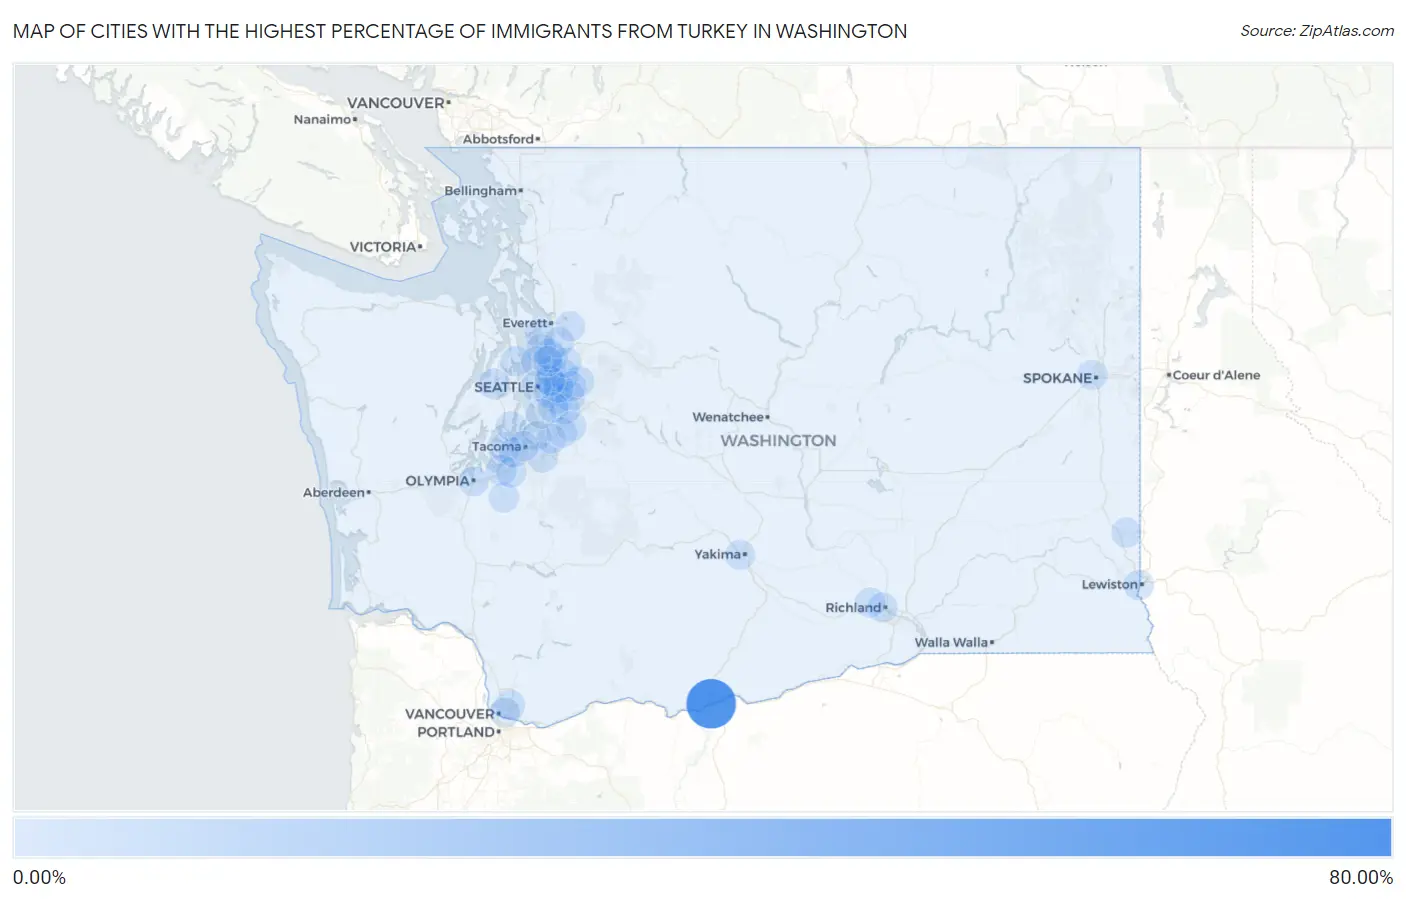
Cities with the Highest Percentage of Immigrants from Turkey in Washington
| City | Turkey | vs State | vs National | |
| 1. | Maryhill | 62.16% | 0.039%(+62.1)#-1 | 0.042%(+62.1)#0 |
| 2. | Ames Lake | 1.62% | 0.039%(+1.59)#0 | 0.042%(+1.58)#1 |
| 3. | Chico | 1.53% | 0.039%(+1.49)#1 | 0.042%(+1.49)#2 |
| 4. | Dupont | 1.29% | 0.039%(+1.25)#2 | 0.042%(+1.24)#3 |
| 5. | Clarkston | 0.64% | 0.039%(+0.598)#3 | 0.042%(+0.595)#4 |
| 6. | Fox Island | 0.55% | 0.039%(+0.510)#4 | 0.042%(+0.506)#5 |
| 7. | Redmond | 0.55% | 0.039%(+0.509)#15 | 0.042%(+0.506)#756 |
| 8. | Newcastle | 0.53% | 0.039%(+0.487)#16 | 0.042%(+0.483)#757 |
| 9. | Mercer Island | 0.51% | 0.039%(+0.468)#37 | 0.042%(+0.464)#1,464 |
| 10. | Yelm | 0.47% | 0.039%(+0.431)#38 | 0.042%(+0.427)#1,465 |
| 11. | Puyallup | 0.39% | 0.039%(+0.349)#39 | 0.042%(+0.345)#1,466 |
| 12. | Kirkland | 0.26% | 0.039%(+0.225)#40 | 0.042%(+0.222)#1,467 |
| 13. | Issaquah | 0.26% | 0.039%(+0.220)#41 | 0.042%(+0.216)#1,468 |
| 14. | East Renton Highlands | 0.22% | 0.039%(+0.185)#42 | 0.042%(+0.181)#1,469 |
| 15. | Sammamish | 0.21% | 0.039%(+0.172)#43 | 0.042%(+0.168)#1,470 |
| 16. | Yarrow Point | 0.16% | 0.039%(+0.118)#44 | 0.042%(+0.114)#1,471 |
| 17. | Bellevue | 0.13% | 0.039%(+0.095)#45 | 0.042%(+0.091)#1,472 |
| 18. | Clyde Hill | 0.13% | 0.039%(+0.090)#46 | 0.042%(+0.086)#1,473 |
| 19. | Maplewood | 0.13% | 0.039%(+0.088)#47 | 0.042%(+0.084)#1,474 |
| 20. | Fairwood Cdp King County | 0.12% | 0.039%(+0.085)#48 | 0.042%(+0.081)#1,475 |
| 21. | Mukilteo | 0.12% | 0.039%(+0.078)#49 | 0.042%(+0.075)#1,476 |
| 22. | Renton | 0.12% | 0.039%(+0.078)#50 | 0.042%(+0.074)#1,477 |
| 23. | Maple Valley | 0.11% | 0.039%(+0.069)#51 | 0.042%(+0.065)#1,478 |
| 24. | Bothell | 0.096% | 0.039%(+0.057)#52 | 0.042%(+0.054)#1,479 |
| 25. | Lake Morton Berrydale | 0.096% | 0.039%(+0.057)#53 | 0.042%(+0.053)#1,480 |
| 26. | Bothell West | 0.078% | 0.039%(+0.039)#54 | 0.042%(+0.036)#1,481 |
| 27. | Pullman | 0.069% | 0.039%(+0.030)#55 | 0.042%(+0.026)#1,482 |
| 28. | Lynnwood | 0.068% | 0.039%(+0.029)#56 | 0.042%(+0.025)#1,483 |
| 29. | Fort Lewis | 0.067% | 0.039%(+0.028)#57 | 0.042%(+0.025)#1,484 |
| 30. | Seattle | 0.062% | 0.039%(+0.023)#58 | 0.042%(+0.020)#1,485 |
| 31. | Olympia | 0.062% | 0.039%(+0.023)#59 | 0.042%(+0.019)#1,486 |
| 32. | Cottage Lake | 0.060% | 0.039%(+0.022)#60 | 0.042%(+0.018)#1,487 |
| 33. | Indianola | 0.056% | 0.039%(+0.018)#61 | 0.042%(+0.014)#1,488 |
| 34. | West Richland | 0.054% | 0.039%(+0.016)#62 | 0.042%(+0.012)#1,489 |
| 35. | Silver Firs | 0.054% | 0.039%(+0.015)#63 | 0.042%(+0.012)#1,490 |
| 36. | Shoreline | 0.041% | 0.039%(+0.002)#64 | 0.042%(-0.001)#1,491 |
| 37. | Kenmore | 0.038% | 0.039%(-0.001)#65 | 0.042%(-0.004)#1,492 |
| 38. | Federal Way | 0.035% | 0.039%(-0.003)#66 | 0.042%(-0.007)#1,493 |
| 39. | University Place | 0.032% | 0.039%(-0.007)#67 | 0.042%(-0.011)#1,494 |
| 40. | Auburn | 0.032% | 0.039%(-0.007)#68 | 0.042%(-0.011)#1,495 |
| 41. | Richland | 0.028% | 0.039%(-0.011)#69 | 0.042%(-0.014)#1,496 |
| 42. | Seatac | 0.026% | 0.039%(-0.013)#70 | 0.042%(-0.017)#1,497 |
| 43. | Spokane | 0.025% | 0.039%(-0.013)#71 | 0.042%(-0.017)#1,498 |
| 44. | Yakima | 0.025% | 0.039%(-0.014)#72 | 0.042%(-0.018)#1,499 |
| 45. | Five Corners | 0.019% | 0.039%(-0.020)#73 | 0.042%(-0.023)#1,500 |
| 46. | Tacoma | 0.013% | 0.039%(-0.026)#74 | 0.042%(-0.030)#1,540 |
| 47. | Everett | 0.0081% | 0.039%(-0.031)#75 | 0.042%(-0.034)#1,541 |
| 48. | Vancouver | 0.0047% | 0.039%(-0.034)#76 | 0.042%(-0.038)#1,542 |
Common Questions
What are the Top 10 Cities with the Highest Percentage of Immigrants from Turkey in Washington?
Top 10 Cities with the Highest Percentage of Immigrants from Turkey in Washington are:
#1
62.16%
#2
1.62%
#3
1.53%
#4
1.29%
#5
0.64%
#6
0.55%
#7
0.55%
#8
0.53%
#9
0.51%
#10
0.47%
What city has the Highest Percentage of Immigrants from Turkey in Washington?
Maryhill has the Highest Percentage of Immigrants from Turkey in Washington with 62.16%.
What is the Percentage of Immigrants from Turkey in the State of Washington?
Percentage of Immigrants from Turkey in Washington is 0.039%.
What is the Percentage of Immigrants from Turkey in the United States?
Percentage of Immigrants from Turkey in the United States is 0.042%.