Cities with the Largest Asian Community in Washington
RELATED REPORTS & OPTIONS
Asian
Washington
Compare Cities
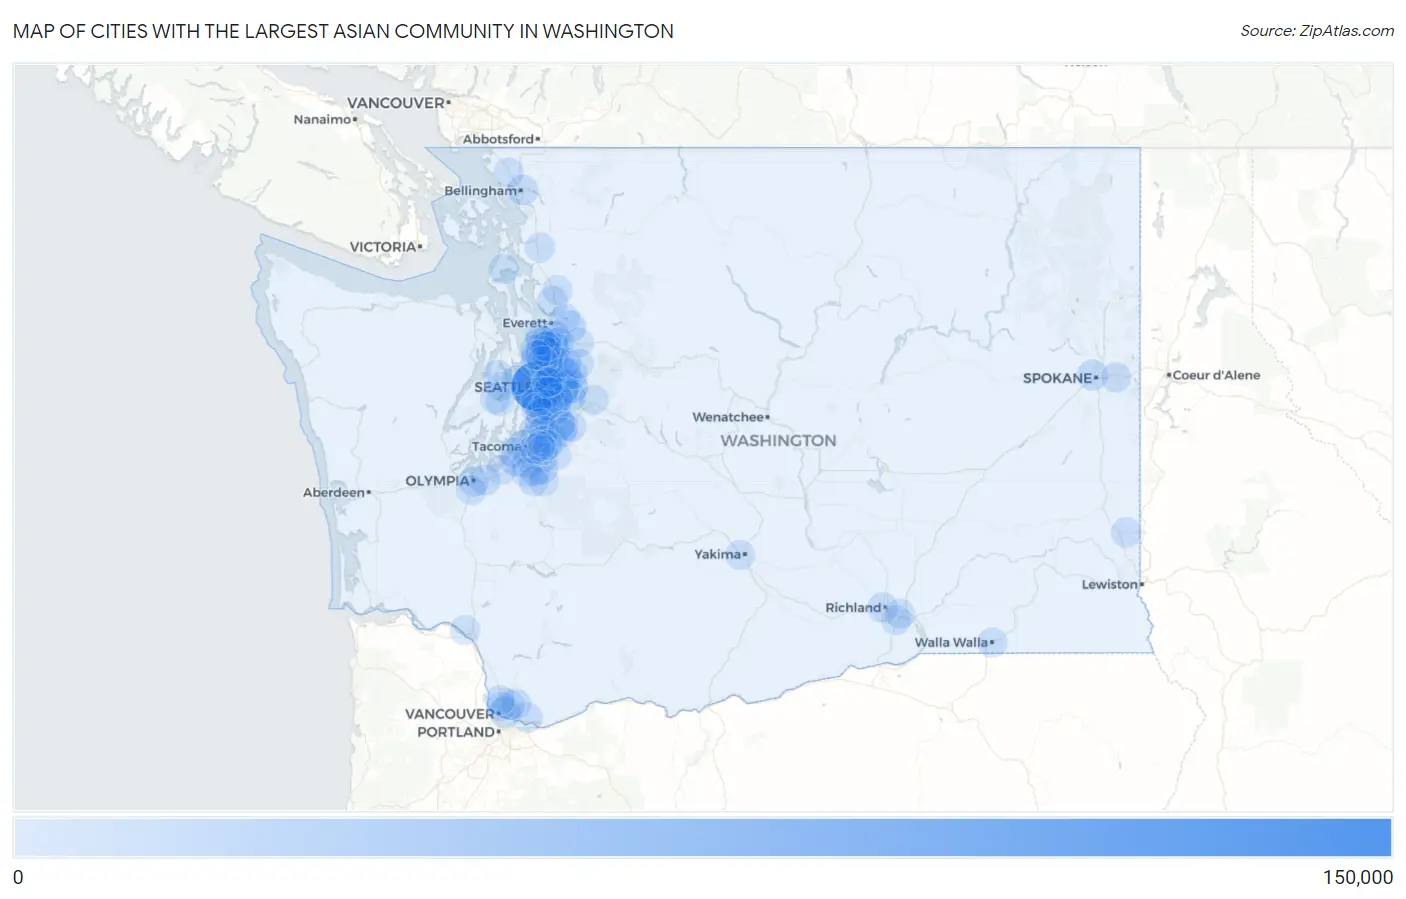
Map of Cities with the Largest Asian Community in Washington
0
150,000
Cities with the Largest Asian Community in Washington
| City | Asian | vs State | vs National | |
| 1. | Seattle | 123,703 | 708,647(17.46%)#1 | 19,112,979(0.65%)#11 |
| 2. | Bellevue | 59,481 | 708,647(8.39%)#2 | 19,112,979(0.31%)#26 |
| 3. | Kent | 30,295 | 708,647(4.28%)#3 | 19,112,979(0.16%)#72 |
| 4. | Redmond | 28,244 | 708,647(3.99%)#4 | 19,112,979(0.15%)#81 |
| 5. | Renton | 27,628 | 708,647(3.90%)#5 | 19,112,979(0.14%)#83 |
| 6. | Sammamish | 23,827 | 708,647(3.36%)#6 | 19,112,979(0.12%)#105 |
| 7. | Tacoma | 19,032 | 708,647(2.69%)#7 | 19,112,979(0.10%)#137 |
| 8. | Kirkland | 15,802 | 708,647(2.23%)#8 | 19,112,979(0.08%)#176 |
| 9. | Federal Way | 14,973 | 708,647(2.11%)#9 | 19,112,979(0.08%)#185 |
| 10. | Everett | 11,074 | 708,647(1.56%)#10 | 19,112,979(0.06%)#255 |
| 11. | Issaquah | 10,441 | 708,647(1.47%)#11 | 19,112,979(0.05%)#266 |
| 12. | Vancouver | 10,291 | 708,647(1.45%)#12 | 19,112,979(0.05%)#271 |
| 13. | Auburn | 9,387 | 708,647(1.32%)#13 | 19,112,979(0.05%)#301 |
| 14. | Shoreline | 9,283 | 708,647(1.31%)#14 | 19,112,979(0.05%)#306 |
| 15. | Mill Creek East | 9,140 | 708,647(1.29%)#15 | 19,112,979(0.05%)#309 |
| 16. | Bothell | 8,926 | 708,647(1.26%)#16 | 19,112,979(0.05%)#318 |
| 17. | Burien | 7,270 | 708,647(1.03%)#17 | 19,112,979(0.04%)#405 |
| 18. | Lynnwood | 7,186 | 708,647(1.01%)#18 | 19,112,979(0.04%)#412 |
| 19. | Bothell East | 6,157 | 708,647(0.87%)#19 | 19,112,979(0.03%)#478 |
| 20. | Spokane | 5,987 | 708,647(0.84%)#20 | 19,112,979(0.03%)#490 |
| 21. | Union Hill Novelty Hill | 5,962 | 708,647(0.84%)#21 | 19,112,979(0.03%)#493 |
| 22. | Mercer Island | 5,658 | 708,647(0.80%)#22 | 19,112,979(0.03%)#520 |
| 23. | Marysville | 5,410 | 708,647(0.76%)#23 | 19,112,979(0.03%)#538 |
| 24. | Lakewood | 5,397 | 708,647(0.76%)#24 | 19,112,979(0.03%)#541 |
| 25. | Lacey | 5,314 | 708,647(0.75%)#25 | 19,112,979(0.03%)#552 |
| 26. | Martha Lake | 5,289 | 708,647(0.75%)#26 | 19,112,979(0.03%)#556 |
| 27. | Tukwila | 5,258 | 708,647(0.74%)#27 | 19,112,979(0.03%)#562 |
| 28. | Bellingham | 5,205 | 708,647(0.73%)#28 | 19,112,979(0.03%)#567 |
| 29. | Seatac | 5,024 | 708,647(0.71%)#29 | 19,112,979(0.03%)#583 |
| 30. | Newcastle | 4,781 | 708,647(0.67%)#30 | 19,112,979(0.03%)#606 |
| 31. | Bryn Mawr Skyway | 4,700 | 708,647(0.66%)#31 | 19,112,979(0.02%)#617 |
| 32. | South Hill | 4,507 | 708,647(0.64%)#32 | 19,112,979(0.02%)#637 |
| 33. | Mukilteo | 4,352 | 708,647(0.61%)#33 | 19,112,979(0.02%)#653 |
| 34. | Mill Creek | 4,242 | 708,647(0.60%)#34 | 19,112,979(0.02%)#661 |
| 35. | North Lynnwood | 4,080 | 708,647(0.58%)#35 | 19,112,979(0.02%)#684 |
| 36. | Bothell West | 4,053 | 708,647(0.57%)#36 | 19,112,979(0.02%)#687 |
| 37. | Edmonds | 3,990 | 708,647(0.56%)#37 | 19,112,979(0.02%)#695 |
| 38. | Des Moines | 3,941 | 708,647(0.56%)#38 | 19,112,979(0.02%)#701 |
| 39. | University Place | 3,878 | 708,647(0.55%)#39 | 19,112,979(0.02%)#714 |
| 40. | Olympia | 3,864 | 708,647(0.55%)#40 | 19,112,979(0.02%)#716 |
| 41. | Richland | 3,700 | 708,647(0.52%)#41 | 19,112,979(0.02%)#732 |
| 42. | Pullman | 3,684 | 708,647(0.52%)#42 | 19,112,979(0.02%)#744 |
| 43. | Eastmont | 3,564 | 708,647(0.50%)#43 | 19,112,979(0.02%)#771 |
| 44. | Lake Stickney | 3,543 | 708,647(0.50%)#44 | 19,112,979(0.02%)#777 |
| 45. | Fairwood Cdp King County | 3,467 | 708,647(0.49%)#45 | 19,112,979(0.02%)#795 |
| 46. | Kenmore | 3,386 | 708,647(0.48%)#46 | 19,112,979(0.02%)#811 |
| 47. | Silver Firs | 3,356 | 708,647(0.47%)#47 | 19,112,979(0.02%)#819 |
| 48. | White Center | 3,280 | 708,647(0.46%)#48 | 19,112,979(0.02%)#833 |
| 49. | Maple Valley | 3,115 | 708,647(0.44%)#49 | 19,112,979(0.02%)#860 |
| 50. | Parkland | 3,018 | 708,647(0.43%)#50 | 19,112,979(0.02%)#879 |
| 51. | Camas | 2,856 | 708,647(0.40%)#51 | 19,112,979(0.01%)#927 |
| 52. | Lake Stevens | 2,654 | 708,647(0.37%)#52 | 19,112,979(0.01%)#971 |
| 53. | Lakeland North | 2,642 | 708,647(0.37%)#53 | 19,112,979(0.01%)#976 |
| 54. | Puyallup | 2,531 | 708,647(0.36%)#54 | 19,112,979(0.01%)#1,011 |
| 55. | Covington | 2,417 | 708,647(0.34%)#55 | 19,112,979(0.01%)#1,055 |
| 56. | Spanaway | 2,321 | 708,647(0.33%)#56 | 19,112,979(0.01%)#1,089 |
| 57. | Mountlake Terrace | 2,313 | 708,647(0.33%)#57 | 19,112,979(0.01%)#1,092 |
| 58. | Bremerton | 2,276 | 708,647(0.32%)#58 | 19,112,979(0.01%)#1,103 |
| 59. | Woodinville | 2,223 | 708,647(0.31%)#59 | 19,112,979(0.01%)#1,126 |
| 60. | Cottage Lake | 2,127 | 708,647(0.30%)#60 | 19,112,979(0.01%)#1,166 |
| 61. | Oak Harbor | 2,047 | 708,647(0.29%)#61 | 19,112,979(0.01%)#1,205 |
| 62. | Kennewick | 1,998 | 708,647(0.28%)#62 | 19,112,979(0.01%)#1,222 |
| 63. | Silverdale | 1,965 | 708,647(0.28%)#63 | 19,112,979(0.01%)#1,234 |
| 64. | Alderwood Manor | 1,948 | 708,647(0.27%)#64 | 19,112,979(0.01%)#1,244 |
| 65. | Frederickson | 1,922 | 708,647(0.27%)#65 | 19,112,979(0.01%)#1,258 |
| 66. | Fife | 1,779 | 708,647(0.25%)#66 | 19,112,979(0.01%)#1,328 |
| 67. | Orchards | 1,753 | 708,647(0.25%)#67 | 19,112,979(0.01%)#1,336 |
| 68. | Spokane Valley | 1,738 | 708,647(0.25%)#68 | 19,112,979(0.01%)#1,347 |
| 69. | Picnic Point | 1,612 | 708,647(0.23%)#69 | 19,112,979(0.01%)#1,416 |
| 70. | Pasco | 1,600 | 708,647(0.23%)#70 | 19,112,979(0.01%)#1,422 |
| 71. | Graham | 1,456 | 708,647(0.21%)#71 | 19,112,979(0.01%)#1,503 |
| 72. | Larch Way | 1,440 | 708,647(0.20%)#72 | 19,112,979(0.01%)#1,517 |
| 73. | Snoqualmie | 1,433 | 708,647(0.20%)#73 | 19,112,979(0.01%)#1,522 |
| 74. | Five Corners | 1,308 | 708,647(0.18%)#74 | 19,112,979(0.01%)#1,620 |
| 75. | Lakeland South | 1,247 | 708,647(0.18%)#75 | 19,112,979(0.01%)#1,671 |
| 76. | Monroe | 1,243 | 708,647(0.18%)#76 | 19,112,979(0.01%)#1,672 |
| 77. | Yakima | 1,233 | 708,647(0.17%)#77 | 19,112,979(0.01%)#1,676 |
| 78. | Arlington | 1,197 | 708,647(0.17%)#78 | 19,112,979(0.01%)#1,713 |
| 79. | Tumwater | 1,152 | 708,647(0.16%)#79 | 19,112,979(0.01%)#1,760 |
| 80. | Mount Vernon | 1,116 | 708,647(0.16%)#80 | 19,112,979(0.01%)#1,800 |
| 81. | Dupont | 1,116 | 708,647(0.16%)#81 | 19,112,979(0.01%)#1,801 |
| 82. | Lake Forest Park | 1,099 | 708,647(0.16%)#82 | 19,112,979(0.01%)#1,822 |
| 83. | Ferndale | 1,069 | 708,647(0.15%)#83 | 19,112,979(0.01%)#1,855 |
| 84. | Bonney Lake | 1,039 | 708,647(0.15%)#84 | 19,112,979(0.01%)#1,886 |
| 85. | Clyde Hill | 1,037 | 708,647(0.15%)#85 | 19,112,979(0.01%)#1,888 |
| 86. | Hazel Dell | 1,025 | 708,647(0.14%)#86 | 19,112,979(0.01%)#1,899 |
| 87. | Tracyton | 964 | 708,647(0.14%)#87 | 19,112,979(0.01%)#1,968 |
| 88. | Duvall | 938 | 708,647(0.13%)#88 | 19,112,979(0.00%)#2,000 |
| 89. | Bainbridge Island | 910 | 708,647(0.13%)#89 | 19,112,979(0.00%)#2,042 |
| 90. | Port Orchard | 857 | 708,647(0.12%)#90 | 19,112,979(0.00%)#2,115 |
| 91. | Walla Walla | 839 | 708,647(0.12%)#91 | 19,112,979(0.00%)#2,144 |
| 92. | Lake Morton Berrydale | 828 | 708,647(0.12%)#92 | 19,112,979(0.00%)#2,165 |
| 93. | Medina | 797 | 708,647(0.11%)#93 | 19,112,979(0.00%)#2,206 |
| 94. | Elk Plain | 796 | 708,647(0.11%)#94 | 19,112,979(0.00%)#2,208 |
| 95. | Edgewood | 795 | 708,647(0.11%)#95 | 19,112,979(0.00%)#2,211 |
| 96. | Pacific | 749 | 708,647(0.11%)#96 | 19,112,979(0.00%)#2,281 |
| 97. | Salmon Creek | 735 | 708,647(0.10%)#97 | 19,112,979(0.00%)#2,300 |
| 98. | Esperance | 698 | 708,647(0.10%)#98 | 19,112,979(0.00%)#2,377 |
| 99. | Longview | 682 | 708,647(0.10%)#99 | 19,112,979(0.00%)#2,413 |
| 100. | Milton | 633 | 708,647(0.09%)#100 | 19,112,979(0.00%)#2,509 |
Common Questions
What are the Top 10 Cities with the Largest Asian Community in Washington?
Top 10 Cities with the Largest Asian Community in Washington are:
What city has the Largest Asian Community in Washington?
Seattle has the Largest Asian Community in Washington with 123,703.
What is the Total Asian Population in the State of Washington?
Total Asian Population in Washington is 708,647.
What is the Total Asian Population in the United States?
Total Asian Population in the United States is 19,112,979.