Cities with the Highest Percentage of Immigrants from Western Africa in Washington
RELATED REPORTS & OPTIONS
Western Africa
Washington
Compare Cities
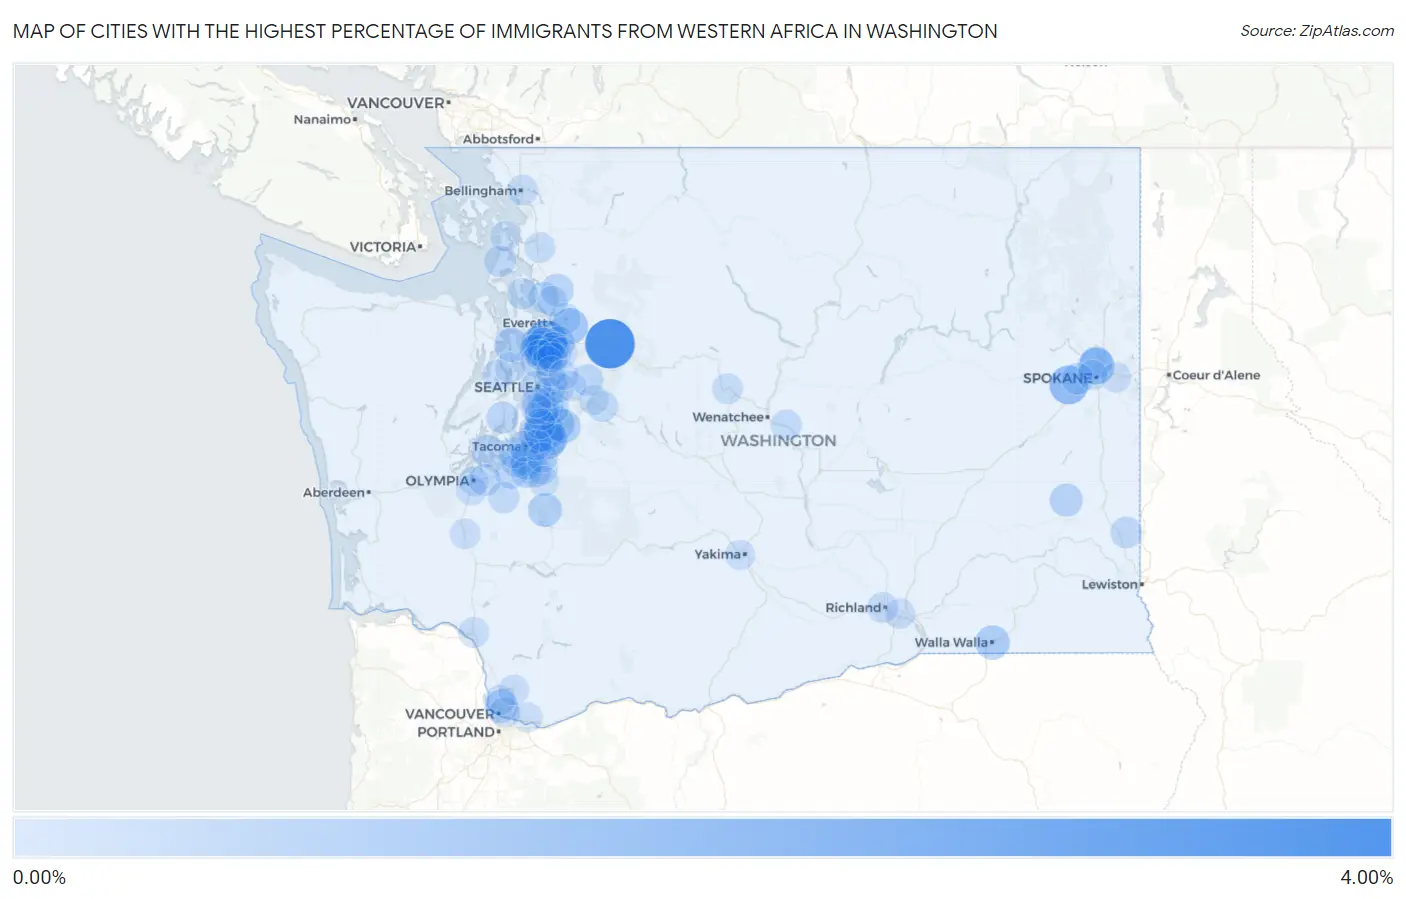
Map of Cities with the Highest Percentage of Immigrants from Western Africa in Washington
0.00%
4.00%
Cities with the Highest Percentage of Immigrants from Western Africa in Washington
| City | Western Africa | vs State | vs National | |
| 1. | Gold Bar | 3.68% | 0.14%(+3.53)#-1 | 0.30%(+3.38)#0 |
| 2. | Lake Stickney | 2.11% | 0.14%(+1.96)#0 | 0.30%(+1.81)#1 |
| 3. | Lakeland North | 1.76% | 0.14%(+1.61)#1 | 0.30%(+1.46)#2 |
| 4. | Fairchild Afb | 1.57% | 0.14%(+1.43)#2 | 0.30%(+1.27)#3 |
| 5. | Town And Country | 1.16% | 0.14%(+1.02)#3 | 0.30%(+0.866)#4 |
| 6. | Everett | 1.08% | 0.14%(+0.933)#26 | 0.30%(+0.780)#913 |
| 7. | Alderwood Manor | 1.06% | 0.14%(+0.919)#27 | 0.30%(+0.766)#914 |
| 8. | Algona | 1.04% | 0.14%(+0.897)#28 | 0.30%(+0.744)#915 |
| 9. | Lynnwood | 1.02% | 0.14%(+0.876)#29 | 0.30%(+0.723)#916 |
| 10. | Meadowdale | 0.93% | 0.14%(+0.790)#30 | 0.30%(+0.637)#917 |
| 11. | North Lynnwood | 0.84% | 0.14%(+0.693)#31 | 0.30%(+0.540)#918 |
| 12. | Federal Way | 0.80% | 0.14%(+0.654)#32 | 0.30%(+0.501)#964 |
| 13. | Bothell East | 0.78% | 0.14%(+0.637)#33 | 0.30%(+0.484)#965 |
| 14. | Walla Walla | 0.77% | 0.14%(+0.629)#34 | 0.30%(+0.477)#966 |
| 15. | Midland | 0.75% | 0.14%(+0.604)#35 | 0.30%(+0.451)#967 |
| 16. | Port Gamble Tribal Community | 0.71% | 0.14%(+0.561)#36 | 0.30%(+0.408)#968 |
| 17. | Kent | 0.70% | 0.14%(+0.555)#37 | 0.30%(+0.402)#1,135 |
| 18. | Covington | 0.69% | 0.14%(+0.547)#38 | 0.30%(+0.394)#1,136 |
| 19. | Eatonville | 0.67% | 0.14%(+0.523)#39 | 0.30%(+0.370)#1,137 |
| 20. | Hazel Dell | 0.59% | 0.14%(+0.441)#40 | 0.30%(+0.288)#1,138 |
| 21. | Auburn | 0.56% | 0.14%(+0.417)#41 | 0.30%(+0.264)#1,139 |
| 22. | Seatac | 0.55% | 0.14%(+0.408)#42 | 0.30%(+0.255)#1,140 |
| 23. | Endicott | 0.53% | 0.14%(+0.384)#43 | 0.30%(+0.231)#1,141 |
| 24. | Bryn Mawr Skyway | 0.48% | 0.14%(+0.332)#44 | 0.30%(+0.179)#1,142 |
| 25. | Arlington | 0.43% | 0.14%(+0.285)#45 | 0.30%(+0.132)#1,143 |
| 26. | Longbranch | 0.42% | 0.14%(+0.272)#46 | 0.30%(+0.119)#1,144 |
| 27. | Country Homes | 0.42% | 0.14%(+0.271)#47 | 0.30%(+0.118)#1,145 |
| 28. | Fort Lewis | 0.41% | 0.14%(+0.264)#48 | 0.30%(+0.112)#1,146 |
| 29. | Frederickson | 0.40% | 0.14%(+0.251)#49 | 0.30%(+0.098)#1,147 |
| 30. | Silver Firs | 0.38% | 0.14%(+0.233)#50 | 0.30%(+0.080)#1,148 |
| 31. | Burley | 0.36% | 0.14%(+0.211)#51 | 0.30%(+0.058)#1,149 |
| 32. | Yarrow Point | 0.31% | 0.14%(+0.168)#52 | 0.30%(+0.015)#1,150 |
| 33. | Airway Heights | 0.30% | 0.14%(+0.158)#53 | 0.30%(+0.005)#1,151 |
| 34. | Parkland | 0.30% | 0.14%(+0.152)#54 | 0.30%(-0.001)#1,152 |
| 35. | Pullman | 0.29% | 0.14%(+0.143)#55 | 0.30%(-0.010)#1,153 |
| 36. | Whidbey Island Station | 0.28% | 0.14%(+0.137)#56 | 0.30%(-0.016)#1,154 |
| 37. | Carnation | 0.28% | 0.14%(+0.133)#57 | 0.30%(-0.019)#1,155 |
| 38. | Lacey | 0.28% | 0.14%(+0.132)#58 | 0.30%(-0.020)#1,156 |
| 39. | Lakewood | 0.25% | 0.14%(+0.110)#59 | 0.30%(-0.043)#1,157 |
| 40. | Yelm | 0.25% | 0.14%(+0.104)#60 | 0.30%(-0.049)#1,158 |
| 41. | Renton | 0.24% | 0.14%(+0.100)#61 | 0.30%(-0.053)#1,159 |
| 42. | Tukwila | 0.24% | 0.14%(+0.096)#62 | 0.30%(-0.057)#1,160 |
| 43. | Edmonds | 0.23% | 0.14%(+0.089)#63 | 0.30%(-0.064)#1,161 |
| 44. | Lake Goodwin | 0.23% | 0.14%(+0.088)#64 | 0.30%(-0.065)#1,162 |
| 45. | Shoreline | 0.23% | 0.14%(+0.084)#65 | 0.30%(-0.069)#1,163 |
| 46. | Lake Stevens | 0.22% | 0.14%(+0.079)#66 | 0.30%(-0.074)#1,164 |
| 47. | Camano | 0.22% | 0.14%(+0.071)#67 | 0.30%(-0.082)#1,165 |
| 48. | North Bend | 0.20% | 0.14%(+0.054)#68 | 0.30%(-0.099)#1,166 |
| 49. | South Hill | 0.17% | 0.14%(+0.029)#69 | 0.30%(-0.124)#1,167 |
| 50. | University Place | 0.16% | 0.14%(+0.019)#70 | 0.30%(-0.133)#1,168 |
| 51. | Seattle | 0.16% | 0.14%(+0.017)#71 | 0.30%(-0.136)#1,169 |
| 52. | Rock Island | 0.16% | 0.14%(+0.014)#72 | 0.30%(-0.139)#1,170 |
| 53. | Spanaway | 0.16% | 0.14%(+0.011)#73 | 0.30%(-0.142)#1,171 |
| 54. | Leavenworth | 0.15% | 0.14%(+0.008)#74 | 0.30%(-0.145)#1,172 |
| 55. | Burien | 0.14% | 0.14%(-0.001)#75 | 0.30%(-0.154)#1,173 |
| 56. | Richland | 0.14% | 0.14%(-0.007)#76 | 0.30%(-0.160)#1,174 |
| 57. | Bothell West | 0.13% | 0.14%(-0.013)#77 | 0.30%(-0.166)#1,175 |
| 58. | Fife Heights | 0.13% | 0.14%(-0.018)#78 | 0.30%(-0.171)#1,176 |
| 59. | Mount Vernon | 0.12% | 0.14%(-0.028)#79 | 0.30%(-0.181)#1,177 |
| 60. | Mill Creek East | 0.11% | 0.14%(-0.038)#80 | 0.30%(-0.191)#1,178 |
| 61. | Marysville | 0.11% | 0.14%(-0.039)#81 | 0.30%(-0.192)#1,179 |
| 62. | Bellevue | 0.10% | 0.14%(-0.044)#82 | 0.30%(-0.197)#1,180 |
| 63. | Vancouver | 0.099% | 0.14%(-0.046)#83 | 0.30%(-0.199)#1,181 |
| 64. | Bellingham | 0.095% | 0.14%(-0.050)#84 | 0.30%(-0.202)#1,182 |
| 65. | Kelso | 0.095% | 0.14%(-0.050)#85 | 0.30%(-0.203)#1,183 |
| 66. | Mercer Island | 0.094% | 0.14%(-0.051)#86 | 0.30%(-0.203)#1,184 |
| 67. | Tacoma | 0.094% | 0.14%(-0.051)#87 | 0.30%(-0.204)#1,185 |
| 68. | Maltby | 0.088% | 0.14%(-0.057)#88 | 0.30%(-0.210)#1,186 |
| 69. | Silverdale | 0.087% | 0.14%(-0.058)#89 | 0.30%(-0.210)#1,187 |
| 70. | Centralia | 0.082% | 0.14%(-0.063)#90 | 0.30%(-0.215)#1,188 |
| 71. | Salmon Creek | 0.079% | 0.14%(-0.066)#91 | 0.30%(-0.219)#1,189 |
| 72. | Battle Ground | 0.077% | 0.14%(-0.068)#92 | 0.30%(-0.221)#1,190 |
| 73. | Des Moines | 0.067% | 0.14%(-0.077)#93 | 0.30%(-0.230)#1,191 |
| 74. | Mountlake Terrace | 0.066% | 0.14%(-0.079)#94 | 0.30%(-0.232)#1,192 |
| 75. | Spokane Valley | 0.066% | 0.14%(-0.079)#95 | 0.30%(-0.232)#1,193 |
| 76. | Sammamish | 0.060% | 0.14%(-0.085)#96 | 0.30%(-0.238)#1,194 |
| 77. | White Center | 0.058% | 0.14%(-0.087)#97 | 0.30%(-0.240)#1,195 |
| 78. | Pasco | 0.056% | 0.14%(-0.089)#98 | 0.30%(-0.242)#1,196 |
| 79. | Tumwater | 0.055% | 0.14%(-0.090)#99 | 0.30%(-0.243)#1,197 |
| 80. | Kenmore | 0.047% | 0.14%(-0.098)#100 | 0.30%(-0.251)#1,198 |
| 81. | Suquamish | 0.046% | 0.14%(-0.099)#101 | 0.30%(-0.251)#1,199 |
| 82. | Graham | 0.040% | 0.14%(-0.105)#102 | 0.30%(-0.257)#1,200 |
| 83. | Yakima | 0.032% | 0.14%(-0.113)#103 | 0.30%(-0.266)#1,201 |
| 84. | Kirkland | 0.032% | 0.14%(-0.113)#104 | 0.30%(-0.266)#1,202 |
| 85. | Bothell | 0.031% | 0.14%(-0.114)#105 | 0.30%(-0.266)#1,203 |
| 86. | Camas | 0.030% | 0.14%(-0.115)#106 | 0.30%(-0.267)#1,204 |
| 87. | Snoqualmie | 0.029% | 0.14%(-0.116)#107 | 0.30%(-0.269)#1,205 |
| 88. | Spokane | 0.029% | 0.14%(-0.116)#108 | 0.30%(-0.269)#1,206 |
| 89. | Redmond | 0.027% | 0.14%(-0.118)#109 | 0.30%(-0.271)#1,207 |
| 90. | Puyallup | 0.019% | 0.14%(-0.126)#110 | 0.30%(-0.279)#1,208 |
| 91. | Olympia | 0.013% | 0.14%(-0.132)#111 | 0.30%(-0.285)#1,209 |
| 92. | Anacortes | 0.011% | 0.14%(-0.134)#112 | 0.30%(-0.286)#1,210 |
Common Questions
What are the Top 10 Cities with the Highest Percentage of Immigrants from Western Africa in Washington?
Top 10 Cities with the Highest Percentage of Immigrants from Western Africa in Washington are:
#1
3.68%
#2
2.11%
#3
1.76%
#4
1.57%
#5
1.16%
#6
1.08%
#7
1.06%
#8
1.04%
#9
1.02%
#10
0.93%
What city has the Highest Percentage of Immigrants from Western Africa in Washington?
Gold Bar has the Highest Percentage of Immigrants from Western Africa in Washington with 3.68%.
What is the Percentage of Immigrants from Western Africa in the State of Washington?
Percentage of Immigrants from Western Africa in Washington is 0.14%.
What is the Percentage of Immigrants from Western Africa in the United States?
Percentage of Immigrants from Western Africa in the United States is 0.30%.