Cities with the Highest Percentage of Immigrants from Scotland in Washington

RELATED REPORTS & OPTIONS

Scotland
Population
Families and Households
Female Fertility
Female Fertility (Unmarried)
Race (Community Size)
Race (Percentage)
Ancestry (Community Size)
AfghanAfricanAlaska NativeAlaskan AthabascanAlbanianAleutAlsatianAmericanApacheArabArapahoArgentineanArmenianAssyrian / Chaldean / SyriacAustralianAustrianBahamianBangladeshiBarbadianBasqueBelgianBelizeanBermudanBhutaneseBlackfeetBolivianBrazilianBritishBritish West IndianBulgarianBurmeseCajunCambodianCanadianCape VerdeanCarpatho RusynCelticCentral AmericanCentral American IndianCherokeeCheyenneChickasawChileanChineseChippewaChoctawColombianColvilleComancheCosta RicanCreeCreekCroatianCrowCubanCypriotCzechCzechoslovakianDanishDelawareDominicanDutchDutch West IndianEastern EuropeanEcuadorianEgyptianEnglishEstonianEthiopianEuropeanFijianFilipinoFinnishFrenchFrench American IndianFrench CanadianGermanGerman RussianGhanaianGreekGuamanian / ChamorroGuatemalanGuyaneseHaitianHmongHonduranHopiHoumaHungarianIcelanderIndian (Asian)IndonesianInupiatIranianIraqiIrishIroquoisIsraeliItalianJamaicanJapaneseJordanianKenyanKiowaKoreanLaotianLatvianLebaneseLiberianLithuanianLumbeeLuxembourgerMacedonianMalaysianMalteseMarshalleseMenomineeMexicanMexican American IndianMongolianMoroccanNative HawaiianNavajoNepaleseNew ZealanderNicaraguanNigerianNorthern EuropeanNorwegianOkinawanOsageOttawaPaiutePakistaniPalestinianPanamanianParaguayanPennsylvania GermanPeruvianPimaPolishPortuguesePotawatomiPuebloPuerto RicanPuget Sound SalishRomanianRussianSalvadoranSamoanScandinavianScotch-IrishScottishSeminoleSenegaleseSerbianShoshoneSierra LeoneanSiouxSlavicSlovakSloveneSomaliSouth AfricanSouth AmericanSouth American IndianSoviet UnionSpaniardSpanishSpanish AmericanSpanish American IndianSri LankanSubsaharan AfricanSudaneseSwedishSwissSyrianTaiwaneseThaiTlingit-HaidaTohono O'OdhamTonganTrinidadian and TobagonianTsimshianTurkishU.S. Virgin IslanderUgandanUkrainianUruguayanUteVenezuelanVietnameseWelshWest IndianYakamaYaquiYugoslavianYumanYup'ikZimbabwean
Ancestry (Percentage)
AfghanAfricanAlaska NativeAlaskan AthabascanAlbanianAleutAlsatianAmericanApacheArabArapahoArgentineanArmenianAssyrian / Chaldean / SyriacAustralianAustrianBahamianBangladeshiBarbadianBasqueBelgianBelizeanBermudanBhutaneseBlackfeetBolivianBrazilianBritishBritish West IndianBulgarianBurmeseCajunCambodianCanadianCape VerdeanCarpatho RusynCelticCentral AmericanCentral American IndianCherokeeCheyenneChickasawChileanChineseChippewaChoctawColombianColvilleComancheCosta RicanCreeCreekCroatianCrowCubanCypriotCzechCzechoslovakianDanishDelawareDominicanDutchDutch West IndianEastern EuropeanEcuadorianEgyptianEnglishEstonianEthiopianEuropeanFijianFilipinoFinnishFrenchFrench American IndianFrench CanadianGermanGerman RussianGhanaianGreekGuamanian / ChamorroGuatemalanGuyaneseHaitianHmongHonduranHopiHoumaHungarianIcelanderIndian (Asian)IndonesianInupiatIranianIraqiIrishIroquoisIsraeliItalianJamaicanJapaneseJordanianKenyanKiowaKoreanLaotianLatvianLebaneseLiberianLithuanianLumbeeLuxembourgerMacedonianMalaysianMalteseMarshalleseMenomineeMexicanMexican American IndianMongolianMoroccanNative HawaiianNavajoNepaleseNew ZealanderNicaraguanNigerianNorthern EuropeanNorwegianOkinawanOsageOttawaPaiutePakistaniPalestinianPanamanianParaguayanPennsylvania GermanPeruvianPimaPolishPortuguesePotawatomiPuebloPuerto RicanPuget Sound SalishRomanianRussianSalvadoranSamoanScandinavianScotch-IrishScottishSeminoleSenegaleseSerbianShoshoneSierra LeoneanSiouxSlavicSlovakSloveneSomaliSouth AfricanSouth AmericanSouth American IndianSoviet UnionSpaniardSpanishSpanish AmericanSpanish American IndianSri LankanSubsaharan AfricanSudaneseSwedishSwissSyrianTaiwaneseThaiTlingit-HaidaTohono O'OdhamTonganTrinidadian and TobagonianTsimshianTurkishU.S. Virgin IslanderUgandanUkrainianUruguayanUteVenezuelanVietnameseWelshWest IndianYakamaYaquiYugoslavianYumanYup'ikZimbabwean
Immigrant Origin (Total)
AfghanistanAfricaAlbaniaArgentinaArmeniaAsiaAustraliaAustriaAzoresBahamasBangladeshBarbadosBelarusBelgiumBelizeBoliviaBosnia and HerzegovinaBrazilBulgariaBurma / MyanmarCabo VerdeCambodiaCameroonCanadaCaribbeanCentral AmericaChileChinaColombiaCongoCosta RicaCroatiaCubaCzechoslovakiaDenmarkDominicaDominican RepublicEastern AfricaEastern AsiaEastern EuropeEcuadorEgyptEl SalvadorEnglandEritreaEthiopiaEuropeFijiFranceGermanyGhanaGreeceGrenadaGuatemalaGuyanaHaitiHondurasHong KongHungaryIndiaIndonesiaIranIraqIrelandIsraelItalyJamaicaJapanJordanKazakhstanKenyaKoreaKuwaitLaosLatin AmericaLatviaLebanonLiberiaLithuaniaMalaysiaMexicoMicronesiaMiddle AfricaMoldovaMoroccoNepalNetherlandsNicaraguaNigeriaNorth MacedoniaNorthern AfricaNorthern EuropeNorwayOceaniaPakistanPanamaPeruPhilippinesPolandPortugalRomaniaRussiaSaudi ArabiaScotlandSenegalSerbiaSierra LeoneSingaporeSomaliaSouth AfricaSouth AmericaSouth Central AsiaSouth Eastern AsiaSouthern EuropeSpainSri LankaSt. Vincent and the GrenadinesSudanSwedenSwitzerlandSyriaTaiwanThailandTrinidad and TobagoTurkeyUgandaUkraineUruguayUzbekistanVenezuelaVietnamWest IndiesWestern AfricaWestern AsiaWestern EuropeYemenZaireZimbabwe
Immigrant Origin (Percentage)
AfghanistanAfricaAlbaniaArgentinaArmeniaAsiaAustraliaAustriaAzoresBahamasBangladeshBarbadosBelarusBelgiumBelizeBoliviaBosnia and HerzegovinaBrazilBulgariaBurma / MyanmarCabo VerdeCambodiaCameroonCanadaCaribbeanCentral AmericaChileChinaColombiaCongoCosta RicaCroatiaCubaCzechoslovakiaDenmarkDominicaDominican RepublicEastern AfricaEastern AsiaEastern EuropeEcuadorEgyptEl SalvadorEnglandEritreaEthiopiaEuropeFijiFranceGermanyGhanaGreeceGrenadaGuatemalaGuyanaHaitiHondurasHong KongHungaryIndiaIndonesiaIranIraqIrelandIsraelItalyJamaicaJapanJordanKazakhstanKenyaKoreaKuwaitLaosLatin AmericaLatviaLebanonLiberiaLithuaniaMalaysiaMexicoMicronesiaMiddle AfricaMoldovaMoroccoNepalNetherlandsNicaraguaNigeriaNorth MacedoniaNorthern AfricaNorthern EuropeNorwayOceaniaPakistanPanamaPeruPhilippinesPolandPortugalRomaniaRussiaSaudi ArabiaScotlandSenegalSerbiaSierra LeoneSingaporeSomaliaSouth AfricaSouth AmericaSouth Central AsiaSouth Eastern AsiaSouthern EuropeSpainSri LankaSt. Vincent and the GrenadinesSudanSwedenSwitzerlandSyriaTaiwanThailandTrinidad and TobagoTurkeyUgandaUkraineUruguayUzbekistanVenezuelaVietnamWest IndiesWestern AfricaWestern AsiaWestern EuropeYemenZaireZimbabwe
Income
Income (Families)
Income (Households)
Poverty
Poverty (Families)
Unemployment
Employment Occupations
Employment Industries
Employer Class
Commute Time
Commute Means
School Enrollment
Education by Degree Field
Occupancy
Finances
Physical Characteristics
Washington
Compare Cities
Comparison Subject

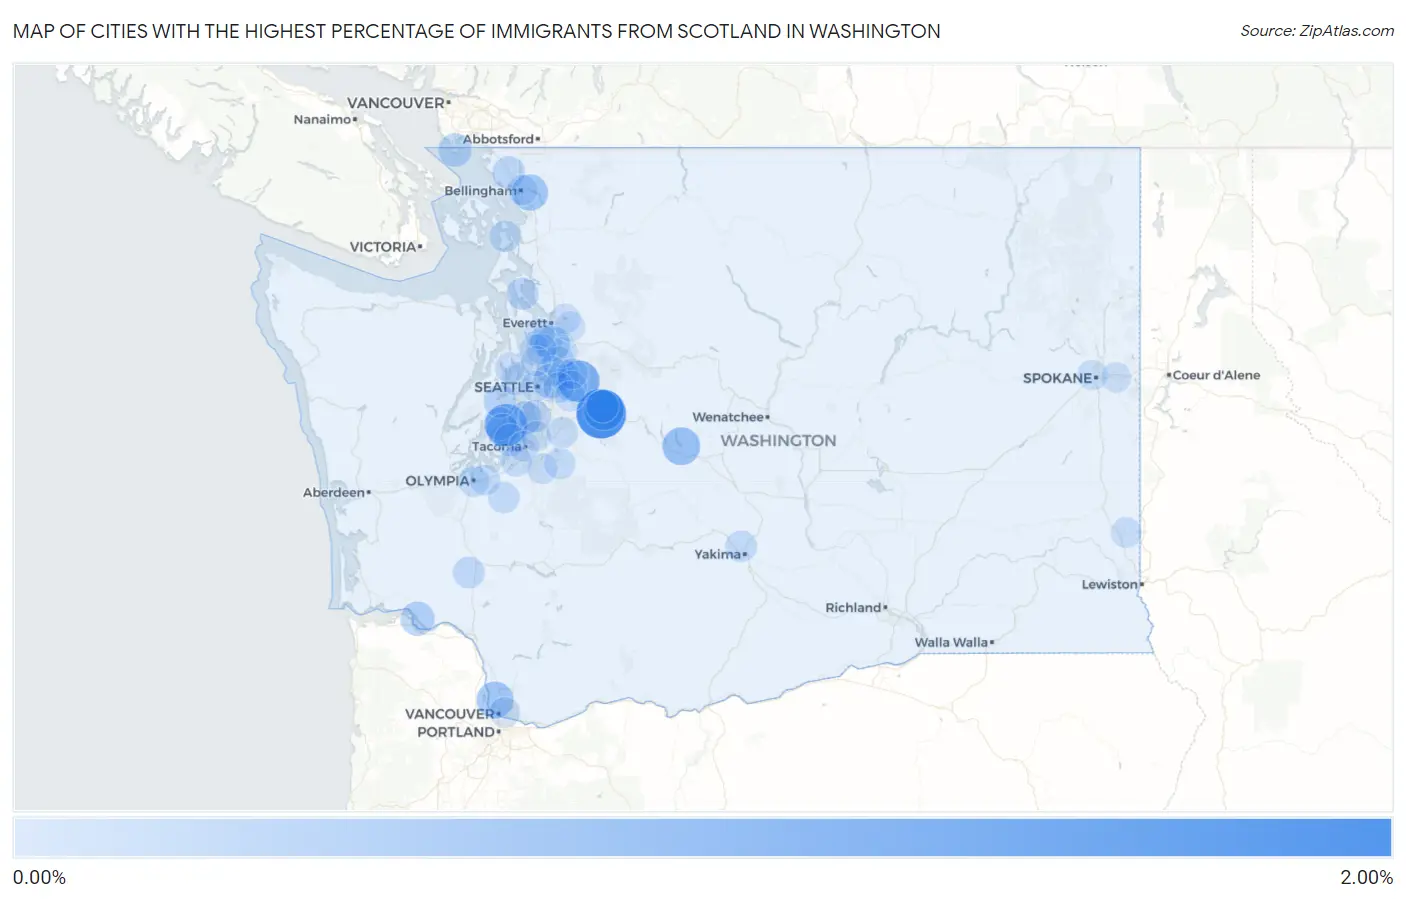
Map of Cities with the Highest Percentage of Immigrants from Scotland in Washington

0.00%
2.00%
Cities with the Highest Percentage of Immigrants from Scotland in Washington Map

Cities with the Highest Percentage of Immigrants from Scotland in Washington

City Scotland vs State vs National
1.Wilderness Rim1.87%0.026%(+1.84)#10.017%(+1.85)#24
2.Roche Harbor1.20%0.026%(+1.17)#20.017%(+1.18)#47
3.Canterwood1.14%0.026%(+1.11)#30.017%(+1.12)#52
4.Ames Lake1.08%0.026%(+1.06)#40.017%(+1.07)#60
5.Riverbend0.98%0.026%(+0.954)#50.017%(+0.963)#63
6.Roslyn0.73%0.026%(+0.699)#60.017%(+0.708)#95
7.Felida0.62%0.026%(+0.592)#70.017%(+0.600)#116
8.Geneva0.57%0.026%(+0.546)#80.017%(+0.555)#130
9.Mill Creek0.45%0.026%(+0.421)#90.017%(+0.430)#175
10.Clyde Hill0.39%0.026%(+0.360)#100.017%(+0.369)#208
11.Cathlamet0.37%0.026%(+0.340)#110.017%(+0.349)#226
12.Point Roberts0.32%0.026%(+0.294)#120.017%(+0.303)#261
13.Vashon0.28%0.026%(+0.257)#130.017%(+0.266)#304
14.Wauna0.26%0.026%(+0.230)#140.017%(+0.239)#341
15.Port Orchard0.25%0.026%(+0.220)#150.017%(+0.229)#355
16.Rosedale0.23%0.026%(+0.208)#160.017%(+0.217)#379
17.Ferndale0.23%0.026%(+0.205)#170.017%(+0.214)#381
18.North Bend0.21%0.026%(+0.186)#180.017%(+0.195)#406
19.Normandy Park0.19%0.026%(+0.168)#190.017%(+0.177)#449
20.Wollochet0.19%0.026%(+0.166)#200.017%(+0.175)#454
21.Camano0.18%0.026%(+0.155)#210.017%(+0.164)#483
22.Lake Stickney0.16%0.026%(+0.137)#220.017%(+0.146)#525
23.Woodinville0.16%0.026%(+0.132)#230.017%(+0.141)#540
24.Winlock0.15%0.026%(+0.127)#240.017%(+0.136)#556
25.Anacortes0.13%0.026%(+0.104)#250.017%(+0.113)#608
26.Selah0.12%0.026%(+0.096)#260.017%(+0.105)#642
27.Yelm0.11%0.026%(+0.089)#270.017%(+0.098)#661
28.Redmond0.11%0.026%(+0.086)#280.017%(+0.095)#669
29.Edmonds0.089%0.026%(+0.063)#290.017%(+0.072)#764
30.Olympia0.085%0.026%(+0.059)#300.017%(+0.068)#782
31.Prairie Ridge0.080%0.026%(+0.054)#310.017%(+0.063)#807
32.Sammamish0.077%0.026%(+0.050)#320.017%(+0.059)#838
33.Lake Morton Berrydale0.077%0.026%(+0.050)#330.017%(+0.059)#839
34.Lakewood0.067%0.026%(+0.040)#340.017%(+0.049)#897
35.Lacey0.055%0.026%(+0.029)#350.017%(+0.038)#974
36.Pullman0.053%0.026%(+0.027)#360.017%(+0.036)#991
37.Maltby0.053%0.026%(+0.027)#370.017%(+0.036)#994
38.Bainbridge Island0.053%0.026%(+0.026)#380.017%(+0.035)#1,000
39.Kirkland0.050%0.026%(+0.024)#390.017%(+0.033)#1,021
40.Vancouver0.041%0.026%(+0.015)#400.017%(+0.024)#1,079
41.Seattle0.040%0.026%(+0.013)#410.017%(+0.022)#1,096
42.Spokane0.036%0.026%(+0.010)#420.017%(+0.019)#1,139
43.Lynnwood0.035%0.026%(+0.009)#430.017%(+0.018)#1,148
44.Bellingham0.033%0.026%(+0.007)#440.017%(+0.015)#1,180
45.Tacoma0.031%0.026%(+0.005)#450.017%(+0.014)#1,196
46.South Hill0.031%0.026%(+0.005)#460.017%(+0.014)#1,207
47.Union Hill Novelty Hill0.030%0.026%(+0.004)#470.017%(+0.013)#1,216
48.Mukilteo0.028%0.026%(+0.002)#480.017%(+0.011)#1,246
49.Bellevue0.025%0.026%(-0.001)#490.017%(+0.008)#1,283
50.Suquamish0.023%0.026%(-0.003)#500.017%(+0.006)#1,308
51.Federal Way0.021%0.026%(-0.005)#510.017%(+0.004)#1,341
52.Lake Stevens0.021%0.026%(-0.006)#520.017%(+0.003)#1,347
53.Issaquah0.018%0.026%(-0.009)#530.017%(+0.000)#1,392
54.Shoreline0.012%0.026%(-0.014)#540.017%(-0.005)#1,500
55.Spokane Valley0.011%0.026%(-0.016)#550.017%(-0.007)#1,527
56.Everett0.0099%0.026%(-0.016)#560.017%(-0.007)#1,538

Common Questions

What are the Top 10 Cities with the Highest Percentage of Immigrants from Scotland in Washington?
Top 10 Cities with the Highest Percentage of Immigrants from Scotland in Washington are:
#1
1.87%
#2
1.14%
#3
1.08%
#4
0.98%
#5
0.73%
#6
0.62%
#7
0.57%
#8
0.45%
#9
0.39%
#10
0.37%
What city has the Highest Percentage of Immigrants from Scotland in Washington?
Wilderness Rim has the Highest Percentage of Immigrants from Scotland in Washington with 1.87%.
What is the Percentage of Immigrants from Scotland in the State of Washington?
Percentage of Immigrants from Scotland in Washington is 0.026%.
What is the Percentage of Immigrants from Scotland in the United States?
Percentage of Immigrants from Scotland in the United States is 0.017%.