Cities with the Highest Population Density in Washington
RELATED REPORTS & OPTIONS
Highest Population Density
Washington
Compare Cities
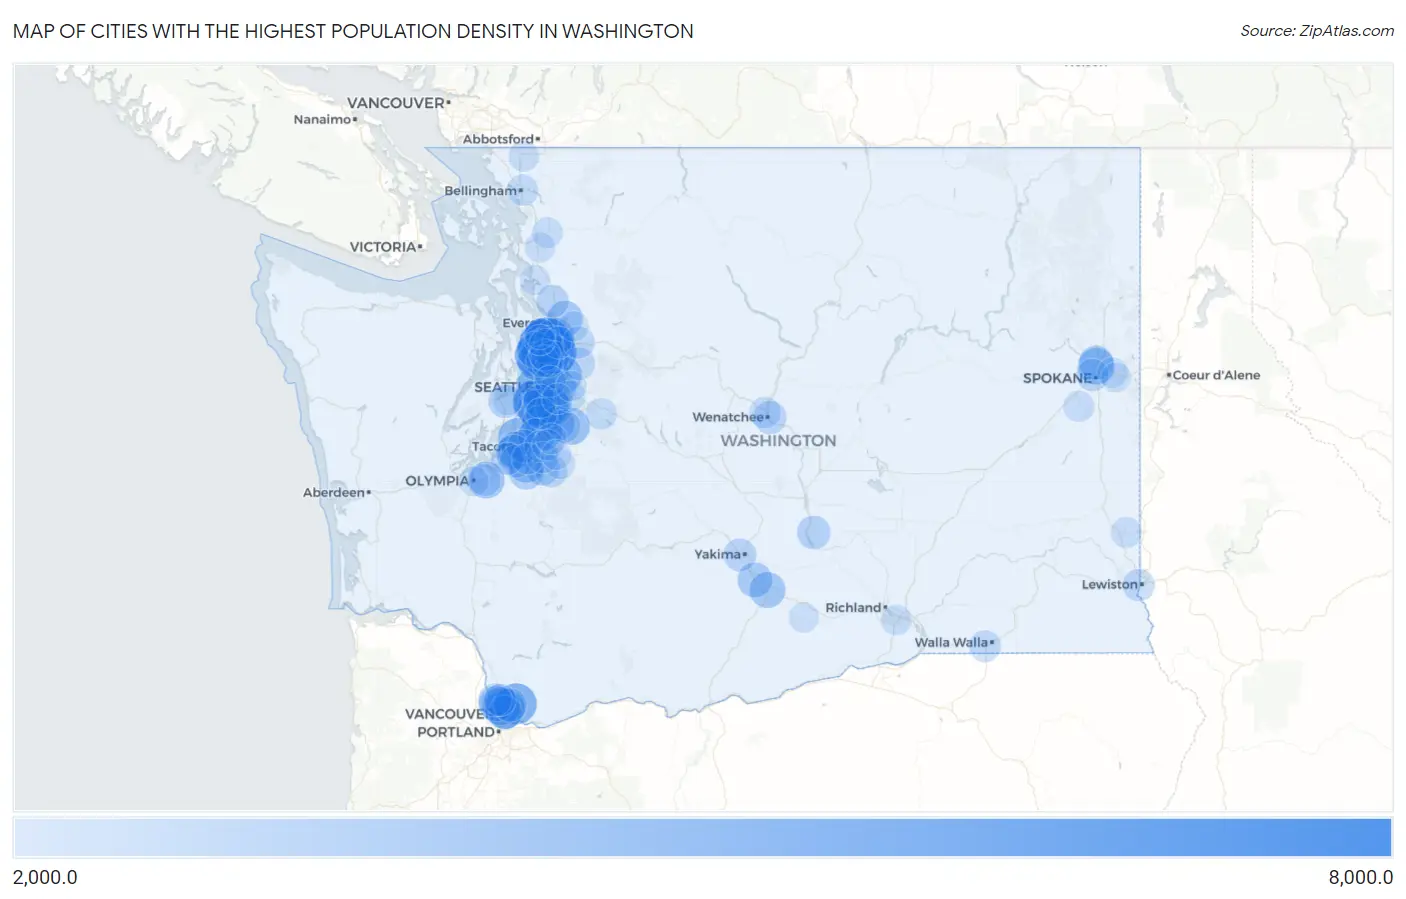
Map of Cities with the Highest Population Density in Washington
0.0
8,000.0
Cities with the Highest Population Density in Washington
| City | People / Sq Mi | vs State | vs National | |
| 1. | North Lynnwood | 7,776.1 | 115.7(+7.66k)#1 | 0.0(+7.78k)#305 |
| 2. | Lake Stickney | 7,272.9 | 115.7(+7.16k)#2 | 0.0(+7.27k)#367 |
| 3. | White Center | 6,808.3 | 115.7(+6.69k)#3 | 0.0(+6.81k)#451 |
| 4. | Bothell East | 6,667.6 | 115.7(+6.55k)#4 | 0.0(+6.67k)#481 |
| 5. | Esperance | 5,982.7 | 115.7(+5.87k)#5 | 0.0(+5.98k)#620 |
| 6. | Bryn Mawr Skyway | 5,836.3 | 115.7(+5.72k)#6 | 0.0(+5.84k)#664 |
| 7. | Mill Creek East | 5,708.0 | 115.7(+5.59k)#7 | 0.0(+5.71k)#705 |
| 8. | Alderwood Manor | 5,511.1 | 115.7(+5.40k)#8 | 0.0(+5.51k)#763 |
| 9. | Orchards | 5,473.4 | 115.7(+5.36k)#9 | 0.0(+5.47k)#777 |
| 10. | Minnehaha | 5,241.8 | 115.7(+5.13k)#10 | 0.0(+5.24k)#852 |
| 11. | Seattle | 5,185.0 | 115.7(+5.07k)#11 | 0.0(+5.19k)#881 |
| 12. | Mountlake Terrace | 5,147.2 | 115.7(+5.03k)#12 | 0.0(+5.15k)#896 |
| 13. | Lynnwood | 5,056.1 | 115.7(+4.94k)#13 | 0.0(+5.06k)#927 |
| 14. | Martha Lake | 5,025.6 | 115.7(+4.91k)#14 | 0.0(+5.03k)#944 |
| 15. | Bothell West | 4,970.1 | 115.7(+4.85k)#15 | 0.0(+4.97k)#964 |
| 16. | Ruston | 4,946.7 | 115.7(+4.83k)#16 | 0.0(+4.95k)#971 |
| 17. | Shoreline | 4,731.8 | 115.7(+4.62k)#17 | 0.0(+4.73k)#1,065 |
| 18. | Hazel Dell | 4,704.9 | 115.7(+4.59k)#18 | 0.0(+4.70k)#1,081 |
| 19. | Burien | 4,613.4 | 115.7(+4.50k)#19 | 0.0(+4.61k)#1,132 |
| 20. | Parkland | 4,549.2 | 115.7(+4.43k)#20 | 0.0(+4.55k)#1,164 |
| 21. | Eastmont | 4,526.6 | 115.7(+4.41k)#21 | 0.0(+4.53k)#1,175 |
| 22. | Maple Valley | 4,520.5 | 115.7(+4.40k)#22 | 0.0(+4.52k)#1,177 |
| 23. | Fircrest | 4,486.0 | 115.7(+4.37k)#23 | 0.0(+4.49k)#1,203 |
| 24. | Lakeland North | 4,479.0 | 115.7(+4.36k)#24 | 0.0(+4.48k)#1,207 |
| 25. | Mill Creek | 4,476.3 | 115.7(+4.36k)#25 | 0.0(+4.48k)#1,210 |
| 26. | Tanglewilde | 4,432.1 | 115.7(+4.32k)#26 | 0.0(+4.43k)#1,231 |
| 27. | Des Moines | 4,425.7 | 115.7(+4.31k)#27 | 0.0(+4.43k)#1,234 |
| 28. | Town And Country | 4,392.8 | 115.7(+4.28k)#28 | 0.0(+4.39k)#1,252 |
| 29. | Redmond | 4,293.3 | 115.7(+4.18k)#29 | 0.0(+4.29k)#1,303 |
| 30. | Edmonds | 4,283.5 | 115.7(+4.17k)#30 | 0.0(+4.28k)#1,310 |
| 31. | Federal Way | 4,212.8 | 115.7(+4.10k)#31 | 0.0(+4.21k)#1,348 |
| 32. | Renton | 4,187.0 | 115.7(+4.07k)#32 | 0.0(+4.19k)#1,369 |
| 33. | Lake Stevens | 4,171.2 | 115.7(+4.06k)#33 | 0.0(+4.17k)#1,384 |
| 34. | Toppenish | 4,157.6 | 115.7(+4.04k)#34 | 0.0(+4.16k)#1,387 |
| 35. | Kirkland | 4,072.4 | 115.7(+3.96k)#35 | 0.0(+4.07k)#1,430 |
| 36. | University Place | 4,069.9 | 115.7(+3.95k)#36 | 0.0(+4.07k)#1,435 |
| 37. | Lake Shore | 4,039.9 | 115.7(+3.92k)#37 | 0.0(+4.04k)#1,463 |
| 38. | Bellevue | 4,027.1 | 115.7(+3.91k)#38 | 0.0(+4.03k)#1,472 |
| 39. | Larch Way | 3,962.5 | 115.7(+3.85k)#39 | 0.0(+3.96k)#1,504 |
| 40. | Wapato | 3,960.7 | 115.7(+3.84k)#40 | 0.0(+3.96k)#1,507 |
| 41. | Kent | 3,937.3 | 115.7(+3.82k)#41 | 0.0(+3.94k)#1,532 |
| 42. | Country Homes | 3,760.1 | 115.7(+3.64k)#42 | 0.0(+3.76k)#1,659 |
| 43. | Spanaway | 3,730.8 | 115.7(+3.62k)#43 | 0.0(+3.73k)#1,681 |
| 44. | Vancouver | 3,644.0 | 115.7(+3.53k)#44 | 0.0(+3.64k)#1,760 |
| 45. | South Hill | 3,642.9 | 115.7(+3.53k)#45 | 0.0(+3.64k)#1,761 |
| 46. | Five Corners | 3,602.9 | 115.7(+3.49k)#46 | 0.0(+3.60k)#1,797 |
| 47. | East Port Orchard | 3,571.0 | 115.7(+3.46k)#47 | 0.0(+3.57k)#1,823 |
| 48. | Mattawa | 3,563.3 | 115.7(+3.45k)#48 | 0.0(+3.56k)#1,830 |
| 49. | Boulevard Park | 3,542.8 | 115.7(+3.43k)#49 | 0.0(+3.54k)#1,852 |
| 50. | Bothell | 3,526.6 | 115.7(+3.41k)#50 | 0.0(+3.53k)#1,873 |
| 51. | Tacoma | 3,521.3 | 115.7(+3.41k)#51 | 0.0(+3.52k)#1,876 |
| 52. | Felida | 3,481.6 | 115.7(+3.37k)#52 | 0.0(+3.48k)#1,911 |
| 53. | Covington | 3,455.5 | 115.7(+3.34k)#53 | 0.0(+3.46k)#1,927 |
| 54. | East Wenatchee | 3,445.9 | 115.7(+3.33k)#54 | 0.0(+3.45k)#1,936 |
| 55. | Yakima | 3,434.0 | 115.7(+3.32k)#55 | 0.0(+3.43k)#1,943 |
| 56. | Marysville | 3,374.3 | 115.7(+3.26k)#56 | 0.0(+3.37k)#1,999 |
| 57. | Lakewood | 3,345.7 | 115.7(+3.23k)#57 | 0.0(+3.35k)#2,030 |
| 58. | Duvall | 3,306.7 | 115.7(+3.19k)#58 | 0.0(+3.31k)#2,072 |
| 59. | Spokane | 3,285.4 | 115.7(+3.17k)#59 | 0.0(+3.29k)#2,099 |
| 60. | Kenmore | 3,279.5 | 115.7(+3.16k)#60 | 0.0(+3.28k)#2,107 |
| 61. | Steilacoom | 3,266.3 | 115.7(+3.15k)#61 | 0.0(+3.27k)#2,120 |
| 62. | Lake Forest Park | 3,253.7 | 115.7(+3.14k)#62 | 0.0(+3.25k)#2,135 |
| 63. | Silver Firs | 3,252.6 | 115.7(+3.14k)#63 | 0.0(+3.25k)#2,138 |
| 64. | Clarkston | 3,247.3 | 115.7(+3.13k)#64 | 0.0(+3.25k)#2,150 |
| 65. | Orting | 3,237.1 | 115.7(+3.12k)#65 | 0.0(+3.24k)#2,167 |
| 66. | Salmon Creek | 3,208.7 | 115.7(+3.09k)#66 | 0.0(+3.21k)#2,197 |
| 67. | Monroe | 3,201.2 | 115.7(+3.09k)#67 | 0.0(+3.20k)#2,205 |
| 68. | Lacey | 3,176.6 | 115.7(+3.06k)#68 | 0.0(+3.18k)#2,230 |
| 69. | College Place | 3,140.7 | 115.7(+3.02k)#69 | 0.0(+3.14k)#2,268 |
| 70. | Wenatchee | 3,083.7 | 115.7(+2.97k)#70 | 0.0(+3.08k)#2,325 |
| 71. | Milton | 3,054.3 | 115.7(+2.94k)#71 | 0.0(+3.05k)#2,372 |
| 72. | Seatac | 3,030.5 | 115.7(+2.91k)#72 | 0.0(+3.03k)#2,403 |
| 73. | Wilderness Rim | 3,006.8 | 115.7(+2.89k)#73 | 0.0(+3.01k)#2,433 |
| 74. | Bellingham | 3,002.9 | 115.7(+2.89k)#74 | 0.0(+3.00k)#2,440 |
| 75. | Puyallup | 2,998.9 | 115.7(+2.88k)#75 | 0.0(+3.00k)#2,445 |
| 76. | Issaquah | 2,997.0 | 115.7(+2.88k)#76 | 0.0(+3.00k)#2,447 |
| 77. | Midland | 2,996.4 | 115.7(+2.88k)#77 | 0.0(+3.00k)#2,448 |
| 78. | Brier | 2,982.1 | 115.7(+2.87k)#78 | 0.0(+2.98k)#2,472 |
| 79. | Clyde Hill | 2,952.7 | 115.7(+2.84k)#79 | 0.0(+2.95k)#2,518 |
| 80. | Cheney | 2,941.5 | 115.7(+2.83k)#80 | 0.0(+2.94k)#2,530 |
| 81. | Pullman | 2,933.6 | 115.7(+2.82k)#81 | 0.0(+2.93k)#2,547 |
| 82. | Prairie Ridge | 2,930.2 | 115.7(+2.81k)#82 | 0.0(+2.93k)#2,552 |
| 83. | Pacific | 2,919.9 | 115.7(+2.80k)#83 | 0.0(+2.92k)#2,563 |
| 84. | Newcastle | 2,912.8 | 115.7(+2.80k)#84 | 0.0(+2.91k)#2,578 |
| 85. | Lynden | 2,898.4 | 115.7(+2.78k)#85 | 0.0(+2.90k)#2,591 |
| 86. | Sedro Woolley | 2,896.3 | 115.7(+2.78k)#86 | 0.0(+2.90k)#2,596 |
| 87. | Mukilteo | 2,878.9 | 115.7(+2.76k)#87 | 0.0(+2.88k)#2,626 |
| 88. | Auburn | 2,875.7 | 115.7(+2.76k)#88 | 0.0(+2.88k)#2,631 |
| 89. | Kennewick | 2,872.0 | 115.7(+2.76k)#89 | 0.0(+2.87k)#2,635 |
| 90. | Picnic Point | 2,819.4 | 115.7(+2.70k)#90 | 0.0(+2.82k)#2,711 |
| 91. | Mount Vernon | 2,788.2 | 115.7(+2.67k)#91 | 0.0(+2.79k)#2,748 |
| 92. | Sammamish | 2,777.2 | 115.7(+2.66k)#92 | 0.0(+2.78k)#2,762 |
| 93. | Parkwood | 2,765.1 | 115.7(+2.65k)#93 | 0.0(+2.77k)#2,781 |
| 94. | Millwood | 2,763.4 | 115.7(+2.65k)#94 | 0.0(+2.76k)#2,784 |
| 95. | Olympia | 2,755.1 | 115.7(+2.64k)#95 | 0.0(+2.76k)#2,794 |
| 96. | Mabton | 2,755.0 | 115.7(+2.64k)#96 | 0.0(+2.76k)#2,795 |
| 97. | Stanwood | 2,744.8 | 115.7(+2.63k)#97 | 0.0(+2.74k)#2,817 |
| 98. | Spokane Valley | 2,737.6 | 115.7(+2.62k)#98 | 0.0(+2.74k)#2,829 |
| 99. | Bonney Lake | 2,733.4 | 115.7(+2.62k)#99 | 0.0(+2.73k)#2,832 |
| 100. | Snohomish | 2,733.0 | 115.7(+2.62k)#100 | 0.0(+2.73k)#2,833 |
Common Questions
What are the Top 10 Cities with the Highest Population Density in Washington?
Top 10 Cities with the Highest Population Density in Washington are:
#1
7,776.1
#2
7,272.9
#3
6,808.3
#4
6,667.6
#5
5,982.7
#6
5,836.3
#7
5,708.0
#8
5,511.1
#9
5,473.4
#10
5,241.8
What city has the Highest Population Density in Washington?
North Lynnwood has the Highest Population Density in Washington with 7,776.1.
What is the Population Density in the State of Washington?
Population Density in Washington is 115.7.