Zip Codes with the Highest Percentage of Population Employed in Food Preparation & Serving in Bellingham, WA
RELATED REPORTS & OPTIONS
Food Preparation & Serving
Bellingham
Compare Zip Codes
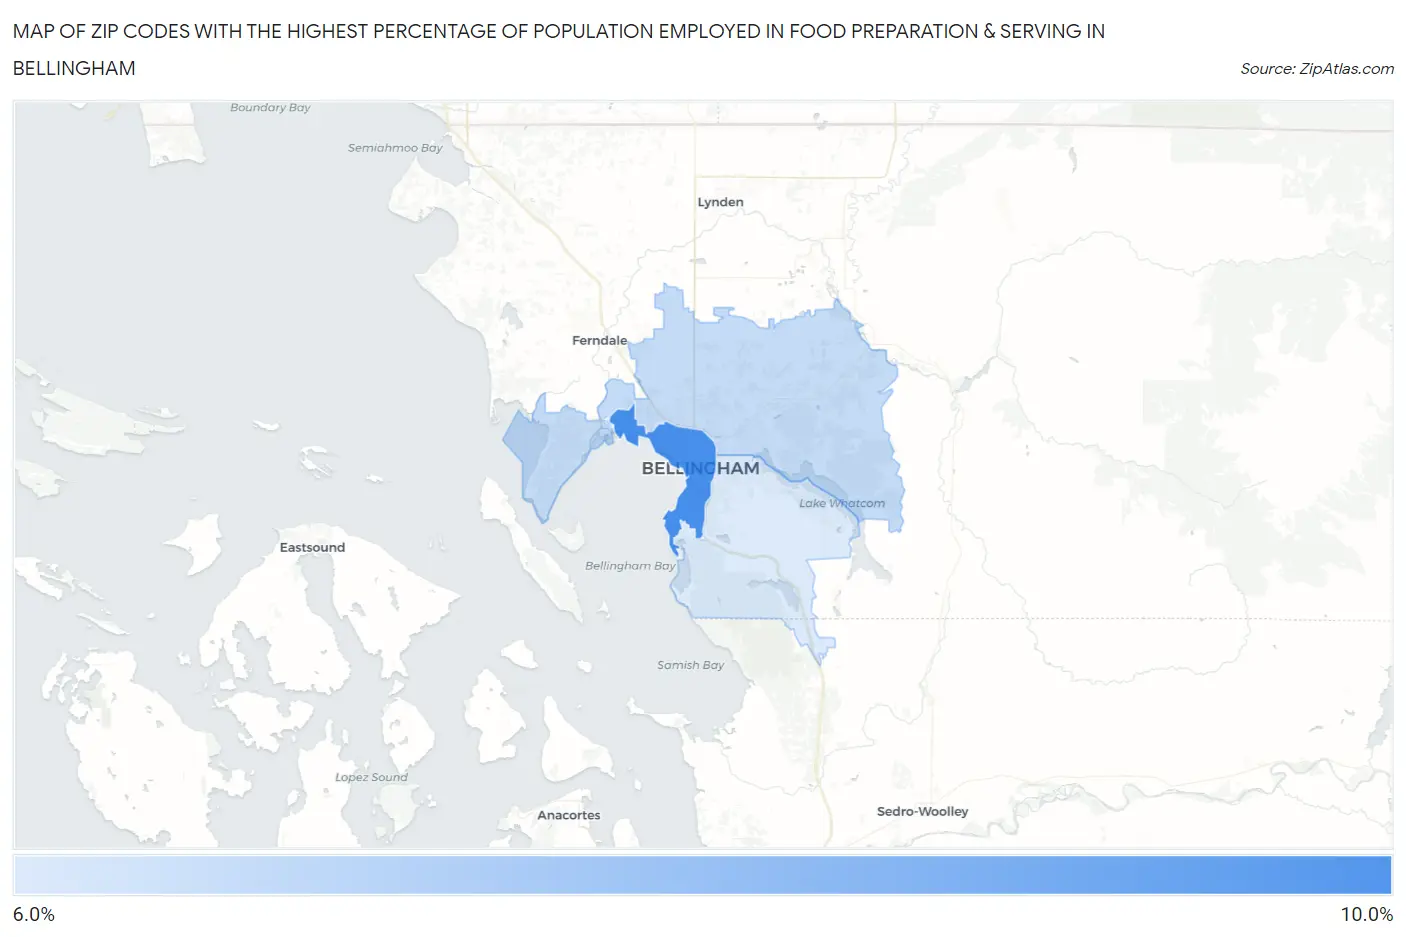
Map of Zip Codes with the Highest Percentage of Population Employed in Food Preparation & Serving in Bellingham
6.2%
8.1%
Zip Codes with the Highest Percentage of Population Employed in Food Preparation & Serving in Bellingham, WA
| Zip Code | % Employed | vs State | vs National | |
| 1. | 98225 | 8.1% | 5.1%(+2.98)#79 | 5.3%(+2.84)#4,541 |
| 2. | 98226 | 6.5% | 5.1%(+1.38)#126 | 5.3%(+1.24)#7,820 |
| 3. | 98229 | 6.2% | 5.1%(+1.11)#149 | 5.3%(+0.964)#8,575 |
1
Common Questions
What are the Top Zip Codes with the Highest Percentage of Population Employed in Food Preparation & Serving in Bellingham, WA?
Top Zip Codes with the Highest Percentage of Population Employed in Food Preparation & Serving in Bellingham, WA are:
What zip code has the Highest Percentage of Population Employed in Food Preparation & Serving in Bellingham, WA?
98225 has the Highest Percentage of Population Employed in Food Preparation & Serving in Bellingham, WA with 8.1%.
What is the Percentage of Population Employed in Food Preparation & Serving in Bellingham, WA?
Percentage of Population Employed in Food Preparation & Serving in Bellingham is 8.4%.
What is the Percentage of Population Employed in Food Preparation & Serving in Washington?
Percentage of Population Employed in Food Preparation & Serving in Washington is 5.1%.
What is the Percentage of Population Employed in Food Preparation & Serving in the United States?
Percentage of Population Employed in Food Preparation & Serving in the United States is 5.3%.