Port Gamble Tribal Community, WA Map & Demographics
Port Gamble Tribal Community Map
Port Gamble Tribal Community Overview
$35,773
PER CAPITA INCOME
$68,750
AVG FAMILY INCOME
$77,188
AVG HOUSEHOLD INCOME
28.7%
WAGE / INCOME GAP [ % ]
71.3¢/ $1
WAGE / INCOME GAP [ $ ]
$10,143
FAMILY INCOME DEFICIT
0.44
INEQUALITY / GINI INDEX
850
TOTAL POPULATION
389
MALE POPULATION
461
FEMALE POPULATION
84.38
MALES / 100 FEMALES
118.51
FEMALES / 100 MALES
37.6
MEDIAN AGE
2.8
AVG FAMILY SIZE
2.8
AVG HOUSEHOLD SIZE
374
LABOR FORCE [ PEOPLE ]
56.8%
PERCENT IN LABOR FORCE
7.2%
UNEMPLOYMENT RATE
Income in Port Gamble Tribal Community
Income Overview in Port Gamble Tribal Community
Per Capita Income in Port Gamble Tribal Community is $35,773, while median incomes of families and households are $68,750 and $77,188 respectively.
| Characteristic | Number | Measure |
| Per Capita Income | 850 | $35,773 |
| Median Family Income | 229 | $68,750 |
| Mean Family Income | 229 | $92,623 |
| Median Household Income | 303 | $77,188 |
| Mean Household Income | 303 | $103,608 |
| Income Deficit | 229 | $10,143 |
| Wage / Income Gap (%) | 850 | 28.71% |
| Wage / Income Gap ($) | 850 | 71.29¢ per $1 |
| Gini / Inequality Index | 850 | 0.44 |
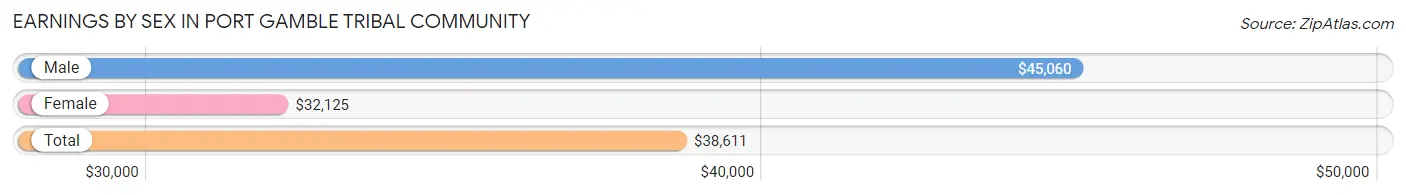
Earnings by Sex in Port Gamble Tribal Community
Average Earnings in Port Gamble Tribal Community are $38,611, $45,060 for men and $32,125 for women, a difference of 28.7%.
| Sex | Number | Average Earnings |
| Male | 183 (47.2%) | $45,060 |
| Female | 205 (52.8%) | $32,125 |
| Total | 388 (100.0%) | $38,611 |
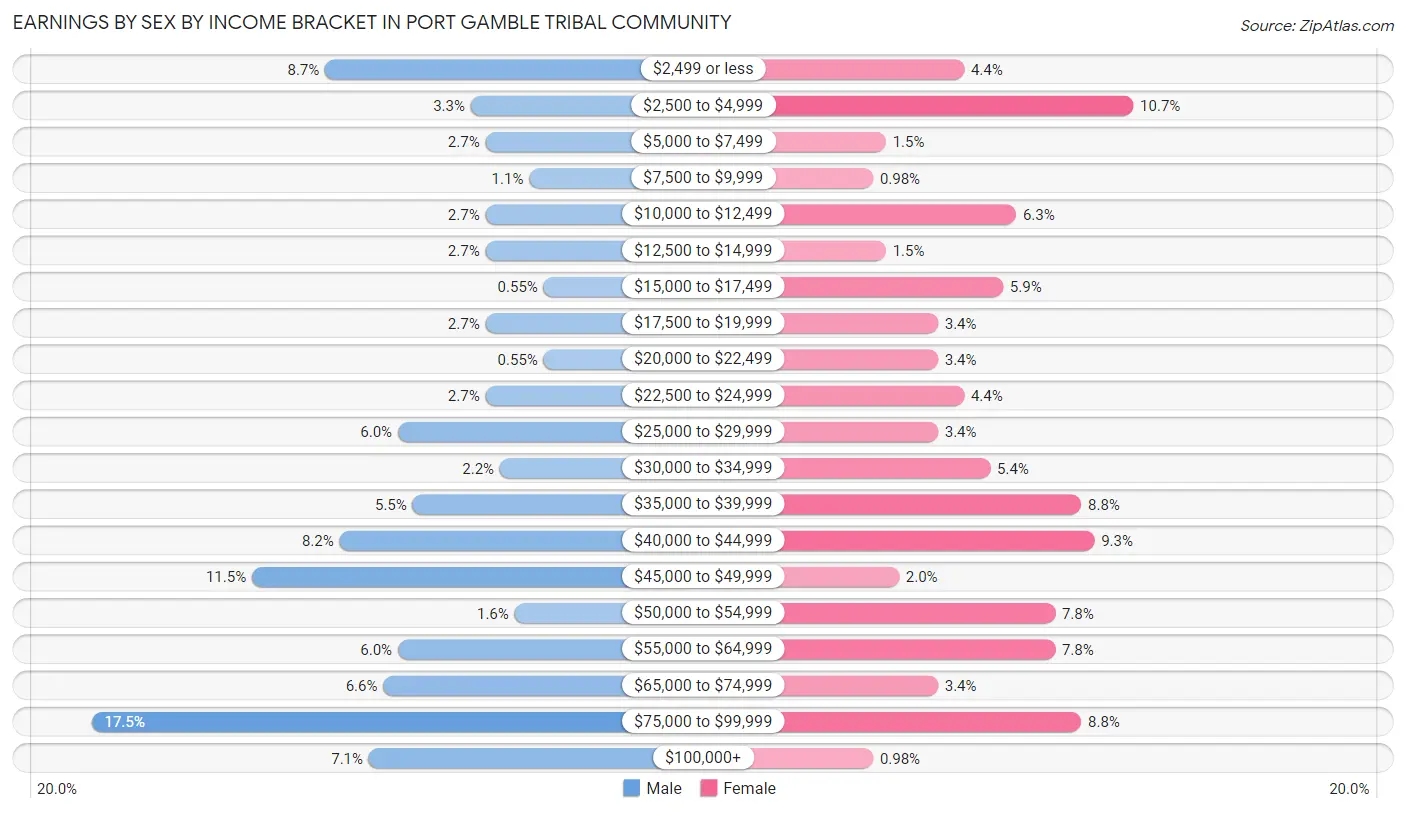
Earnings by Sex by Income Bracket in Port Gamble Tribal Community
The most common earnings brackets in Port Gamble Tribal Community are $75,000 to $99,999 for men (32 | 17.5%) and $2,500 to $4,999 for women (22 | 10.7%).
| Income | Male | Female |
| $2,499 or less | 16 (8.7%) | 9 (4.4%) |
| $2,500 to $4,999 | 6 (3.3%) | 22 (10.7%) |
| $5,000 to $7,499 | 5 (2.7%) | 3 (1.5%) |
| $7,500 to $9,999 | 2 (1.1%) | 2 (1.0%) |
| $10,000 to $12,499 | 5 (2.7%) | 13 (6.3%) |
| $12,500 to $14,999 | 5 (2.7%) | 3 (1.5%) |
| $15,000 to $17,499 | 1 (0.5%) | 12 (5.9%) |
| $17,500 to $19,999 | 5 (2.7%) | 7 (3.4%) |
| $20,000 to $22,499 | 1 (0.5%) | 7 (3.4%) |
| $22,500 to $24,999 | 5 (2.7%) | 9 (4.4%) |
| $25,000 to $29,999 | 11 (6.0%) | 7 (3.4%) |
| $30,000 to $34,999 | 4 (2.2%) | 11 (5.4%) |
| $35,000 to $39,999 | 10 (5.5%) | 18 (8.8%) |
| $40,000 to $44,999 | 15 (8.2%) | 19 (9.3%) |
| $45,000 to $49,999 | 21 (11.5%) | 4 (1.9%) |
| $50,000 to $54,999 | 3 (1.6%) | 16 (7.8%) |
| $55,000 to $64,999 | 11 (6.0%) | 16 (7.8%) |
| $65,000 to $74,999 | 12 (6.6%) | 7 (3.4%) |
| $75,000 to $99,999 | 32 (17.5%) | 18 (8.8%) |
| $100,000+ | 13 (7.1%) | 2 (1.0%) |
| Total | 183 (100.0%) | 205 (100.0%) |
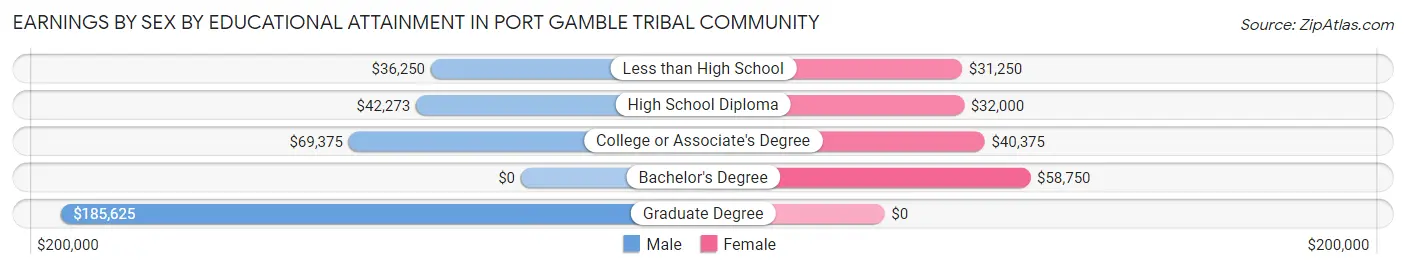
Earnings by Sex by Educational Attainment in Port Gamble Tribal Community
Average earnings in Port Gamble Tribal Community are $46,618 for men and $37,019 for women, a difference of 20.6%. Men with an educational attainment of graduate degree enjoy the highest average annual earnings of $185,625, while those with less than high school education earn the least with $36,250. Women with an educational attainment of bachelor's degree earn the most with the average annual earnings of $58,750, while those with less than high school education have the smallest earnings of $31,250.
| Educational Attainment | Male Income | Female Income |
| Less than High School | $36,250 | $31,250 |
| High School Diploma | $42,273 | $32,000 |
| College or Associate's Degree | $69,375 | $40,375 |
| Bachelor's Degree | - | - |
| Graduate Degree | $185,625 | $0 |
| Total | $46,618 | $37,019 |
Family Income in Port Gamble Tribal Community
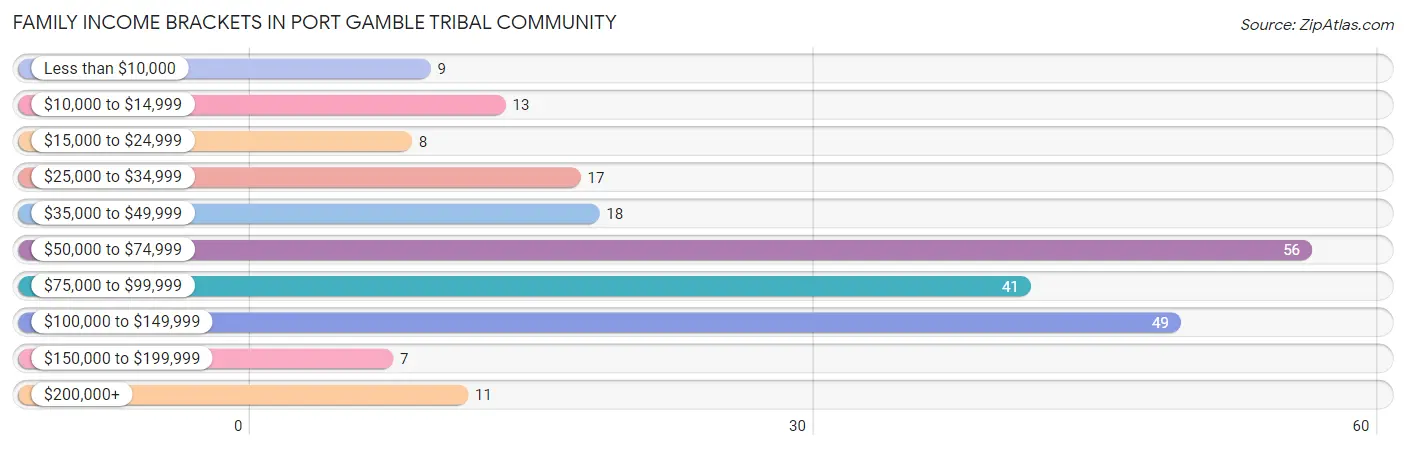
Family Income Brackets in Port Gamble Tribal Community
According to the Port Gamble Tribal Community family income data, there are 56 families falling into the $50,000 to $74,999 income range, which is the most common income bracket and makes up 24.4% of all families. Conversely, the $150,000 to $199,999 income bracket is the least frequent group with only 7 families (3.1%) belonging to this category.
| Income Bracket | # Families | % Families |
| Less than $10,000 | 9 | 3.9% |
| $10,000 to $14,999 | 13 | 5.7% |
| $15,000 to $24,999 | 8 | 3.5% |
| $25,000 to $34,999 | 17 | 7.4% |
| $35,000 to $49,999 | 18 | 7.9% |
| $50,000 to $74,999 | 56 | 24.5% |
| $75,000 to $99,999 | 41 | 17.9% |
| $100,000 to $149,999 | 49 | 21.4% |
| $150,000 to $199,999 | 7 | 3.1% |
| $200,000+ | 11 | 4.8% |
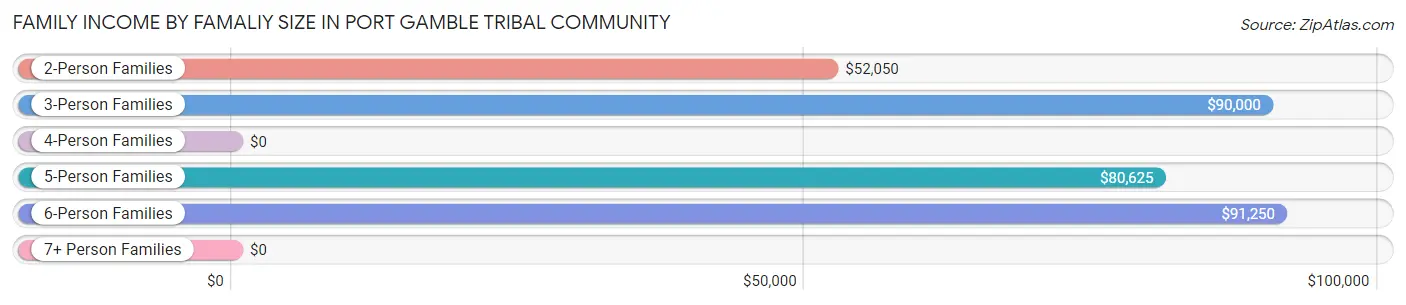
Family Income by Famaliy Size in Port Gamble Tribal Community
6-person families (4 | 1.8%) account for the highest median family income in Port Gamble Tribal Community with $91,250 per family, while 3-person families (46 | 20.1%) have the highest median income of $30,000 per family member.
| Income Bracket | # Families | Median Income |
| 2-Person Families | 125 (54.6%) | $52,050 |
| 3-Person Families | 46 (20.1%) | $90,000 |
| 4-Person Families | 29 (12.7%) | $0 |
| 5-Person Families | 25 (10.9%) | $80,625 |
| 6-Person Families | 4 (1.8%) | $91,250 |
| 7+ Person Families | 0 (0.0%) | $0 |
| Total | 229 (100.0%) | $68,750 |
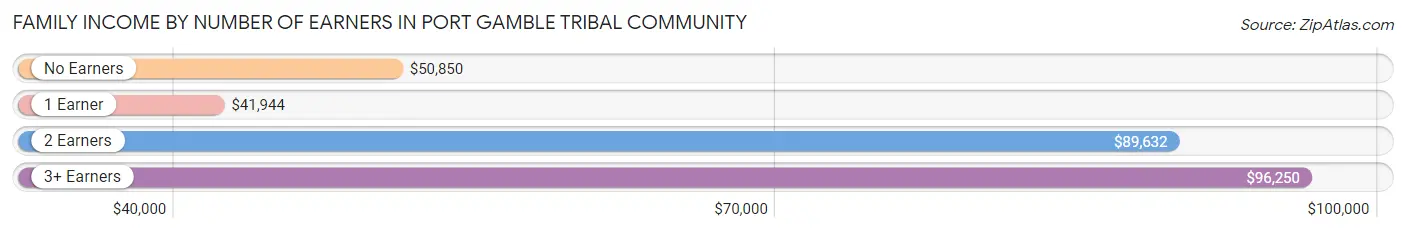
Family Income by Number of Earners in Port Gamble Tribal Community
The median family income in Port Gamble Tribal Community is $68,750, with families comprising 3+ earners (23) having the highest median family income of $96,250, while families with 1 earner (62) have the lowest median family income of $41,944, accounting for 10.0% and 27.1% of families, respectively.
| Number of Earners | # Families | Median Income |
| No Earners | 63 (27.5%) | $50,850 |
| 1 Earner | 62 (27.1%) | $41,944 |
| 2 Earners | 81 (35.4%) | $89,632 |
| 3+ Earners | 23 (10.0%) | $96,250 |
| Total | 229 (100.0%) | $68,750 |
Household Income in Port Gamble Tribal Community
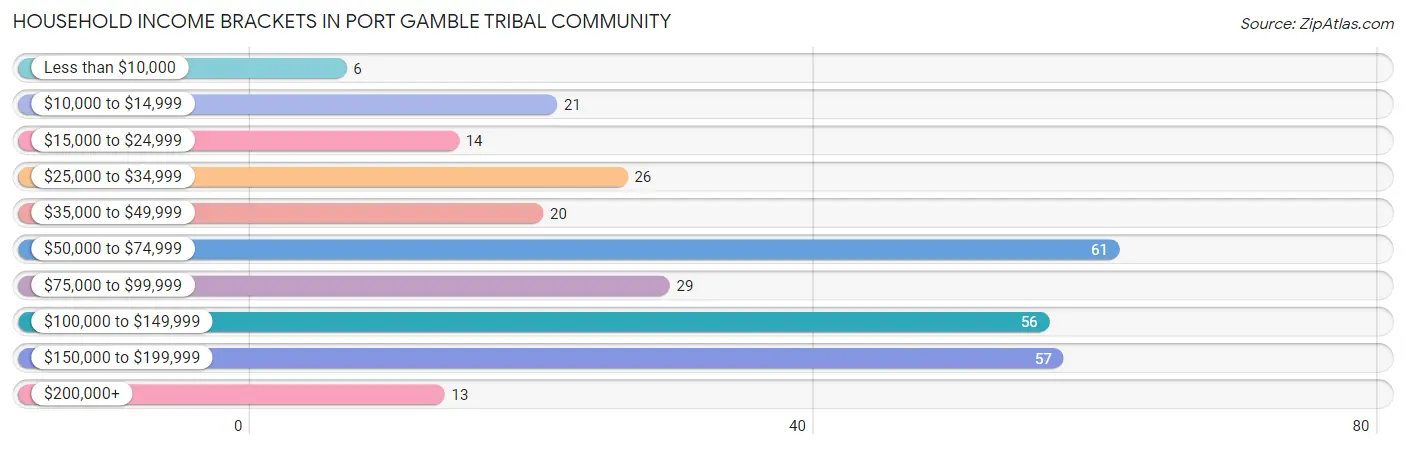
Household Income Brackets in Port Gamble Tribal Community
With 61 households falling in the category, the $50,000 to $74,999 income range is the most frequent in Port Gamble Tribal Community, accounting for 20.1% of all households. In contrast, only 6 households (2.0%) fall into the less than $10,000 income bracket, making it the least populous group.
| Income Bracket | # Households | % Households |
| Less than $10,000 | 6 | 2.0% |
| $10,000 to $14,999 | 21 | 6.9% |
| $15,000 to $24,999 | 14 | 4.6% |
| $25,000 to $34,999 | 26 | 8.6% |
| $35,000 to $49,999 | 20 | 6.6% |
| $50,000 to $74,999 | 61 | 20.1% |
| $75,000 to $99,999 | 29 | 9.6% |
| $100,000 to $149,999 | 56 | 18.5% |
| $150,000 to $199,999 | 57 | 18.8% |
| $200,000+ | 13 | 4.3% |
Household Income by Householder Age in Port Gamble Tribal Community
The median household income in Port Gamble Tribal Community is $77,188, with the highest median household income of $87,500 found in the 45 to 64 years age bracket for the primary householder. A total of 106 households (35.0%) fall into this category. Meanwhile, the 15 to 24 years age bracket for the primary householder has the lowest median household income of $0, with 7 households (2.3%) in this group.
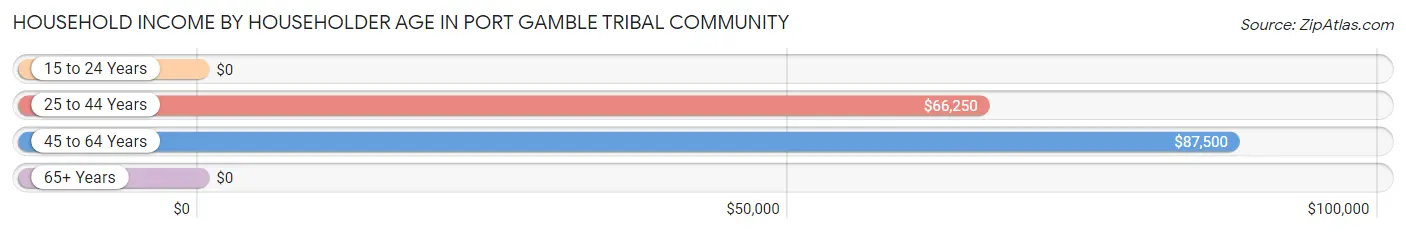
| Income Bracket | # Households | Median Income |
| 15 to 24 Years | 7 (2.3%) | $0 |
| 25 to 44 Years | 85 (28.1%) | $66,250 |
| 45 to 64 Years | 106 (35.0%) | $87,500 |
| 65+ Years | 105 (34.6%) | $0 |
| Total | 303 (100.0%) | $77,188 |
Poverty in Port Gamble Tribal Community
Income Below Poverty by Sex and Age in Port Gamble Tribal Community
With 17.9% poverty level for males and 16.7% for females among the residents of Port Gamble Tribal Community, 15 year old males and 15 year old females are the most vulnerable to poverty, with 3 males (42.9%) and 1 females (100.0%) in their respective age groups living below the poverty level.
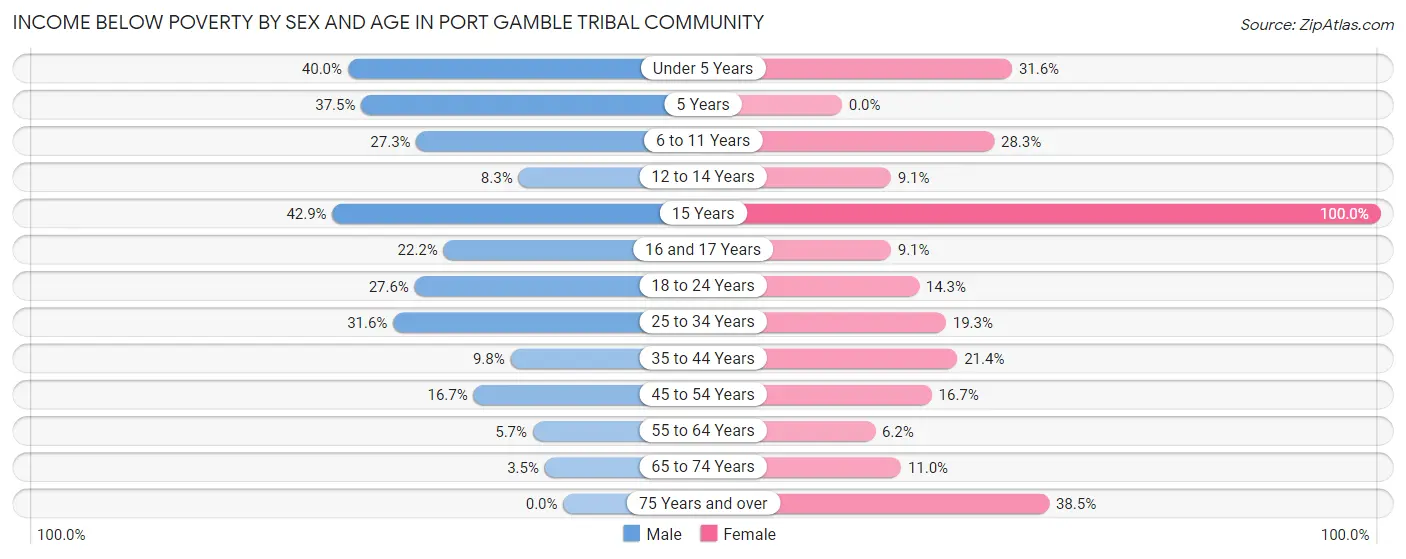
| Age Bracket | Male | Female |
| Under 5 Years | 8 (40.0%) | 6 (31.6%) |
| 5 Years | 3 (37.5%) | 0 (0.0%) |
| 6 to 11 Years | 9 (27.3%) | 13 (28.3%) |
| 12 to 14 Years | 1 (8.3%) | 2 (9.1%) |
| 15 Years | 3 (42.9%) | 1 (100.0%) |
| 16 and 17 Years | 2 (22.2%) | 1 (9.1%) |
| 18 to 24 Years | 8 (27.6%) | 6 (14.3%) |
| 25 to 34 Years | 18 (31.6%) | 11 (19.3%) |
| 35 to 44 Years | 5 (9.8%) | 9 (21.4%) |
| 45 to 54 Years | 7 (16.7%) | 8 (16.7%) |
| 55 to 64 Years | 3 (5.7%) | 4 (6.1%) |
| 65 to 74 Years | 1 (3.5%) | 9 (11.0%) |
| 75 Years and over | 0 (0.0%) | 5 (38.5%) |
| Total | 68 (17.9%) | 75 (16.7%) |
Income Above Poverty by Sex and Age in Port Gamble Tribal Community
According to the poverty statistics in Port Gamble Tribal Community, males aged 75 years and over and females aged 5 years are the age groups that are most secure financially, with 100.0% of males and 100.0% of females in these age groups living above the poverty line.
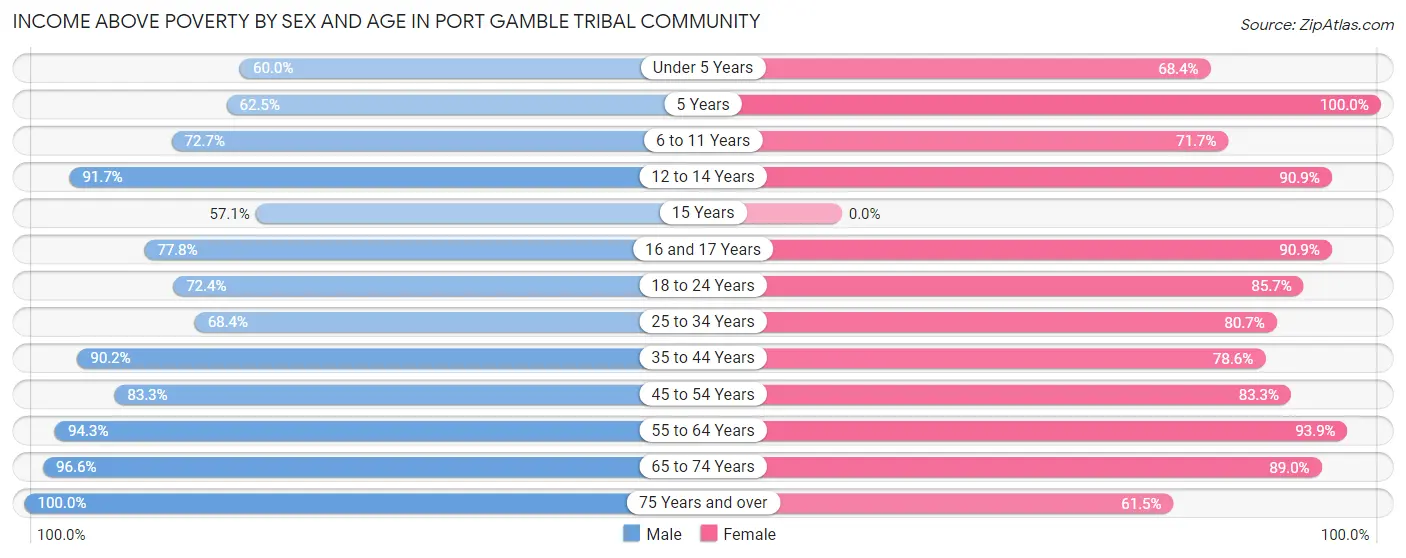
| Age Bracket | Male | Female |
| Under 5 Years | 12 (60.0%) | 13 (68.4%) |
| 5 Years | 5 (62.5%) | 1 (100.0%) |
| 6 to 11 Years | 24 (72.7%) | 33 (71.7%) |
| 12 to 14 Years | 11 (91.7%) | 20 (90.9%) |
| 15 Years | 4 (57.1%) | 0 (0.0%) |
| 16 and 17 Years | 7 (77.8%) | 10 (90.9%) |
| 18 to 24 Years | 21 (72.4%) | 36 (85.7%) |
| 25 to 34 Years | 39 (68.4%) | 46 (80.7%) |
| 35 to 44 Years | 46 (90.2%) | 33 (78.6%) |
| 45 to 54 Years | 35 (83.3%) | 40 (83.3%) |
| 55 to 64 Years | 50 (94.3%) | 61 (93.9%) |
| 65 to 74 Years | 28 (96.6%) | 73 (89.0%) |
| 75 Years and over | 29 (100.0%) | 8 (61.5%) |
| Total | 311 (82.1%) | 374 (83.3%) |
Income Below Poverty Among Married-Couple Families in Port Gamble Tribal Community
The poverty statistics for married-couple families in Port Gamble Tribal Community show that 2.4% or 3 of the total 123 families live below the poverty line. Families with 3 or 4 children have the highest poverty rate of 10.0%, comprising of 2 families. On the other hand, families with no children have the lowest poverty rate of 0.0%, which includes 0 families.
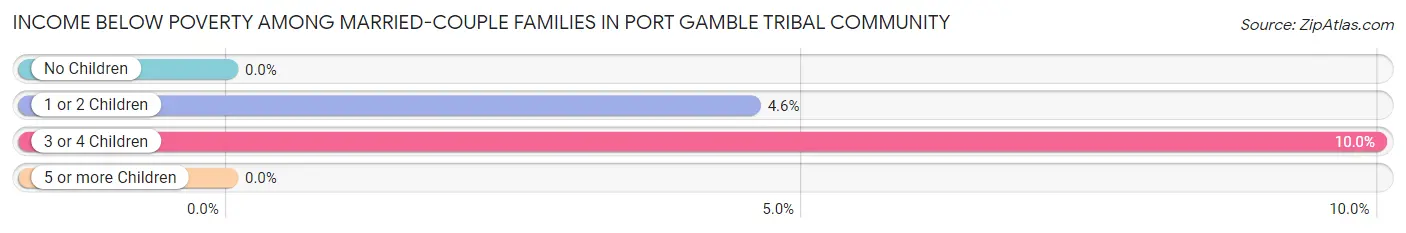
| Children | Above Poverty | Below Poverty |
| No Children | 81 (100.0%) | 0 (0.0%) |
| 1 or 2 Children | 21 (95.5%) | 1 (4.5%) |
| 3 or 4 Children | 18 (90.0%) | 2 (10.0%) |
| 5 or more Children | 0 (0.0%) | 0 (0.0%) |
| Total | 120 (97.6%) | 3 (2.4%) |
Income Below Poverty Among Single-Parent Households in Port Gamble Tribal Community
According to the poverty data in Port Gamble Tribal Community, 17.1% or 7 single-father households and 30.8% or 20 single-mother households are living below the poverty line. Among single-father households, those with 3 or 4 children have the highest poverty rate, with 4 households (100.0%) experiencing poverty. Likewise, among single-mother households, those with no children have the highest poverty rate, with 13 households (54.2%) falling below the poverty line.
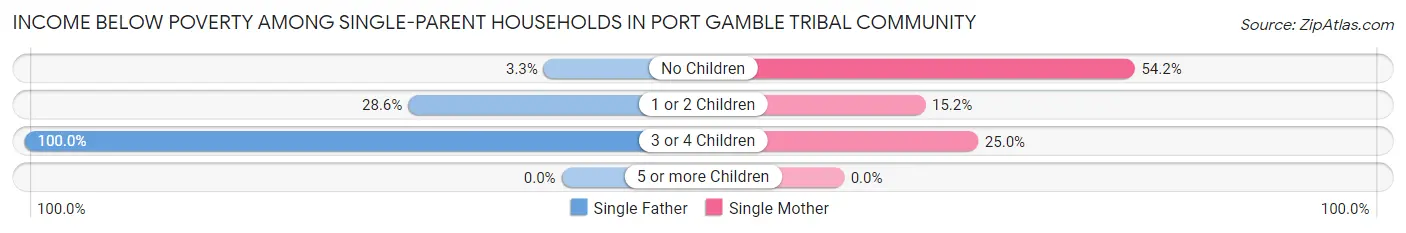
| Children | Single Father | Single Mother |
| No Children | 1 (3.3%) | 13 (54.2%) |
| 1 or 2 Children | 2 (28.6%) | 5 (15.1%) |
| 3 or 4 Children | 4 (100.0%) | 2 (25.0%) |
| 5 or more Children | 0 (0.0%) | 0 (0.0%) |
| Total | 7 (17.1%) | 20 (30.8%) |
Income Below Poverty Among Married-Couple vs Single-Parent Households in Port Gamble Tribal Community
The poverty data for Port Gamble Tribal Community shows that 3 of the married-couple family households (2.4%) and 27 of the single-parent households (25.5%) are living below the poverty level. Within the married-couple family households, those with 3 or 4 children have the highest poverty rate, with 2 households (10.0%) falling below the poverty line. Among the single-parent households, those with 3 or 4 children have the highest poverty rate, with 6 household (50.0%) living below poverty.
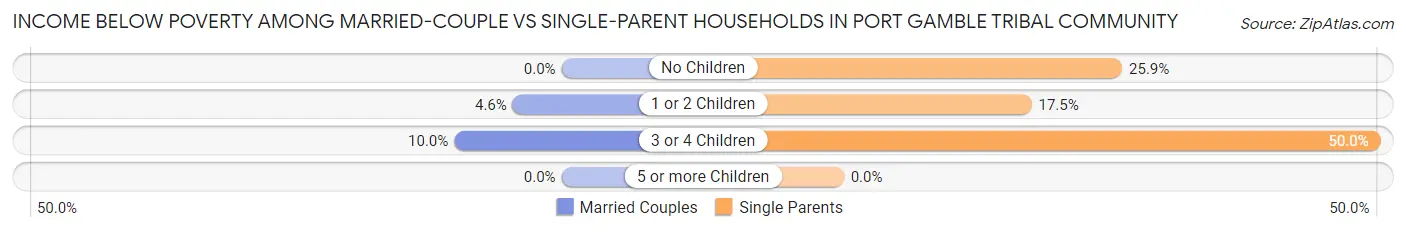
| Children | Married-Couple Families | Single-Parent Households |
| No Children | 0 (0.0%) | 14 (25.9%) |
| 1 or 2 Children | 1 (4.5%) | 7 (17.5%) |
| 3 or 4 Children | 2 (10.0%) | 6 (50.0%) |
| 5 or more Children | 0 (0.0%) | 0 (0.0%) |
| Total | 3 (2.4%) | 27 (25.5%) |
Race in Port Gamble Tribal Community
The most populous races in Port Gamble Tribal Community are Native / Alaskan (432 | 50.8%), White / Caucasian (269 | 31.7%), and Two or more Races (114 | 13.4%).
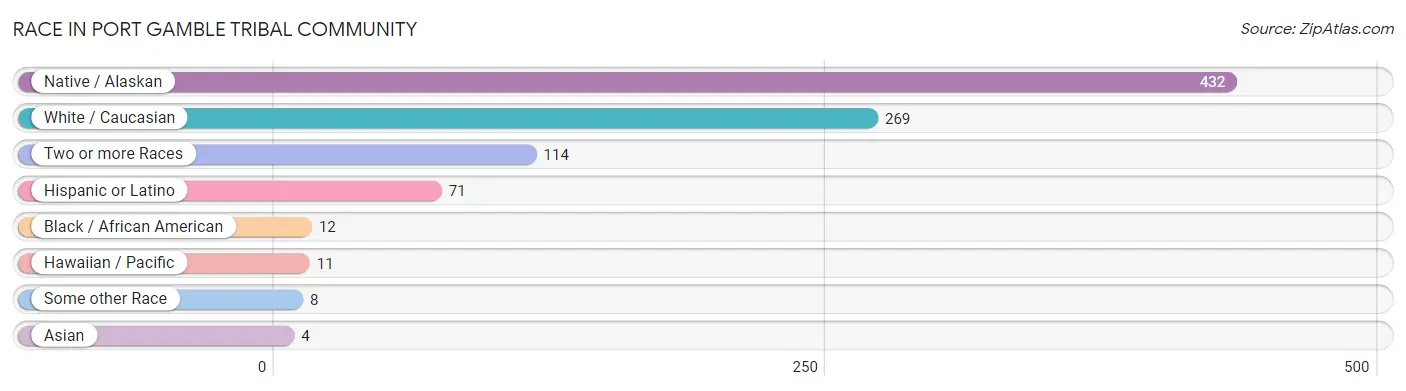
| Race | # Population | % Population |
| Asian | 4 | 0.5% |
| Black / African American | 12 | 1.4% |
| Hawaiian / Pacific | 11 | 1.3% |
| Hispanic or Latino | 71 | 8.4% |
| Native / Alaskan | 432 | 50.8% |
| White / Caucasian | 269 | 31.7% |
| Two or more Races | 114 | 13.4% |
| Some other Race | 8 | 0.9% |
| Total | 850 | 100.0% |
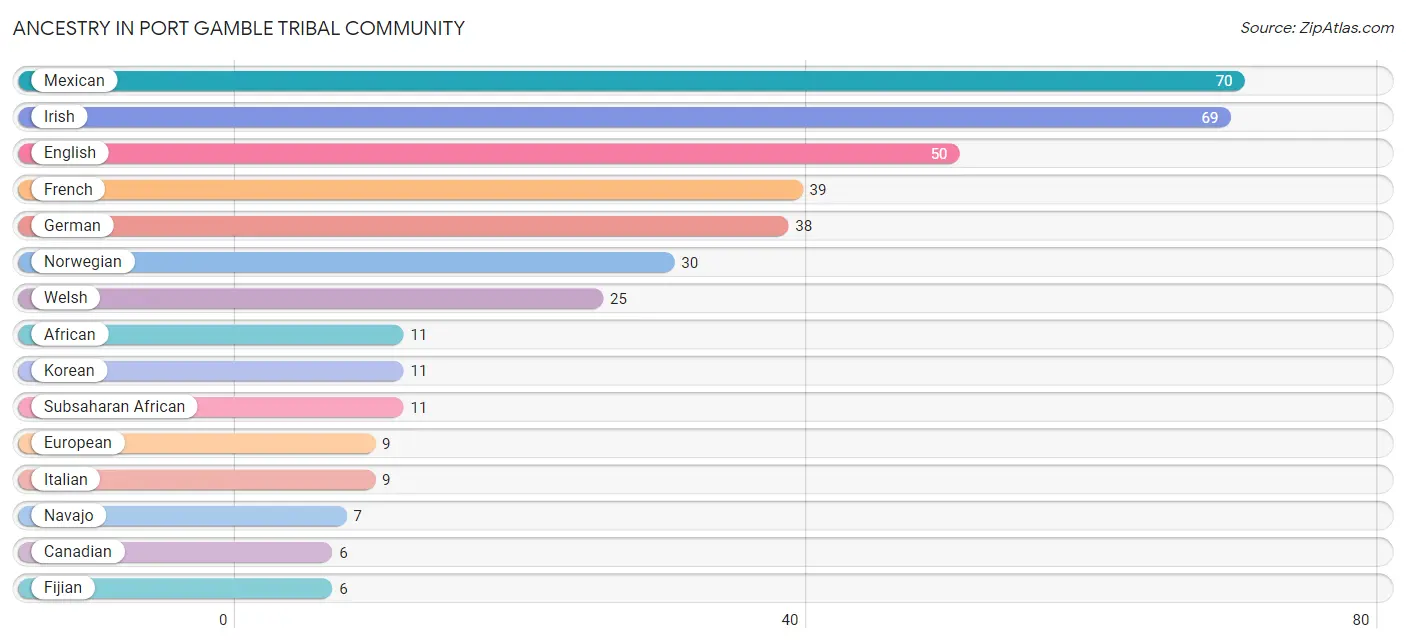
Ancestry in Port Gamble Tribal Community
The most populous ancestries reported in Port Gamble Tribal Community are Mexican (70 | 8.2%), Irish (69 | 8.1%), English (50 | 5.9%), French (39 | 4.6%), and German (38 | 4.5%), together accounting for 31.3% of all Port Gamble Tribal Community residents.
| Ancestry | # Population | % Population |
| African | 11 | 1.3% |
| Alaska Native | 1 | 0.1% |
| American | 1 | 0.1% |
| Blackfeet | 1 | 0.1% |
| Burmese | 1 | 0.1% |
| Canadian | 6 | 0.7% |
| Chippewa | 2 | 0.2% |
| Colville | 2 | 0.2% |
| English | 50 | 5.9% |
| European | 9 | 1.1% |
| Fijian | 6 | 0.7% |
| French | 39 | 4.6% |
| French American Indian | 3 | 0.4% |
| German | 38 | 4.5% |
| Greek | 1 | 0.1% |
| Guamanian / Chamorro | 5 | 0.6% |
| Irish | 69 | 8.1% |
| Italian | 9 | 1.1% |
| Korean | 11 | 1.3% |
| Mexican | 70 | 8.2% |
| Native Hawaiian | 2 | 0.2% |
| Navajo | 7 | 0.8% |
| Norwegian | 30 | 3.5% |
| Polish | 1 | 0.1% |
| Portuguese | 2 | 0.2% |
| Puget Sound Salish | 5 | 0.6% |
| Russian | 2 | 0.2% |
| Scotch-Irish | 3 | 0.4% |
| Scottish | 5 | 0.6% |
| Sierra Leonean | 6 | 0.7% |
| Spanish | 1 | 0.1% |
| Subsaharan African | 11 | 1.3% |
| Swedish | 5 | 0.6% |
| Tlingit-Haida | 2 | 0.2% |
| Welsh | 25 | 2.9% |
| Yugoslavian | 1 | 0.1% | View All 36 Rows |
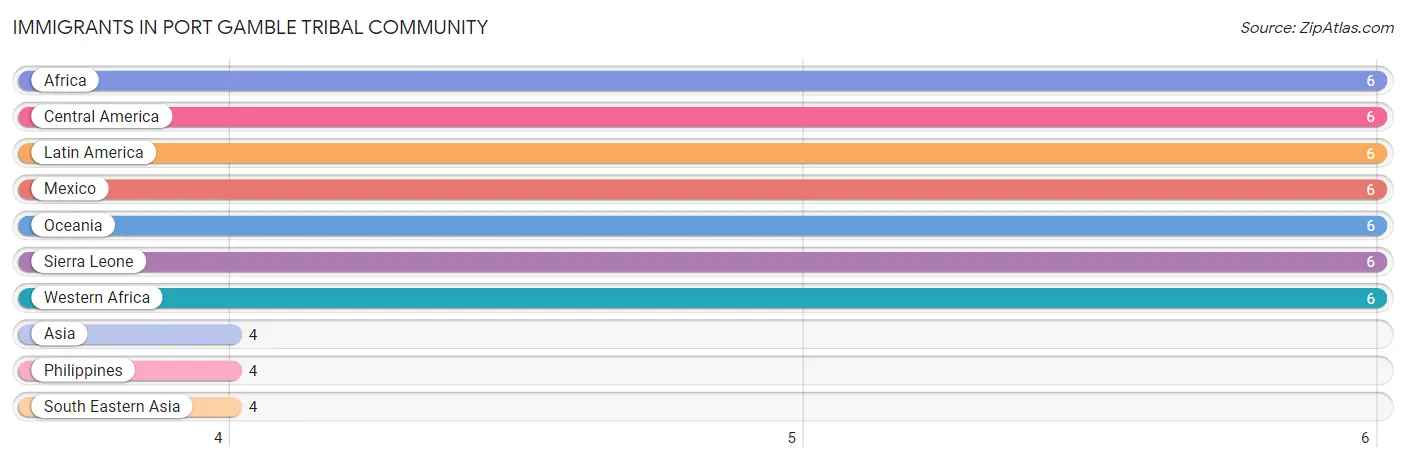
Immigrants in Port Gamble Tribal Community
The most numerous immigrant groups reported in Port Gamble Tribal Community came from Africa (6 | 0.7%), Central America (6 | 0.7%), Latin America (6 | 0.7%), Mexico (6 | 0.7%), and Oceania (6 | 0.7%), together accounting for 3.6% of all Port Gamble Tribal Community residents.
| Immigration Origin | # Population | % Population |
| Africa | 6 | 0.7% |
| Asia | 4 | 0.5% |
| Central America | 6 | 0.7% |
| Latin America | 6 | 0.7% |
| Mexico | 6 | 0.7% |
| Oceania | 6 | 0.7% |
| Philippines | 4 | 0.5% |
| Sierra Leone | 6 | 0.7% |
| South Eastern Asia | 4 | 0.5% |
| Western Africa | 6 | 0.7% | View All 10 Rows |
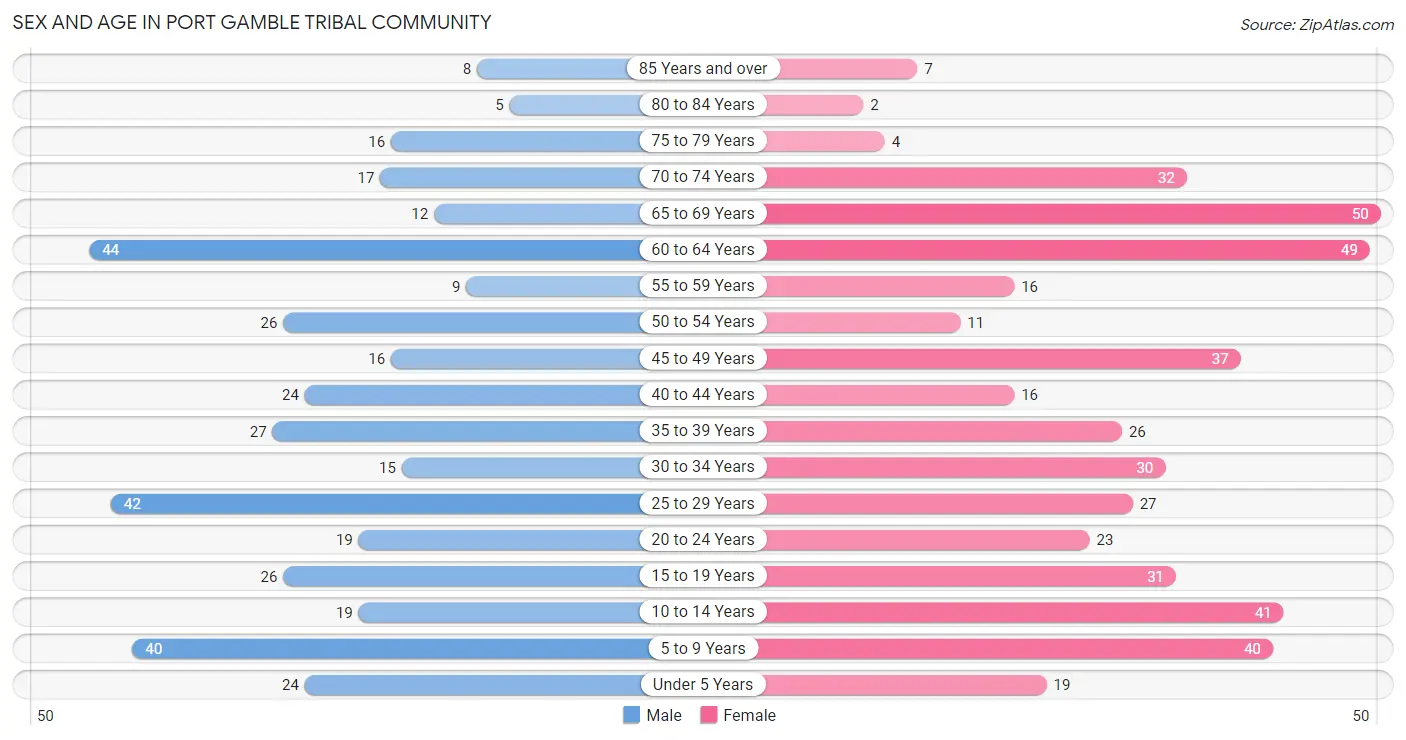
Sex and Age in Port Gamble Tribal Community
Sex and Age in Port Gamble Tribal Community
The most populous age groups in Port Gamble Tribal Community are 60 to 64 Years (44 | 11.3%) for men and 65 to 69 Years (50 | 10.8%) for women.
| Age Bracket | Male | Female |
| Under 5 Years | 24 (6.2%) | 19 (4.1%) |
| 5 to 9 Years | 40 (10.3%) | 40 (8.7%) |
| 10 to 14 Years | 19 (4.9%) | 41 (8.9%) |
| 15 to 19 Years | 26 (6.7%) | 31 (6.7%) |
| 20 to 24 Years | 19 (4.9%) | 23 (5.0%) |
| 25 to 29 Years | 42 (10.8%) | 27 (5.9%) |
| 30 to 34 Years | 15 (3.9%) | 30 (6.5%) |
| 35 to 39 Years | 27 (6.9%) | 26 (5.6%) |
| 40 to 44 Years | 24 (6.2%) | 16 (3.5%) |
| 45 to 49 Years | 16 (4.1%) | 37 (8.0%) |
| 50 to 54 Years | 26 (6.7%) | 11 (2.4%) |
| 55 to 59 Years | 9 (2.3%) | 16 (3.5%) |
| 60 to 64 Years | 44 (11.3%) | 49 (10.6%) |
| 65 to 69 Years | 12 (3.1%) | 50 (10.8%) |
| 70 to 74 Years | 17 (4.4%) | 32 (6.9%) |
| 75 to 79 Years | 16 (4.1%) | 4 (0.9%) |
| 80 to 84 Years | 5 (1.3%) | 2 (0.4%) |
| 85 Years and over | 8 (2.1%) | 7 (1.5%) |
| Total | 389 (100.0%) | 461 (100.0%) |
Families and Households in Port Gamble Tribal Community
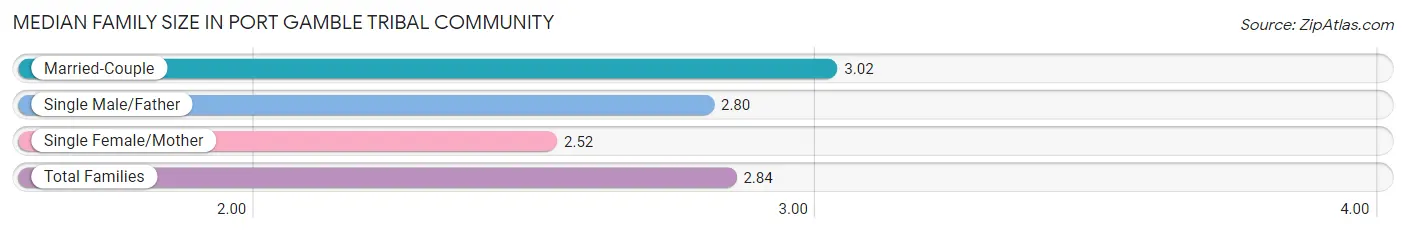
Median Family Size in Port Gamble Tribal Community
The median family size in Port Gamble Tribal Community is 2.84 persons per family, with married-couple families (123 | 53.7%) accounting for the largest median family size of 3.02 persons per family. On the other hand, single female/mother families (65 | 28.4%) represent the smallest median family size with 2.52 persons per family.
| Family Type | # Families | Family Size |
| Married-Couple | 123 (53.7%) | 3.02 |
| Single Male/Father | 41 (17.9%) | 2.80 |
| Single Female/Mother | 65 (28.4%) | 2.52 |
| Total Families | 229 (100.0%) | 2.84 |
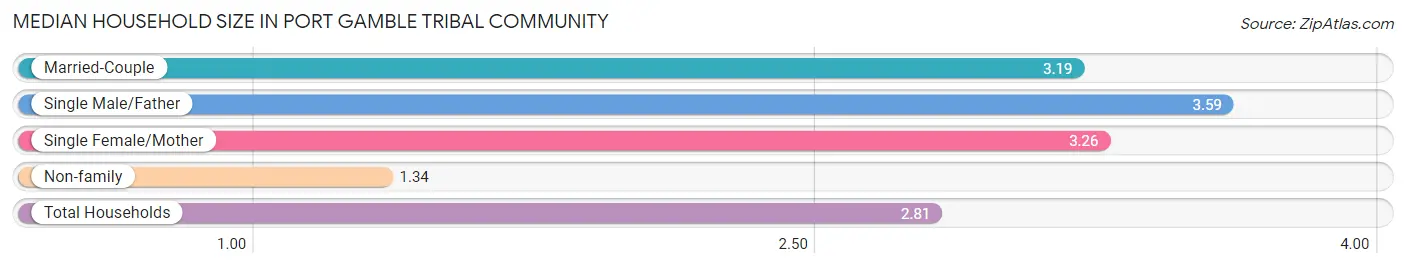
Median Household Size in Port Gamble Tribal Community
The median household size in Port Gamble Tribal Community is 2.81 persons per household, with single male/father households (41 | 13.5%) accounting for the largest median household size of 3.59 persons per household. non-family households (74 | 24.4%) represent the smallest median household size with 1.34 persons per household.
| Household Type | # Households | Household Size |
| Married-Couple | 123 (40.6%) | 3.19 |
| Single Male/Father | 41 (13.5%) | 3.59 |
| Single Female/Mother | 65 (21.4%) | 3.26 |
| Non-family | 74 (24.4%) | 1.34 |
| Total Households | 303 (100.0%) | 2.81 |
Household Size by Marriage Status in Port Gamble Tribal Community
Out of a total of 303 households in Port Gamble Tribal Community, 229 (75.6%) are family households, while 74 (24.4%) are nonfamily households. The most numerous type of family households are 2-person households, comprising 86, and the most common type of nonfamily households are 1-person households, comprising 60.
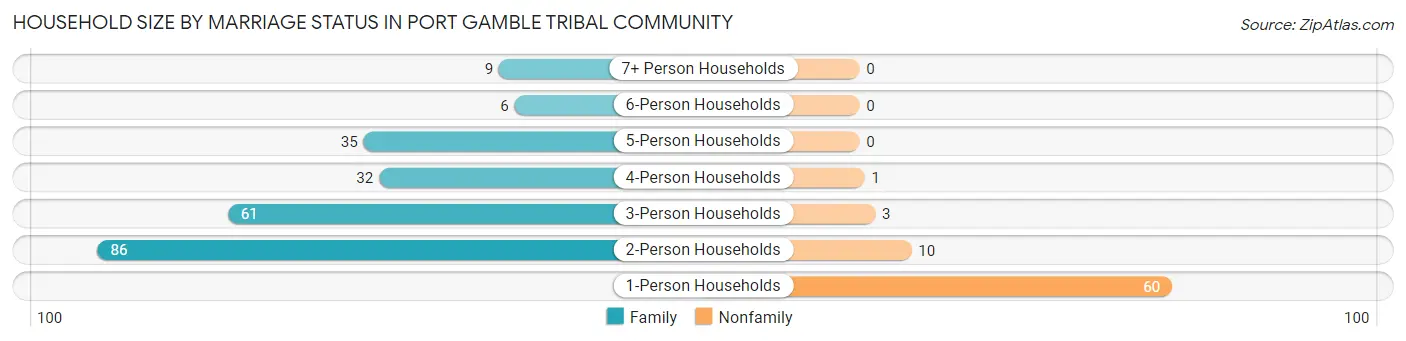
| Household Size | Family Households | Nonfamily Households |
| 1-Person Households | - | 60 (19.8%) |
| 2-Person Households | 86 (28.4%) | 10 (3.3%) |
| 3-Person Households | 61 (20.1%) | 3 (1.0%) |
| 4-Person Households | 32 (10.6%) | 1 (0.3%) |
| 5-Person Households | 35 (11.6%) | 0 (0.0%) |
| 6-Person Households | 6 (2.0%) | 0 (0.0%) |
| 7+ Person Households | 9 (3.0%) | 0 (0.0%) |
| Total | 229 (75.6%) | 74 (24.4%) |
Female Fertility in Port Gamble Tribal Community
Fertility by Age in Port Gamble Tribal Community
Average fertility rate in Port Gamble Tribal Community is 21.0 births per 1,000 women. Women in the age bracket of 20 to 34 years have the highest fertility rate with 50.0 births per 1,000 women. Women in the age bracket of 20 to 34 years acount for 100.0% of all women with births.
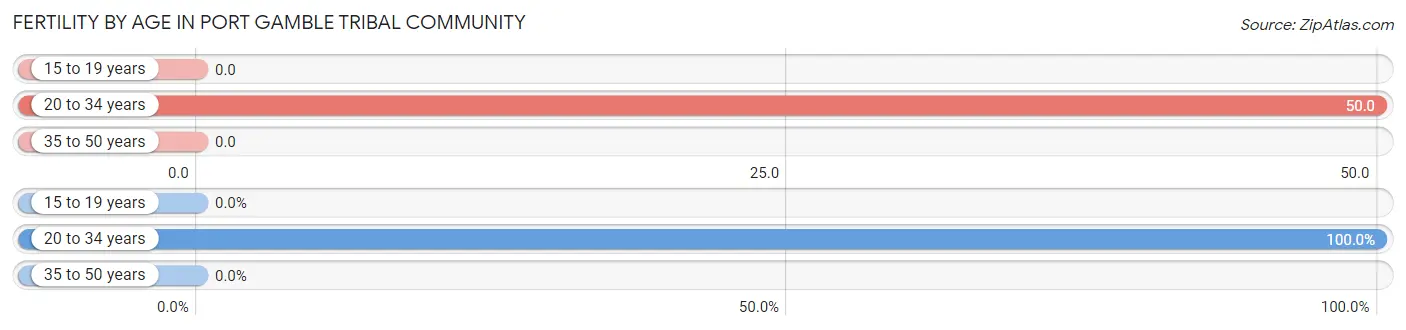
| Age Bracket | Women with Births | Births / 1,000 Women |
| 15 to 19 years | 0 (0.0%) | 0.0 |
| 20 to 34 years | 4 (100.0%) | 50.0 |
| 35 to 50 years | 0 (0.0%) | 0.0 |
| Total | 4 (100.0%) | 21.0 |
Fertility by Age by Marriage Status in Port Gamble Tribal Community
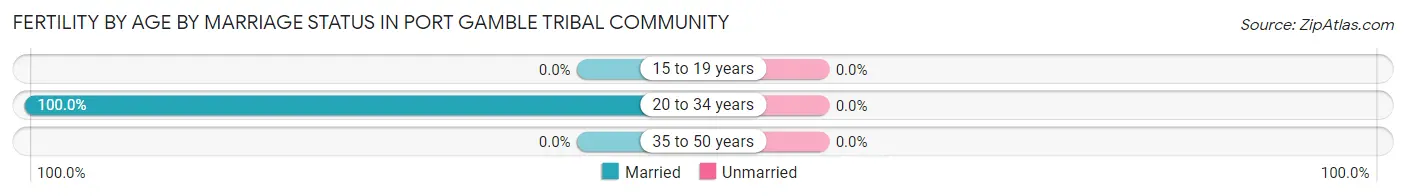
| Age Bracket | Married | Unmarried |
| 15 to 19 years | 0 (0.0%) | 0 (0.0%) |
| 20 to 34 years | 4 (100.0%) | 0 (0.0%) |
| 35 to 50 years | 0 (0.0%) | 0 (0.0%) |
| Total | 4 (100.0%) | 0 (0.0%) |
Fertility by Education in Port Gamble Tribal Community
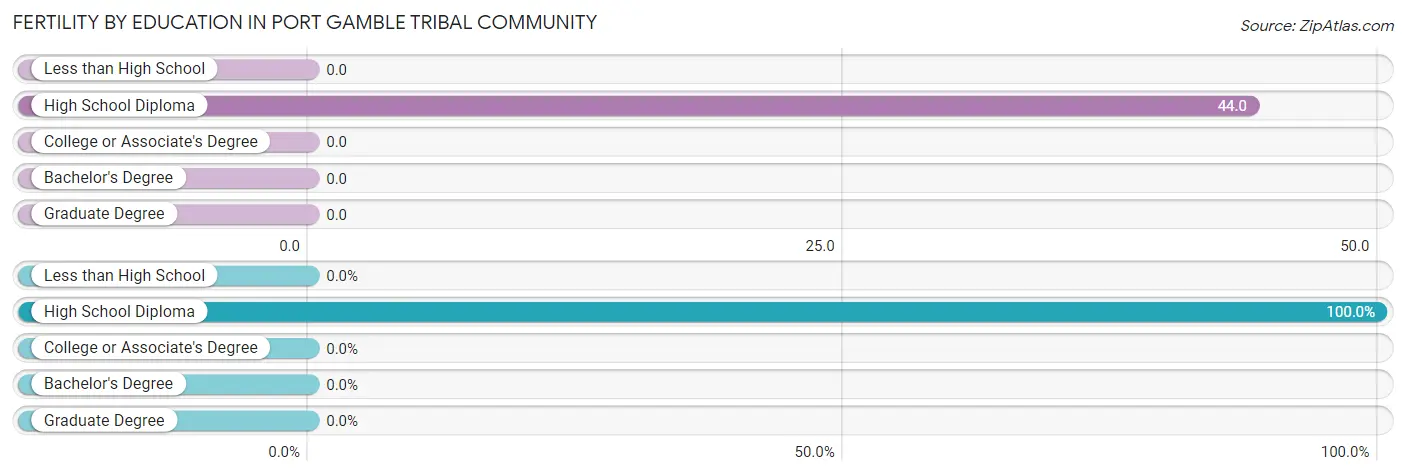
| Educational Attainment | Women with Births | Births / 1,000 Women |
| Less than High School | 0 (0.0%) | 0.0 |
| High School Diploma | 4 (100.0%) | 44.0 |
| College or Associate's Degree | 0 (0.0%) | 0.0 |
| Bachelor's Degree | 0 (0.0%) | 0.0 |
| Graduate Degree | 0 (0.0%) | 0.0 |
| Total | 4 (100.0%) | 21.0 |
Fertility by Education by Marriage Status in Port Gamble Tribal Community
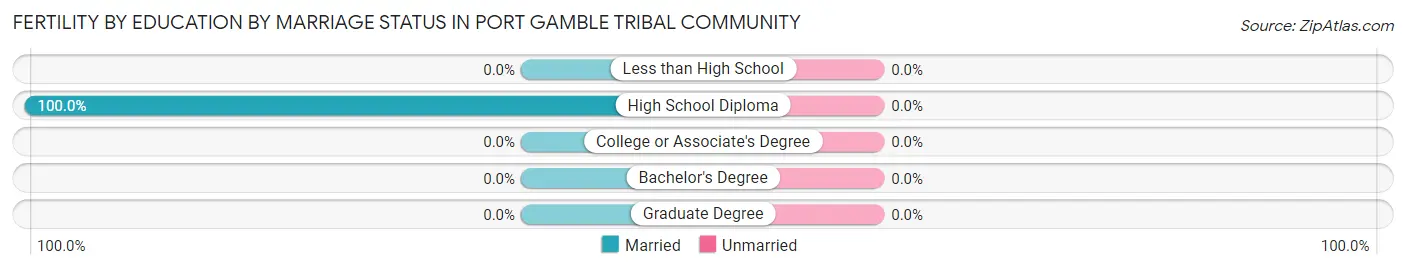
| Educational Attainment | Married | Unmarried |
| Less than High School | 0 (0.0%) | 0 (0.0%) |
| High School Diploma | 4 (100.0%) | 0 (0.0%) |
| College or Associate's Degree | 0 (0.0%) | 0 (0.0%) |
| Bachelor's Degree | 0 (0.0%) | 0 (0.0%) |
| Graduate Degree | 0 (0.0%) | 0 (0.0%) |
| Total | 4 (100.0%) | 0 (0.0%) |
Employment Characteristics in Port Gamble Tribal Community
Employment by Class of Employer in Port Gamble Tribal Community
Among the 346 employed individuals in Port Gamble Tribal Community, private company employees (124 | 35.8%), local government employees (100 | 28.9%), and federal government employees (57 | 16.5%) make up the most common classes of employment.
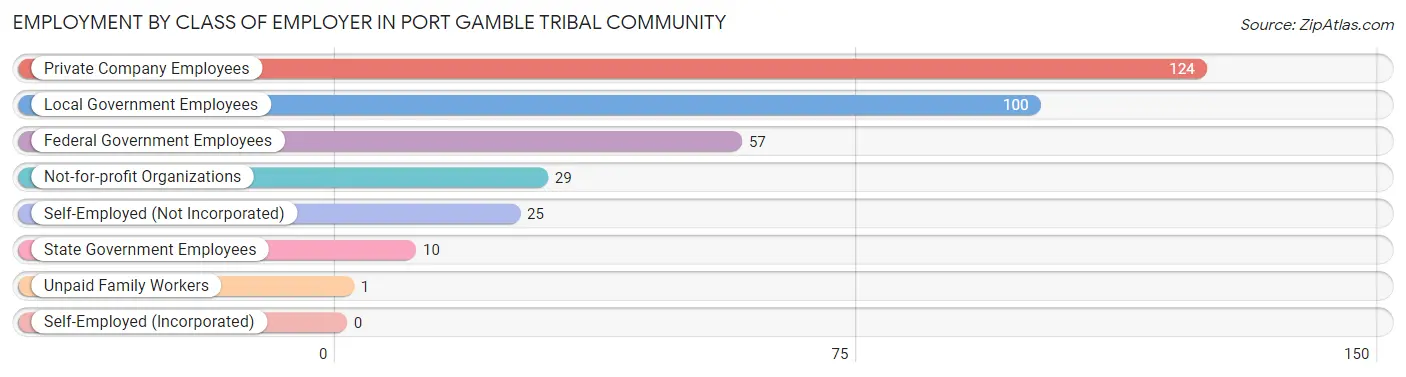
| Employer Class | # Employees | % Employees |
| Private Company Employees | 124 | 35.8% |
| Self-Employed (Incorporated) | 0 | 0.0% |
| Self-Employed (Not Incorporated) | 25 | 7.2% |
| Not-for-profit Organizations | 29 | 8.4% |
| Local Government Employees | 100 | 28.9% |
| State Government Employees | 10 | 2.9% |
| Federal Government Employees | 57 | 16.5% |
| Unpaid Family Workers | 1 | 0.3% |
| Total | 346 | 100.0% |
Employment Status by Age in Port Gamble Tribal Community
According to the labor force statistics for Port Gamble Tribal Community, out of the total population over 16 years of age (659), 56.8% or 374 individuals are in the labor force, with 7.2% or 27 of them unemployed. The age group with the highest labor force participation rate is 25 to 29 years, with 92.8% or 64 individuals in the labor force. Within the labor force, the 25 to 29 years age range has the highest percentage of unemployed individuals, with 17.2% or 11 of them being unemployed.
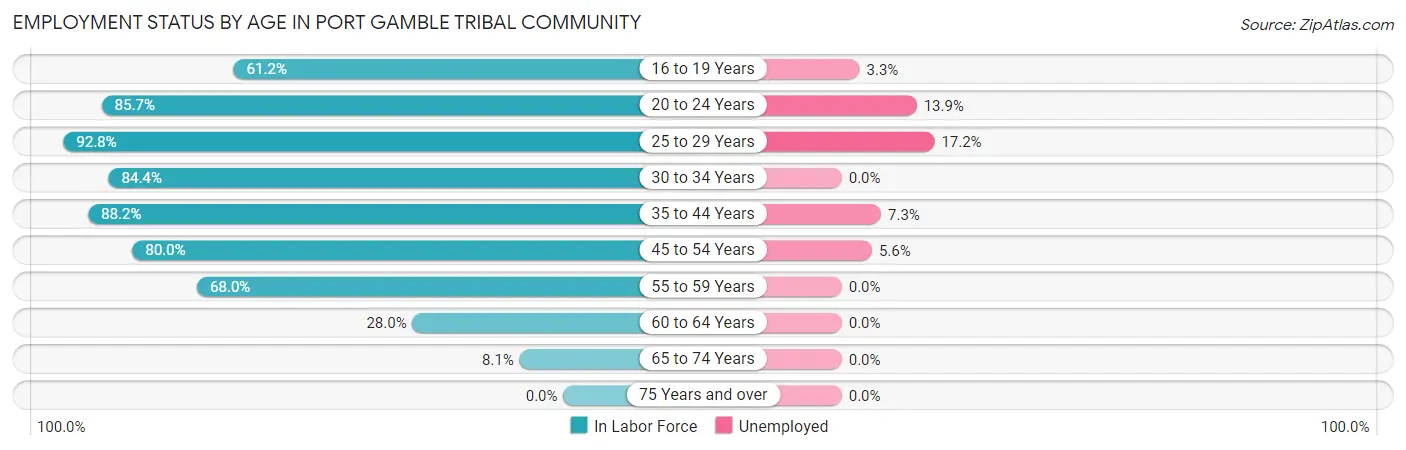
| Age Bracket | In Labor Force | Unemployed |
| 16 to 19 Years | 30 (61.2%) | 1 (3.3%) |
| 20 to 24 Years | 36 (85.7%) | 5 (13.9%) |
| 25 to 29 Years | 64 (92.8%) | 11 (17.2%) |
| 30 to 34 Years | 38 (84.4%) | 0 (0.0%) |
| 35 to 44 Years | 82 (88.2%) | 6 (7.3%) |
| 45 to 54 Years | 72 (80.0%) | 4 (5.6%) |
| 55 to 59 Years | 17 (68.0%) | 0 (0.0%) |
| 60 to 64 Years | 26 (28.0%) | 0 (0.0%) |
| 65 to 74 Years | 9 (8.1%) | 0 (0.0%) |
| 75 Years and over | 0 (0.0%) | 0 (0.0%) |
| Total | 374 (56.8%) | 27 (7.2%) |
Employment Status by Educational Attainment in Port Gamble Tribal Community
According to labor force statistics for Port Gamble Tribal Community, 72.0% of individuals (299) out of the total population between 25 and 64 years of age (415) are in the labor force, with 7.0% or 21 of them being unemployed. The group with the highest labor force participation rate are those with the educational attainment of college / associate degree, with 83.6% or 112 individuals in the labor force. Within the labor force, individuals with less than high school education have the highest percentage of unemployment, with 15.4% or 4 of them being unemployed.
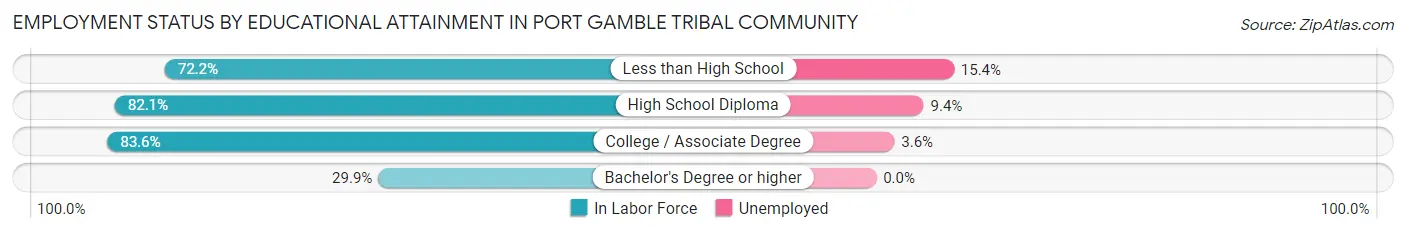
| Educational Attainment | In Labor Force | Unemployed |
| Less than High School | 26 (72.2%) | 6 (15.4%) |
| High School Diploma | 138 (82.1%) | 16 (9.4%) |
| College / Associate Degree | 112 (83.6%) | 5 (3.6%) |
| Bachelor's Degree or higher | 23 (29.9%) | 0 (0.0%) |
| Total | 299 (72.0%) | 29 (7.0%) |
Employment Occupations by Sex in Port Gamble Tribal Community
Management, Business, Science and Arts Occupations
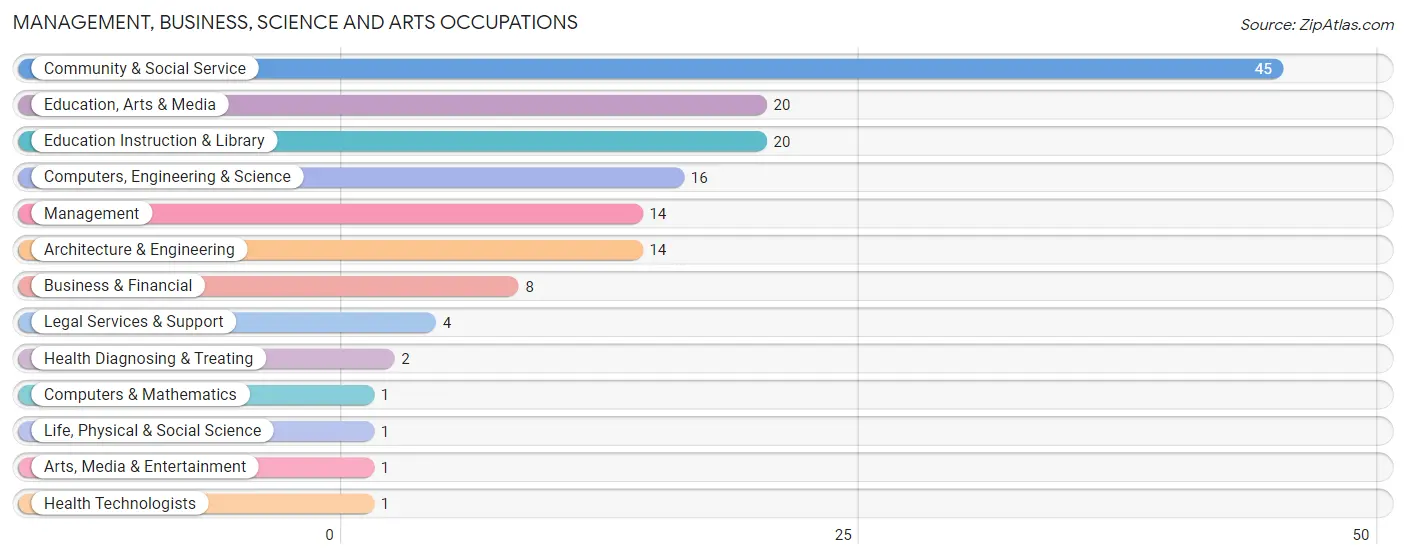
The most common Management, Business, Science and Arts occupations in Port Gamble Tribal Community are Community & Social Service (45 | 13.0%), Education, Arts & Media (20 | 5.8%), Education Instruction & Library (20 | 5.8%), Computers, Engineering & Science (16 | 4.6%), and Management (14 | 4.0%).
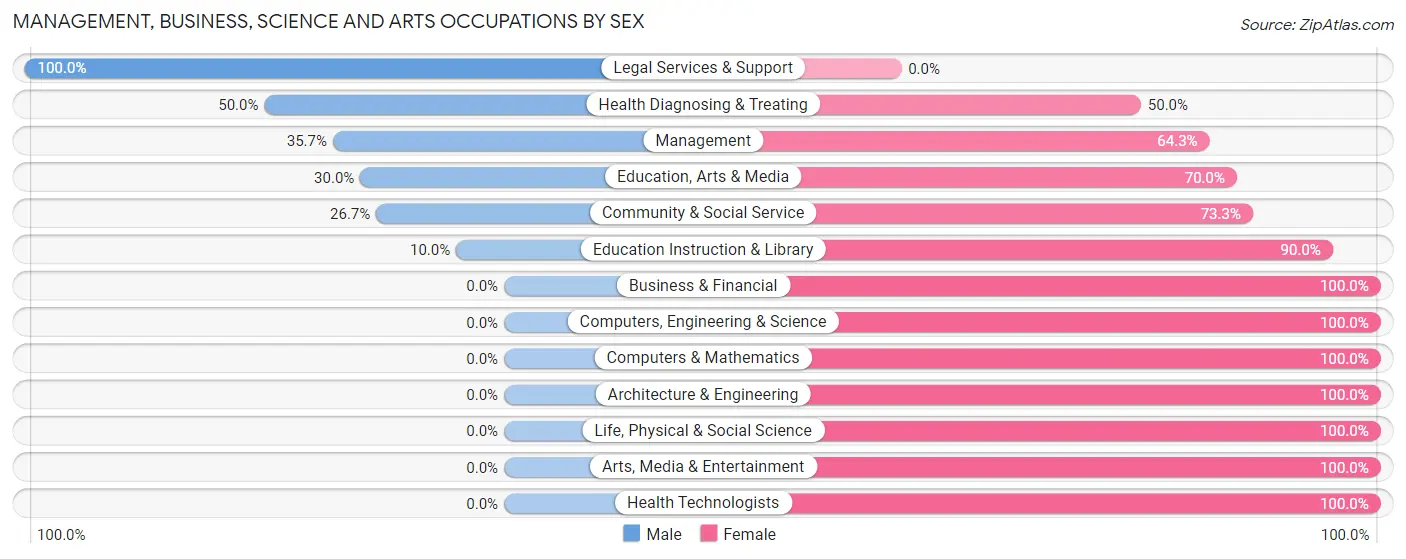
Management, Business, Science and Arts Occupations by Sex
Within the Management, Business, Science and Arts occupations in Port Gamble Tribal Community, the most male-oriented occupations are Legal Services & Support (100.0%), Health Diagnosing & Treating (50.0%), and Management (35.7%), while the most female-oriented occupations are Business & Financial (100.0%), Computers, Engineering & Science (100.0%), and Computers & Mathematics (100.0%).
| Occupation | Male | Female |
| Management | 5 (35.7%) | 9 (64.3%) |
| Business & Financial | 0 (0.0%) | 8 (100.0%) |
| Computers, Engineering & Science | 0 (0.0%) | 16 (100.0%) |
| Computers & Mathematics | 0 (0.0%) | 1 (100.0%) |
| Architecture & Engineering | 0 (0.0%) | 14 (100.0%) |
| Life, Physical & Social Science | 0 (0.0%) | 1 (100.0%) |
| Community & Social Service | 12 (26.7%) | 33 (73.3%) |
| Education, Arts & Media | 6 (30.0%) | 14 (70.0%) |
| Legal Services & Support | 4 (100.0%) | 0 (0.0%) |
| Education Instruction & Library | 2 (10.0%) | 18 (90.0%) |
| Arts, Media & Entertainment | 0 (0.0%) | 1 (100.0%) |
| Health Diagnosing & Treating | 1 (50.0%) | 1 (50.0%) |
| Health Technologists | 0 (0.0%) | 1 (100.0%) |
| Total (Category) | 18 (21.2%) | 67 (78.8%) |
| Total (Overall) | 158 (45.5%) | 189 (54.5%) |
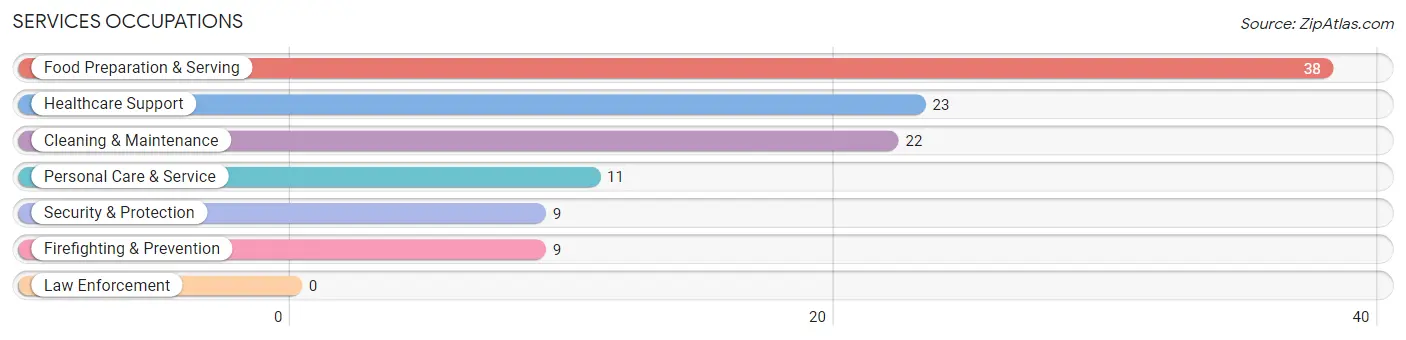
Services Occupations
The most common Services occupations in Port Gamble Tribal Community are Food Preparation & Serving (38 | 11.0%), Healthcare Support (23 | 6.6%), Cleaning & Maintenance (22 | 6.3%), Personal Care & Service (11 | 3.2%), and Security & Protection (9 | 2.6%).
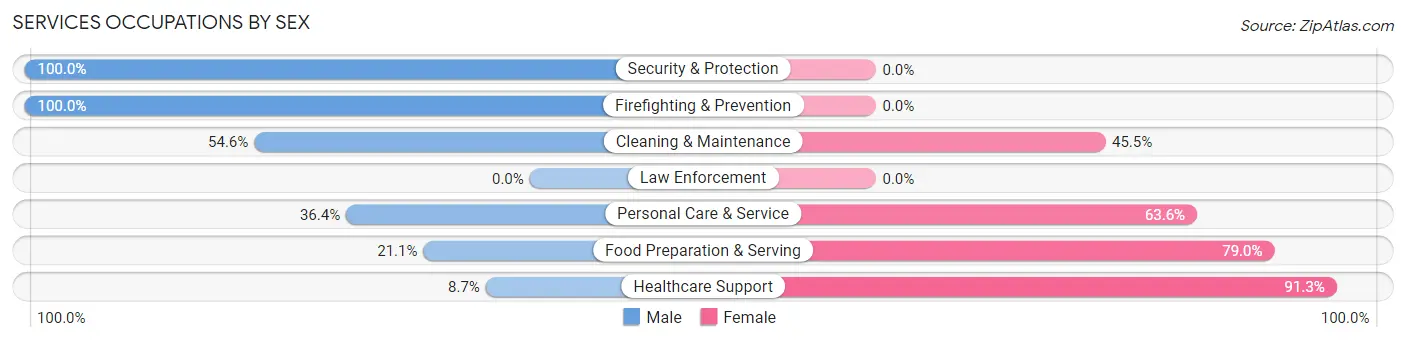
Services Occupations by Sex
Within the Services occupations in Port Gamble Tribal Community, the most male-oriented occupations are Security & Protection (100.0%), Firefighting & Prevention (100.0%), and Cleaning & Maintenance (54.5%), while the most female-oriented occupations are Healthcare Support (91.3%), Food Preparation & Serving (78.9%), and Personal Care & Service (63.6%).
| Occupation | Male | Female |
| Healthcare Support | 2 (8.7%) | 21 (91.3%) |
| Security & Protection | 9 (100.0%) | 0 (0.0%) |
| Firefighting & Prevention | 9 (100.0%) | 0 (0.0%) |
| Law Enforcement | 0 (0.0%) | 0 (0.0%) |
| Food Preparation & Serving | 8 (21.0%) | 30 (78.9%) |
| Cleaning & Maintenance | 12 (54.5%) | 10 (45.5%) |
| Personal Care & Service | 4 (36.4%) | 7 (63.6%) |
| Total (Category) | 35 (34.0%) | 68 (66.0%) |
| Total (Overall) | 158 (45.5%) | 189 (54.5%) |
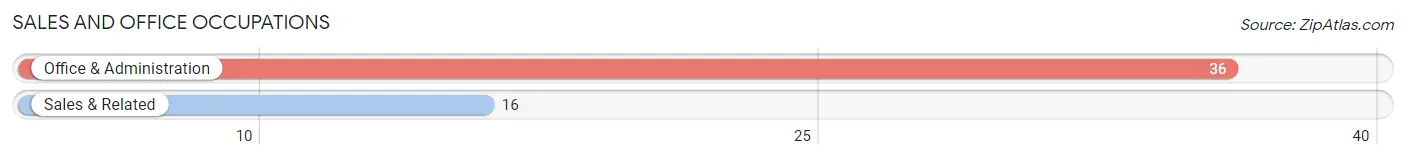
Sales and Office Occupations
The most common Sales and Office occupations in Port Gamble Tribal Community are Office & Administration (36 | 10.4%), and Sales & Related (16 | 4.6%).
Sales and Office Occupations by Sex
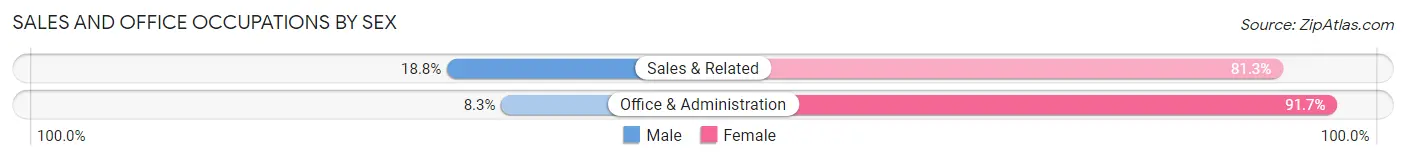
| Occupation | Male | Female |
| Sales & Related | 3 (18.8%) | 13 (81.2%) |
| Office & Administration | 3 (8.3%) | 33 (91.7%) |
| Total (Category) | 6 (11.5%) | 46 (88.5%) |
| Total (Overall) | 158 (45.5%) | 189 (54.5%) |
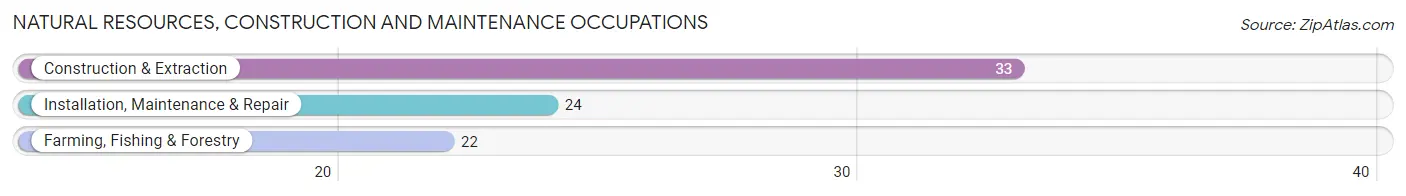
Natural Resources, Construction and Maintenance Occupations
The most common Natural Resources, Construction and Maintenance occupations in Port Gamble Tribal Community are Construction & Extraction (33 | 9.5%), Installation, Maintenance & Repair (24 | 6.9%), and Farming, Fishing & Forestry (22 | 6.3%).
Natural Resources, Construction and Maintenance Occupations by Sex
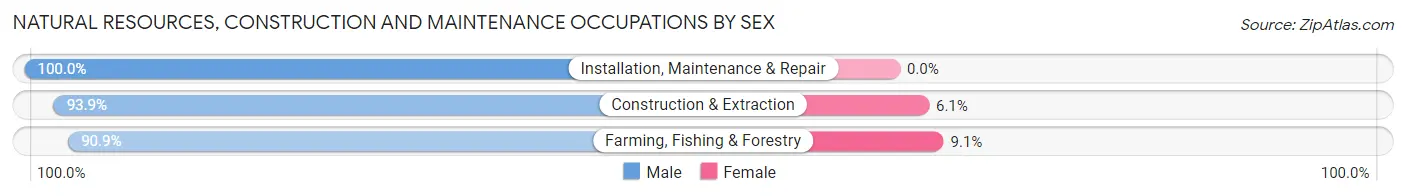
| Occupation | Male | Female |
| Farming, Fishing & Forestry | 20 (90.9%) | 2 (9.1%) |
| Construction & Extraction | 31 (93.9%) | 2 (6.1%) |
| Installation, Maintenance & Repair | 24 (100.0%) | 0 (0.0%) |
| Total (Category) | 75 (94.9%) | 4 (5.1%) |
| Total (Overall) | 158 (45.5%) | 189 (54.5%) |
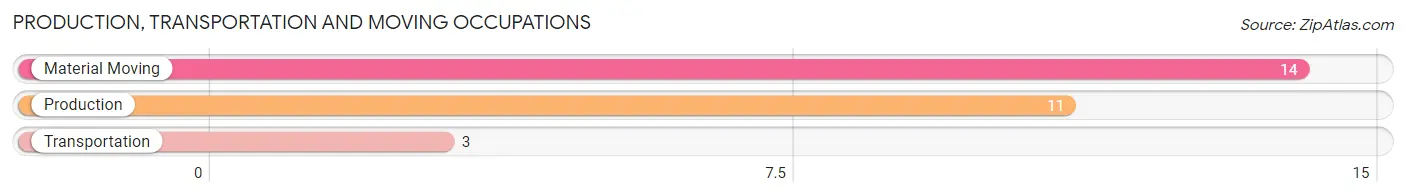
Production, Transportation and Moving Occupations
The most common Production, Transportation and Moving occupations in Port Gamble Tribal Community are Material Moving (14 | 4.0%), Production (11 | 3.2%), and Transportation (3 | 0.9%).
Production, Transportation and Moving Occupations by Sex
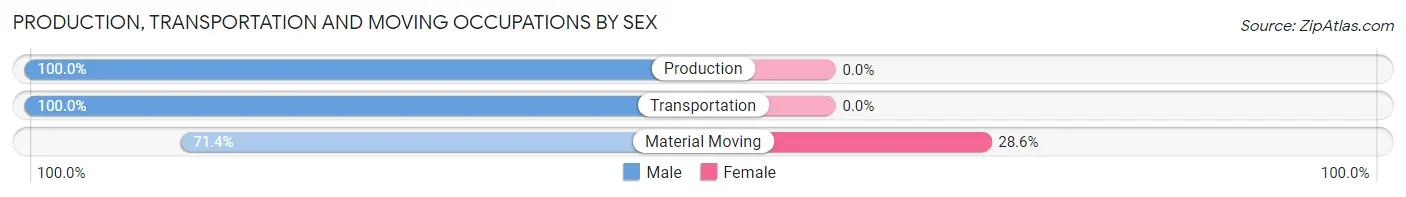
| Occupation | Male | Female |
| Production | 11 (100.0%) | 0 (0.0%) |
| Transportation | 3 (100.0%) | 0 (0.0%) |
| Material Moving | 10 (71.4%) | 4 (28.6%) |
| Total (Category) | 24 (85.7%) | 4 (14.3%) |
| Total (Overall) | 158 (45.5%) | 189 (54.5%) |
Employment Industries by Sex in Port Gamble Tribal Community
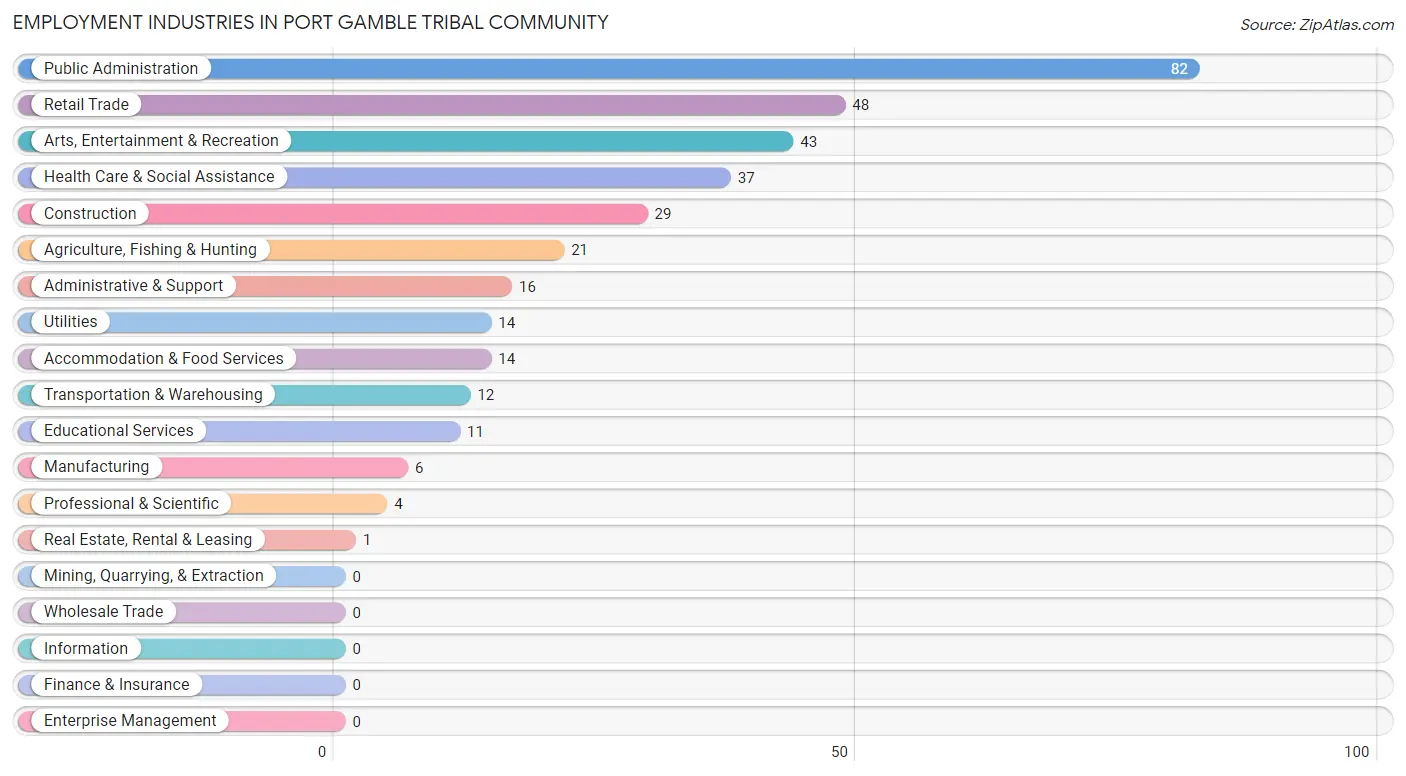
Employment Industries in Port Gamble Tribal Community
The major employment industries in Port Gamble Tribal Community include Public Administration (82 | 23.6%), Retail Trade (48 | 13.8%), Arts, Entertainment & Recreation (43 | 12.4%), Health Care & Social Assistance (37 | 10.7%), and Construction (29 | 8.4%).
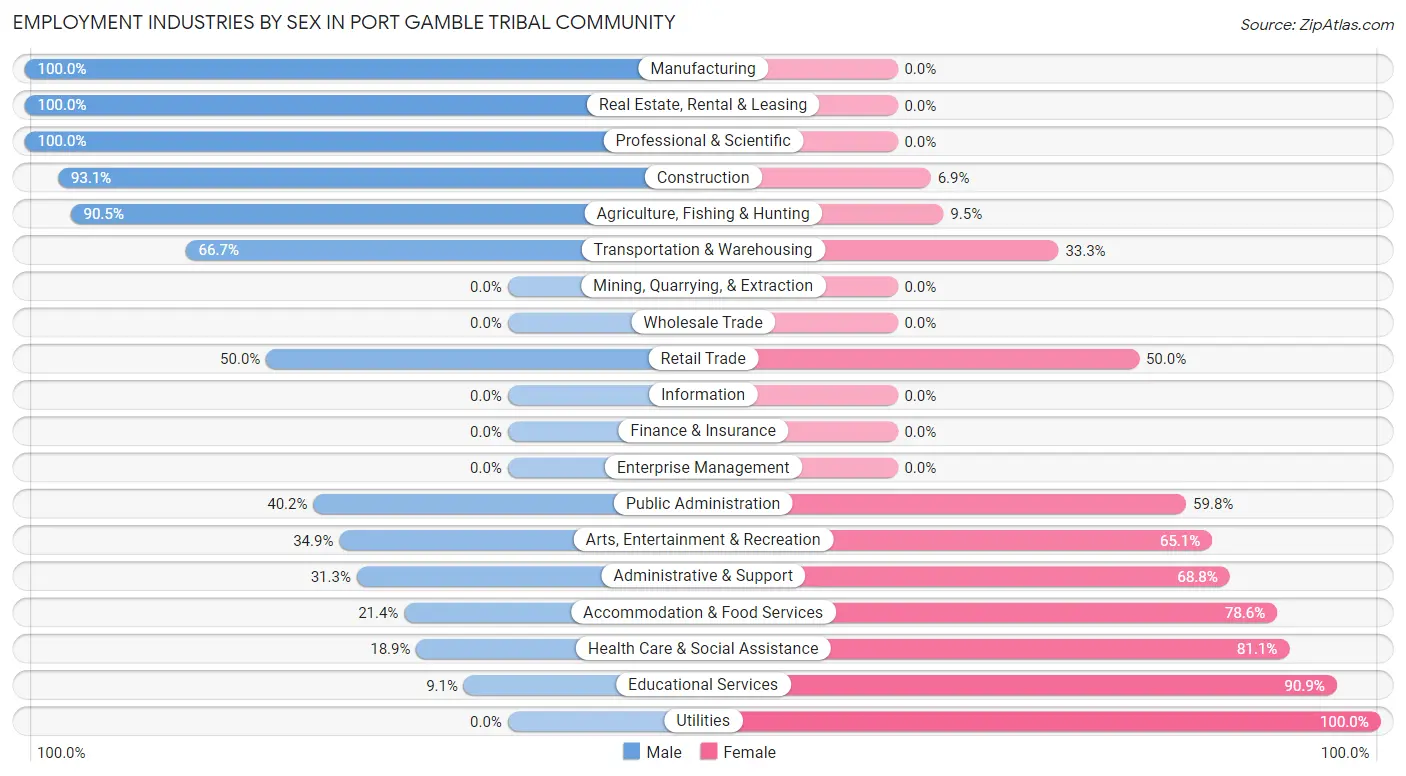
Employment Industries by Sex in Port Gamble Tribal Community
The Port Gamble Tribal Community industries that see more men than women are Manufacturing (100.0%), Real Estate, Rental & Leasing (100.0%), and Professional & Scientific (100.0%), whereas the industries that tend to have a higher number of women are Utilities (100.0%), Educational Services (90.9%), and Health Care & Social Assistance (81.1%).
| Industry | Male | Female |
| Agriculture, Fishing & Hunting | 19 (90.5%) | 2 (9.5%) |
| Mining, Quarrying, & Extraction | 0 (0.0%) | 0 (0.0%) |
| Construction | 27 (93.1%) | 2 (6.9%) |
| Manufacturing | 6 (100.0%) | 0 (0.0%) |
| Wholesale Trade | 0 (0.0%) | 0 (0.0%) |
| Retail Trade | 24 (50.0%) | 24 (50.0%) |
| Transportation & Warehousing | 8 (66.7%) | 4 (33.3%) |
| Utilities | 0 (0.0%) | 14 (100.0%) |
| Information | 0 (0.0%) | 0 (0.0%) |
| Finance & Insurance | 0 (0.0%) | 0 (0.0%) |
| Real Estate, Rental & Leasing | 1 (100.0%) | 0 (0.0%) |
| Professional & Scientific | 4 (100.0%) | 0 (0.0%) |
| Enterprise Management | 0 (0.0%) | 0 (0.0%) |
| Administrative & Support | 5 (31.2%) | 11 (68.8%) |
| Educational Services | 1 (9.1%) | 10 (90.9%) |
| Health Care & Social Assistance | 7 (18.9%) | 30 (81.1%) |
| Arts, Entertainment & Recreation | 15 (34.9%) | 28 (65.1%) |
| Accommodation & Food Services | 3 (21.4%) | 11 (78.6%) |
| Public Administration | 33 (40.2%) | 49 (59.8%) |
| Total | 158 (45.5%) | 189 (54.5%) |
Education in Port Gamble Tribal Community
School Enrollment in Port Gamble Tribal Community
The most common levels of schooling among the 212 students in Port Gamble Tribal Community are elementary school (73 | 34.4%), middle school (42 | 19.8%), and high school (42 | 19.8%).
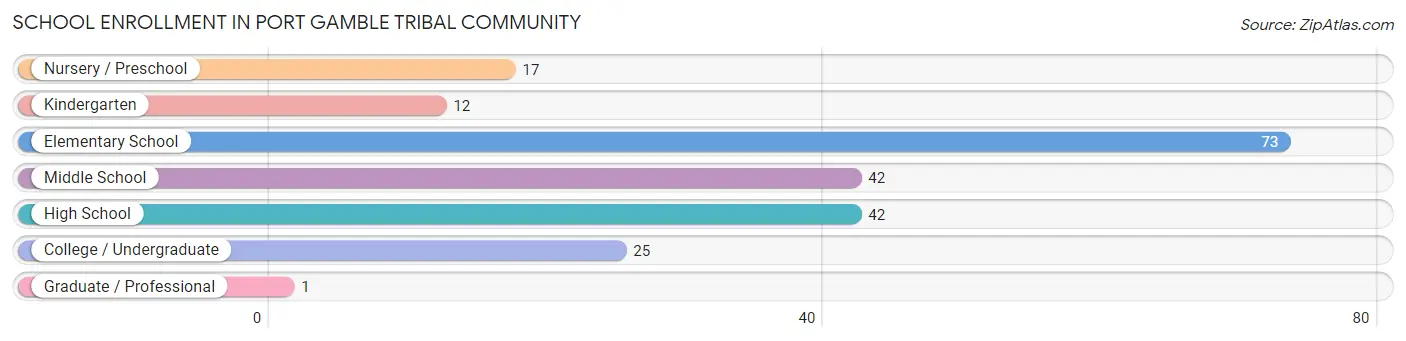
| School Level | # Students | % Students |
| Nursery / Preschool | 17 | 8.0% |
| Kindergarten | 12 | 5.7% |
| Elementary School | 73 | 34.4% |
| Middle School | 42 | 19.8% |
| High School | 42 | 19.8% |
| College / Undergraduate | 25 | 11.8% |
| Graduate / Professional | 1 | 0.5% |
| Total | 212 | 100.0% |
School Enrollment by Age by Funding Source in Port Gamble Tribal Community
Out of a total of 212 students who are enrolled in schools in Port Gamble Tribal Community, 23 (10.8%) attend a private institution, while the remaining 189 (89.2%) are enrolled in public schools. The age group of 20 to 24 year olds has the highest likelihood of being enrolled in private schools, with 3 (42.9% in the age bracket) enrolled. Conversely, the age group of 15 to 17 year olds has the lowest likelihood of being enrolled in a private school, with 27 (100.0% in the age bracket) attending a public institution.
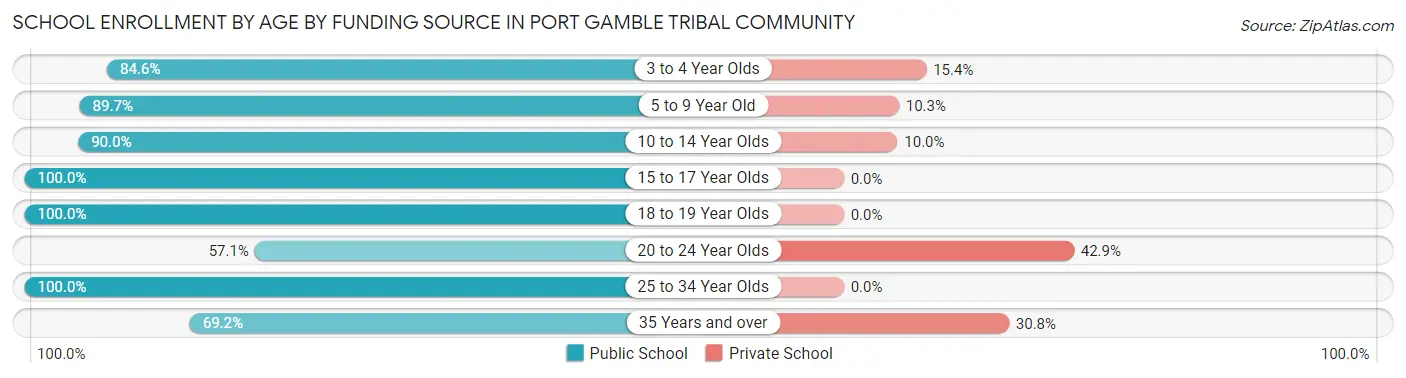
| Age Bracket | Public School | Private School |
| 3 to 4 Year Olds | 11 (84.6%) | 2 (15.4%) |
| 5 to 9 Year Old | 70 (89.7%) | 8 (10.3%) |
| 10 to 14 Year Olds | 54 (90.0%) | 6 (10.0%) |
| 15 to 17 Year Olds | 27 (100.0%) | 0 (0.0%) |
| 18 to 19 Year Olds | 7 (100.0%) | 0 (0.0%) |
| 20 to 24 Year Olds | 4 (57.1%) | 3 (42.9%) |
| 25 to 34 Year Olds | 7 (100.0%) | 0 (0.0%) |
| 35 Years and over | 9 (69.2%) | 4 (30.8%) |
| Total | 189 (89.2%) | 23 (10.8%) |
Educational Attainment by Field of Study in Port Gamble Tribal Community
Science & technology (51 | 36.7%), psychology (32 | 23.0%), business (14 | 10.1%), computers & mathematics (11 | 7.9%), and engineering (10 | 7.2%) are the most common fields of study among 139 individuals in Port Gamble Tribal Community who have obtained a bachelor's degree or higher.
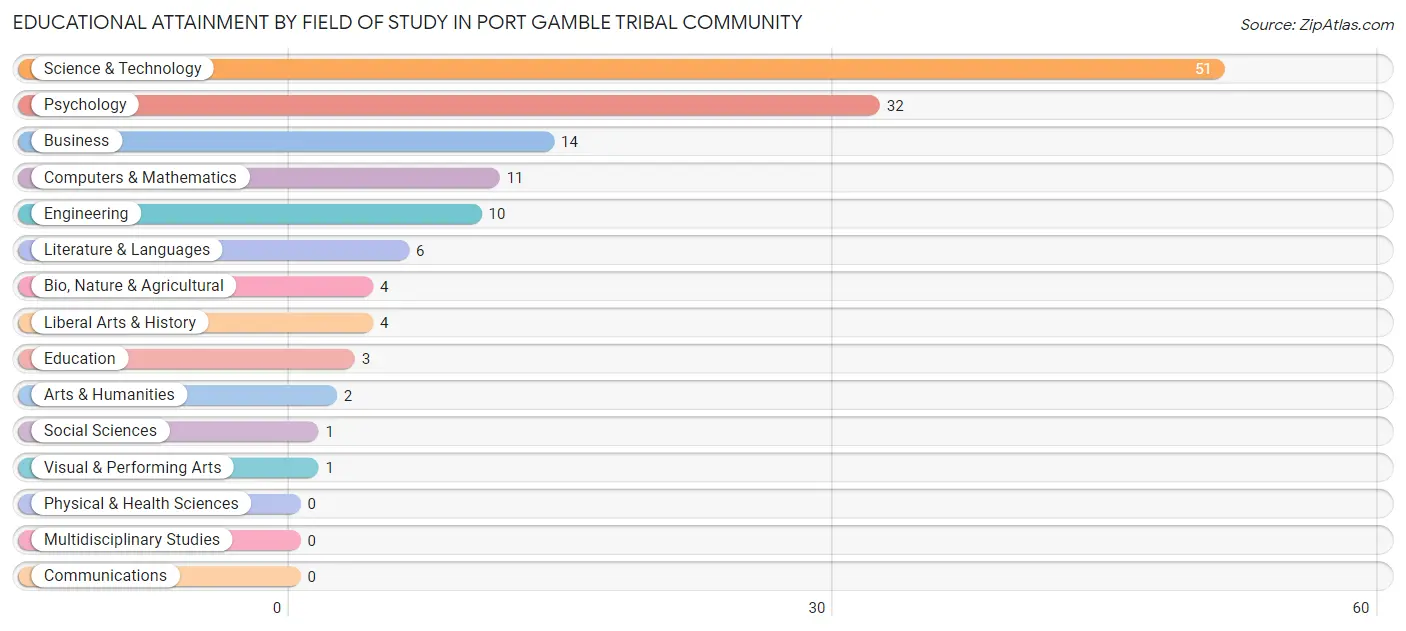
| Field of Study | # Graduates | % Graduates |
| Computers & Mathematics | 11 | 7.9% |
| Bio, Nature & Agricultural | 4 | 2.9% |
| Physical & Health Sciences | 0 | 0.0% |
| Psychology | 32 | 23.0% |
| Social Sciences | 1 | 0.7% |
| Engineering | 10 | 7.2% |
| Multidisciplinary Studies | 0 | 0.0% |
| Science & Technology | 51 | 36.7% |
| Business | 14 | 10.1% |
| Education | 3 | 2.2% |
| Literature & Languages | 6 | 4.3% |
| Liberal Arts & History | 4 | 2.9% |
| Visual & Performing Arts | 1 | 0.7% |
| Communications | 0 | 0.0% |
| Arts & Humanities | 2 | 1.4% |
| Total | 139 | 100.0% |
Transportation & Commute in Port Gamble Tribal Community
Vehicle Availability by Sex in Port Gamble Tribal Community
The most prevalent vehicle ownership categories in Port Gamble Tribal Community are males with 3 vehicles (67, accounting for 42.7%) and females with 3 vehicles (66, making up 35.4%).
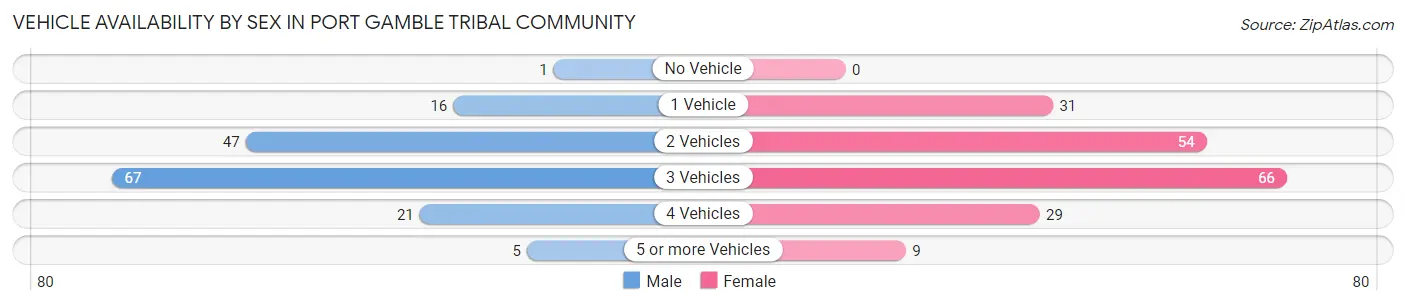
| Vehicles Available | Male | Female |
| No Vehicle | 1 (0.6%) | 0 (0.0%) |
| 1 Vehicle | 16 (10.2%) | 31 (16.4%) |
| 2 Vehicles | 47 (29.9%) | 54 (28.6%) |
| 3 Vehicles | 67 (42.7%) | 66 (34.9%) |
| 4 Vehicles | 21 (13.4%) | 29 (15.3%) |
| 5 or more Vehicles | 5 (3.2%) | 9 (4.8%) |
| Total | 157 (100.0%) | 189 (100.0%) |
Commute Time in Port Gamble Tribal Community
The most frequently occuring commute durations in Port Gamble Tribal Community are 5 to 9 minutes (84 commuters, 25.4%), 10 to 14 minutes (69 commuters, 20.8%), and less than 5 minutes (40 commuters, 12.1%).
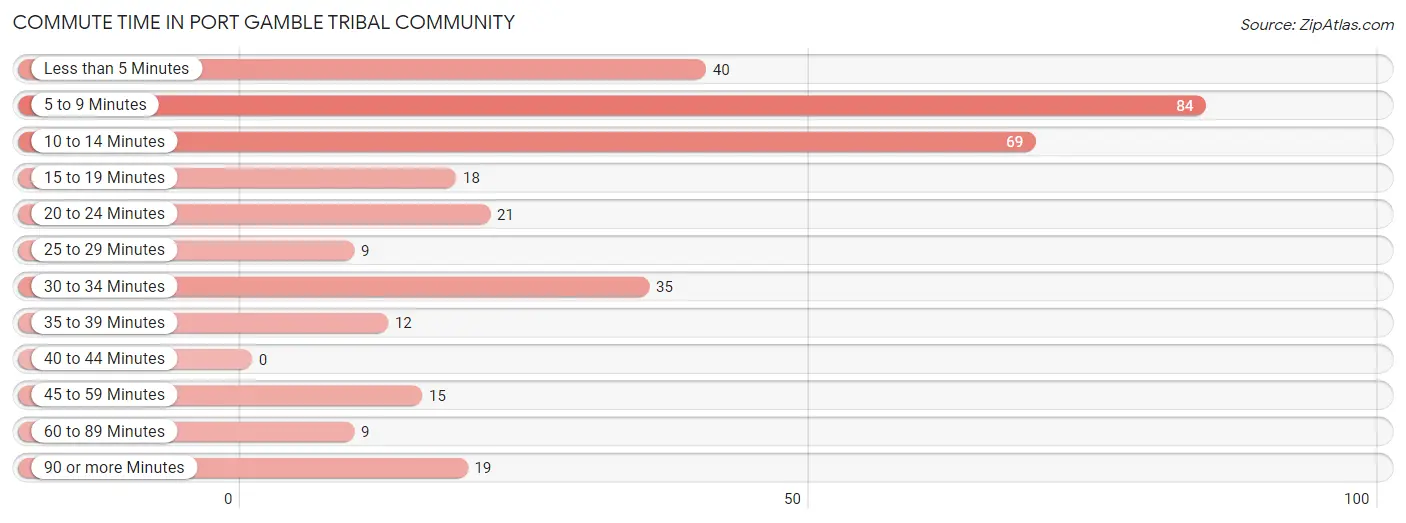
| Commute Time | # Commuters | % Commuters |
| Less than 5 Minutes | 40 | 12.1% |
| 5 to 9 Minutes | 84 | 25.4% |
| 10 to 14 Minutes | 69 | 20.8% |
| 15 to 19 Minutes | 18 | 5.4% |
| 20 to 24 Minutes | 21 | 6.3% |
| 25 to 29 Minutes | 9 | 2.7% |
| 30 to 34 Minutes | 35 | 10.6% |
| 35 to 39 Minutes | 12 | 3.6% |
| 40 to 44 Minutes | 0 | 0.0% |
| 45 to 59 Minutes | 15 | 4.5% |
| 60 to 89 Minutes | 9 | 2.7% |
| 90 or more Minutes | 19 | 5.7% |
Commute Time by Sex in Port Gamble Tribal Community
The most common commute times in Port Gamble Tribal Community are 30 to 34 minutes (33 commuters, 21.7%) for males and 5 to 9 minutes (55 commuters, 30.7%) for females.
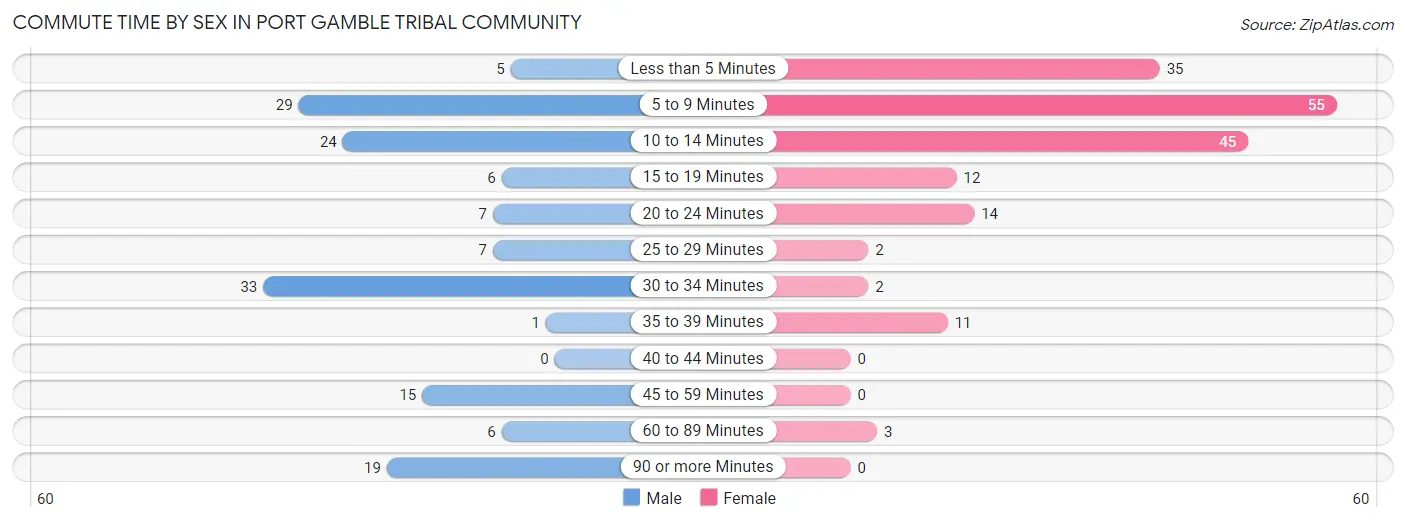
| Commute Time | Male | Female |
| Less than 5 Minutes | 5 (3.3%) | 35 (19.6%) |
| 5 to 9 Minutes | 29 (19.1%) | 55 (30.7%) |
| 10 to 14 Minutes | 24 (15.8%) | 45 (25.1%) |
| 15 to 19 Minutes | 6 (4.0%) | 12 (6.7%) |
| 20 to 24 Minutes | 7 (4.6%) | 14 (7.8%) |
| 25 to 29 Minutes | 7 (4.6%) | 2 (1.1%) |
| 30 to 34 Minutes | 33 (21.7%) | 2 (1.1%) |
| 35 to 39 Minutes | 1 (0.7%) | 11 (6.1%) |
| 40 to 44 Minutes | 0 (0.0%) | 0 (0.0%) |
| 45 to 59 Minutes | 15 (9.9%) | 0 (0.0%) |
| 60 to 89 Minutes | 6 (4.0%) | 3 (1.7%) |
| 90 or more Minutes | 19 (12.5%) | 0 (0.0%) |
Time of Departure to Work by Sex in Port Gamble Tribal Community
The most frequent times of departure to work in Port Gamble Tribal Community are 8:00 AM to 8:29 AM (23, 15.1%) for males and 7:30 AM to 7:59 AM (48, 26.8%) for females.
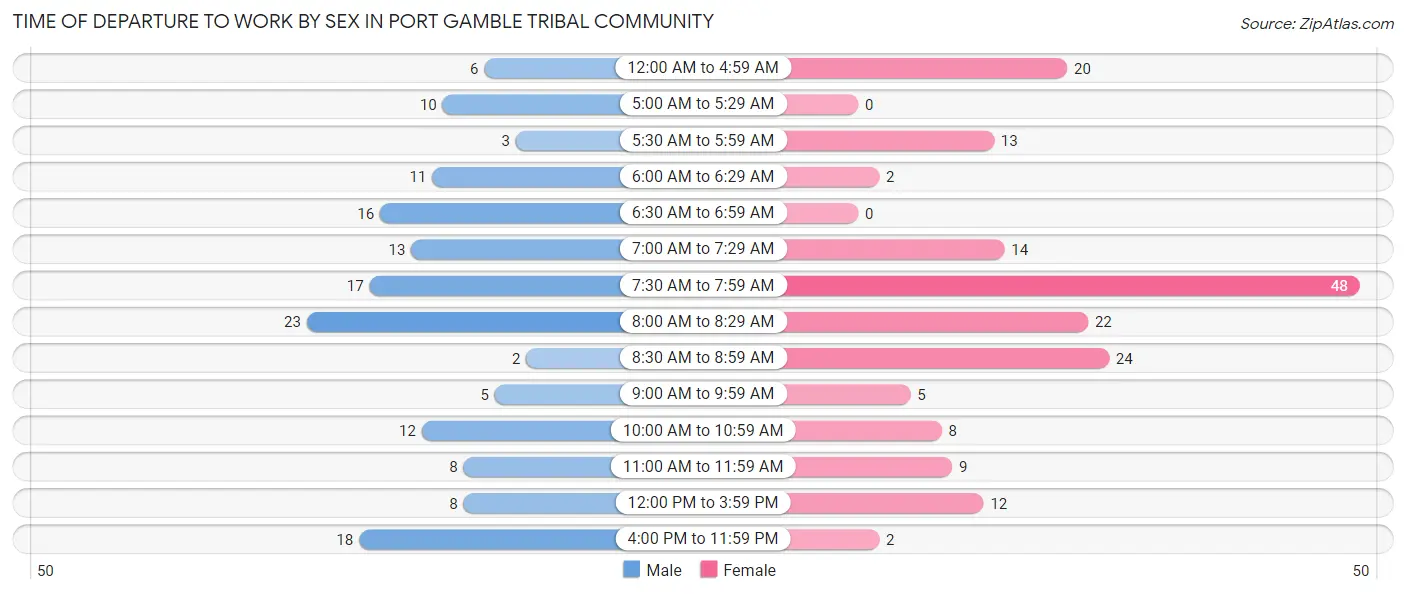
| Time of Departure | Male | Female |
| 12:00 AM to 4:59 AM | 6 (4.0%) | 20 (11.2%) |
| 5:00 AM to 5:29 AM | 10 (6.6%) | 0 (0.0%) |
| 5:30 AM to 5:59 AM | 3 (2.0%) | 13 (7.3%) |
| 6:00 AM to 6:29 AM | 11 (7.2%) | 2 (1.1%) |
| 6:30 AM to 6:59 AM | 16 (10.5%) | 0 (0.0%) |
| 7:00 AM to 7:29 AM | 13 (8.6%) | 14 (7.8%) |
| 7:30 AM to 7:59 AM | 17 (11.2%) | 48 (26.8%) |
| 8:00 AM to 8:29 AM | 23 (15.1%) | 22 (12.3%) |
| 8:30 AM to 8:59 AM | 2 (1.3%) | 24 (13.4%) |
| 9:00 AM to 9:59 AM | 5 (3.3%) | 5 (2.8%) |
| 10:00 AM to 10:59 AM | 12 (7.9%) | 8 (4.5%) |
| 11:00 AM to 11:59 AM | 8 (5.3%) | 9 (5.0%) |
| 12:00 PM to 3:59 PM | 8 (5.3%) | 12 (6.7%) |
| 4:00 PM to 11:59 PM | 18 (11.8%) | 2 (1.1%) |
| Total | 152 (100.0%) | 179 (100.0%) |
Housing Occupancy in Port Gamble Tribal Community
Occupancy by Ownership in Port Gamble Tribal Community
Of the total 303 dwellings in Port Gamble Tribal Community, owner-occupied units account for 225 (74.3%), while renter-occupied units make up 78 (25.7%).
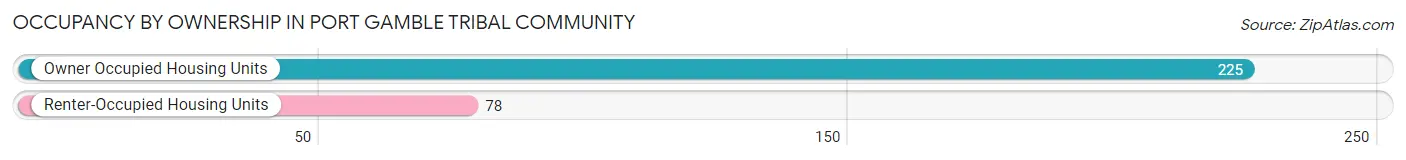
| Occupancy | # Housing Units | % Housing Units |
| Owner Occupied Housing Units | 225 | 74.3% |
| Renter-Occupied Housing Units | 78 | 25.7% |
| Total Occupied Housing Units | 303 | 100.0% |
Occupancy by Household Size in Port Gamble Tribal Community
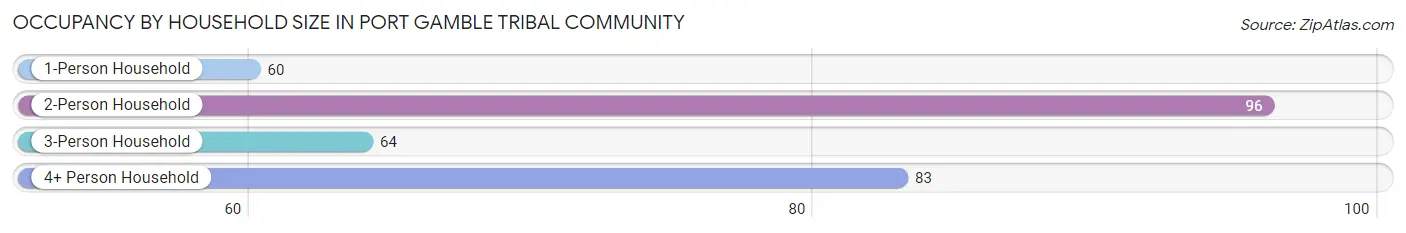
| Household Size | # Housing Units | % Housing Units |
| 1-Person Household | 60 | 19.8% |
| 2-Person Household | 96 | 31.7% |
| 3-Person Household | 64 | 21.1% |
| 4+ Person Household | 83 | 27.4% |
| Total Housing Units | 303 | 100.0% |
Occupancy by Ownership by Household Size in Port Gamble Tribal Community
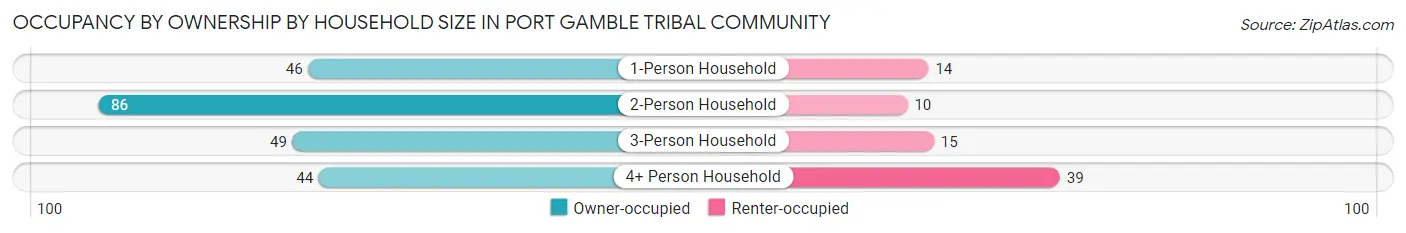
| Household Size | Owner-occupied | Renter-occupied |
| 1-Person Household | 46 (76.7%) | 14 (23.3%) |
| 2-Person Household | 86 (89.6%) | 10 (10.4%) |
| 3-Person Household | 49 (76.6%) | 15 (23.4%) |
| 4+ Person Household | 44 (53.0%) | 39 (47.0%) |
| Total Housing Units | 225 (74.3%) | 78 (25.7%) |
Occupancy by Educational Attainment in Port Gamble Tribal Community
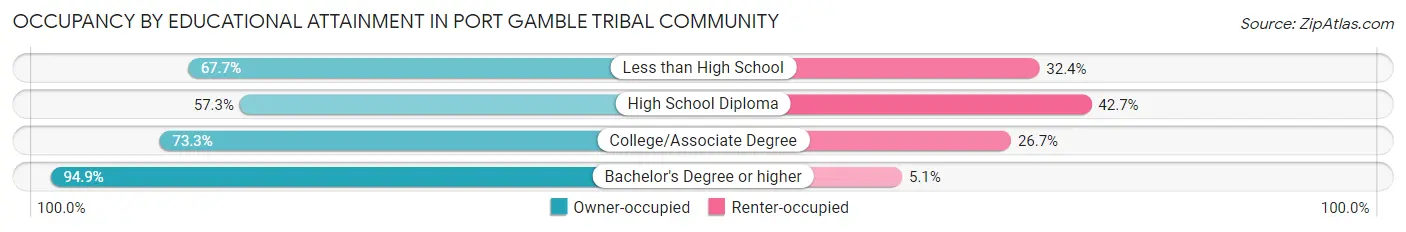
| Household Size | Owner-occupied | Renter-occupied |
| Less than High School | 23 (67.6%) | 11 (32.4%) |
| High School Diploma | 43 (57.3%) | 32 (42.7%) |
| College/Associate Degree | 85 (73.3%) | 31 (26.7%) |
| Bachelor's Degree or higher | 74 (94.9%) | 4 (5.1%) |
Occupancy by Age of Householder in Port Gamble Tribal Community
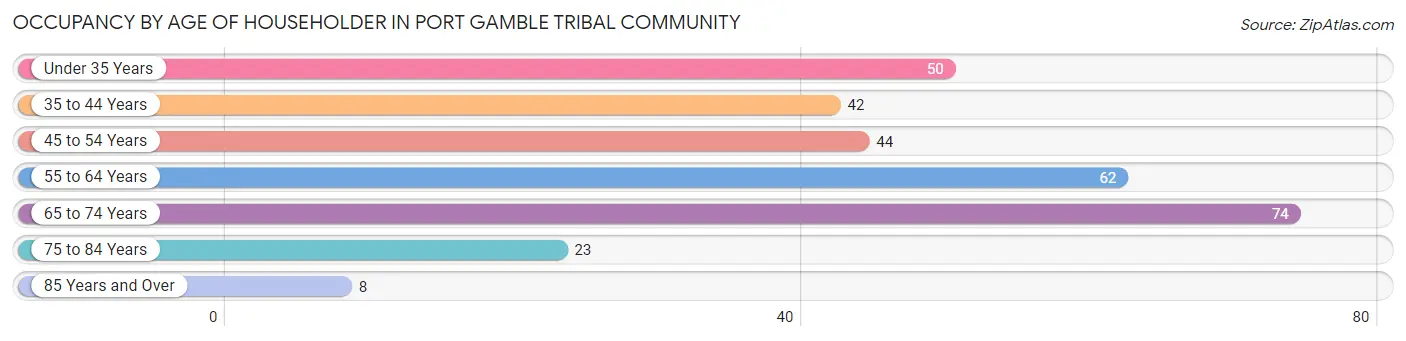
| Age Bracket | # Households | % Households |
| Under 35 Years | 50 | 16.5% |
| 35 to 44 Years | 42 | 13.9% |
| 45 to 54 Years | 44 | 14.5% |
| 55 to 64 Years | 62 | 20.5% |
| 65 to 74 Years | 74 | 24.4% |
| 75 to 84 Years | 23 | 7.6% |
| 85 Years and Over | 8 | 2.6% |
| Total | 303 | 100.0% |
Housing Finances in Port Gamble Tribal Community
Median Income by Occupancy in Port Gamble Tribal Community
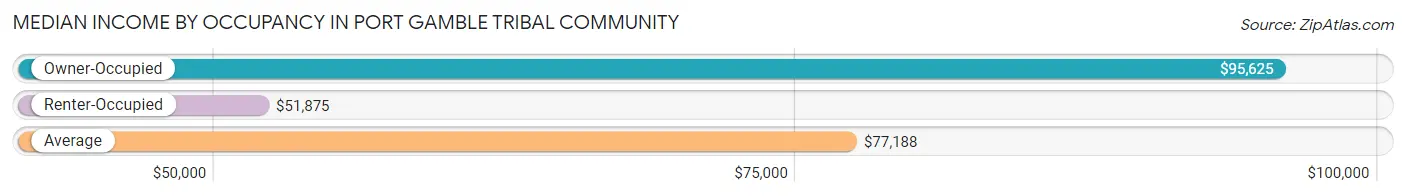
| Occupancy Type | # Households | Median Income |
| Owner-Occupied | 225 (74.3%) | $95,625 |
| Renter-Occupied | 78 (25.7%) | $51,875 |
| Average | 303 (100.0%) | $77,188 |
Occupancy by Householder Income Bracket in Port Gamble Tribal Community
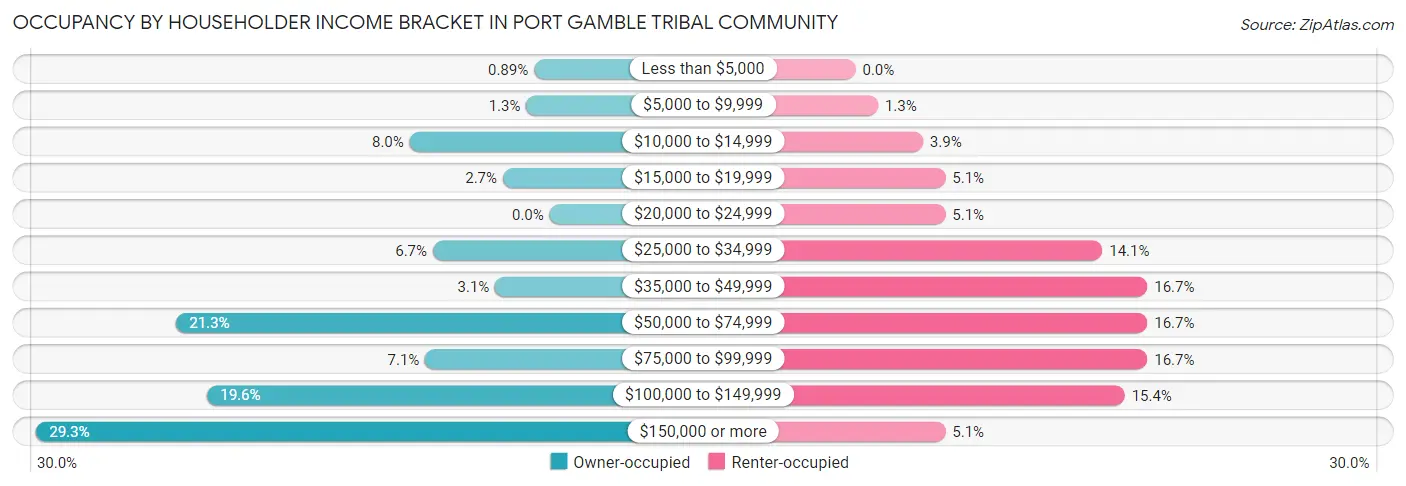
| Income Bracket | Owner-occupied | Renter-occupied |
| Less than $5,000 | 2 (0.9%) | 0 (0.0%) |
| $5,000 to $9,999 | 3 (1.3%) | 1 (1.3%) |
| $10,000 to $14,999 | 18 (8.0%) | 3 (3.8%) |
| $15,000 to $19,999 | 6 (2.7%) | 4 (5.1%) |
| $20,000 to $24,999 | 0 (0.0%) | 4 (5.1%) |
| $25,000 to $34,999 | 15 (6.7%) | 11 (14.1%) |
| $35,000 to $49,999 | 7 (3.1%) | 13 (16.7%) |
| $50,000 to $74,999 | 48 (21.3%) | 13 (16.7%) |
| $75,000 to $99,999 | 16 (7.1%) | 13 (16.7%) |
| $100,000 to $149,999 | 44 (19.6%) | 12 (15.4%) |
| $150,000 or more | 66 (29.3%) | 4 (5.1%) |
| Total | 225 (100.0%) | 78 (100.0%) |
Monthly Housing Cost Tiers in Port Gamble Tribal Community
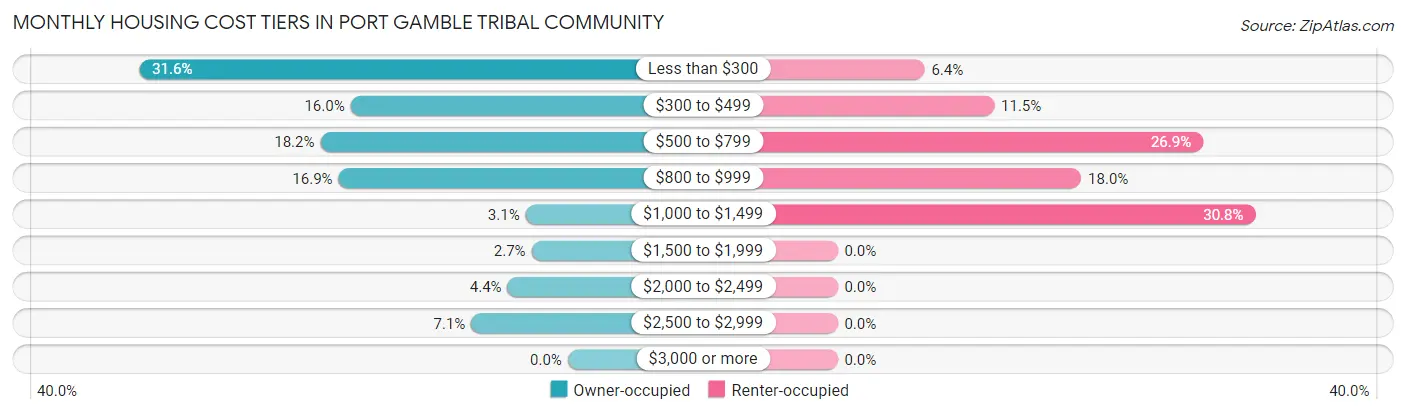
| Monthly Cost | Owner-occupied | Renter-occupied |
| Less than $300 | 71 (31.6%) | 5 (6.4%) |
| $300 to $499 | 36 (16.0%) | 9 (11.5%) |
| $500 to $799 | 41 (18.2%) | 21 (26.9%) |
| $800 to $999 | 38 (16.9%) | 14 (17.9%) |
| $1,000 to $1,499 | 7 (3.1%) | 24 (30.8%) |
| $1,500 to $1,999 | 6 (2.7%) | 0 (0.0%) |
| $2,000 to $2,499 | 10 (4.4%) | 0 (0.0%) |
| $2,500 to $2,999 | 16 (7.1%) | 0 (0.0%) |
| $3,000 or more | 0 (0.0%) | 0 (0.0%) |
| Total | 225 (100.0%) | 78 (100.0%) |
Physical Housing Characteristics in Port Gamble Tribal Community
Housing Structures in Port Gamble Tribal Community
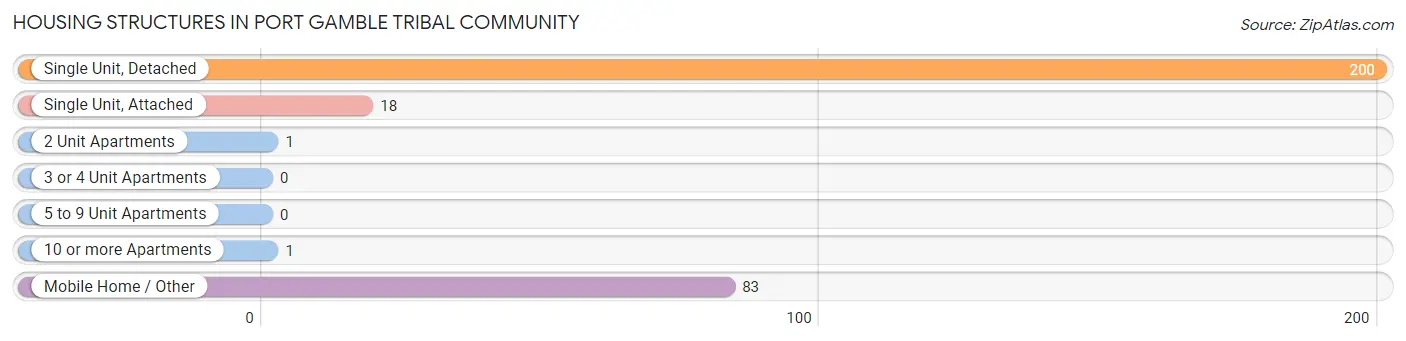
| Structure Type | # Housing Units | % Housing Units |
| Single Unit, Detached | 200 | 66.0% |
| Single Unit, Attached | 18 | 5.9% |
| 2 Unit Apartments | 1 | 0.3% |
| 3 or 4 Unit Apartments | 0 | 0.0% |
| 5 to 9 Unit Apartments | 0 | 0.0% |
| 10 or more Apartments | 1 | 0.3% |
| Mobile Home / Other | 83 | 27.4% |
| Total | 303 | 100.0% |
Housing Structures by Occupancy in Port Gamble Tribal Community
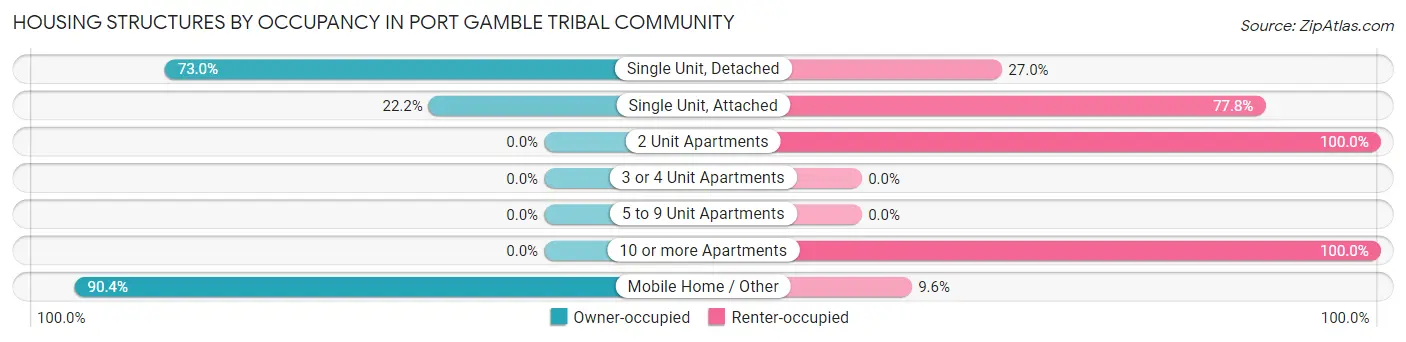
| Structure Type | Owner-occupied | Renter-occupied |
| Single Unit, Detached | 146 (73.0%) | 54 (27.0%) |
| Single Unit, Attached | 4 (22.2%) | 14 (77.8%) |
| 2 Unit Apartments | 0 (0.0%) | 1 (100.0%) |
| 3 or 4 Unit Apartments | 0 (0.0%) | 0 (0.0%) |
| 5 to 9 Unit Apartments | 0 (0.0%) | 0 (0.0%) |
| 10 or more Apartments | 0 (0.0%) | 1 (100.0%) |
| Mobile Home / Other | 75 (90.4%) | 8 (9.6%) |
| Total | 225 (74.3%) | 78 (25.7%) |
Housing Structures by Number of Rooms in Port Gamble Tribal Community
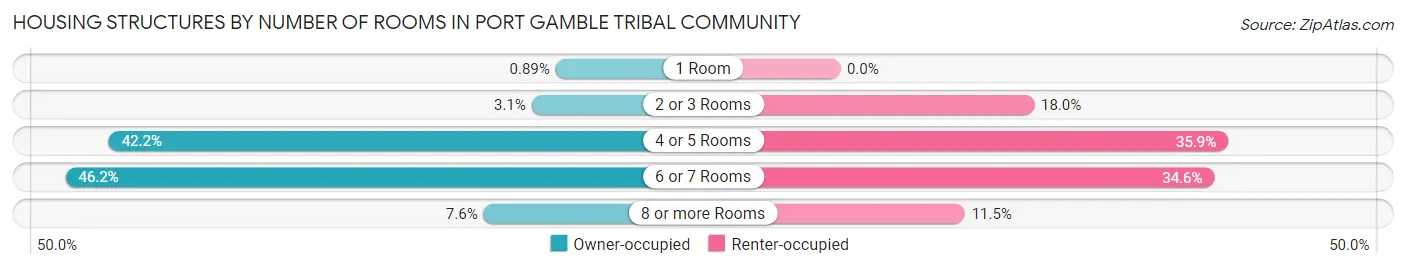
| Number of Rooms | Owner-occupied | Renter-occupied |
| 1 Room | 2 (0.9%) | 0 (0.0%) |
| 2 or 3 Rooms | 7 (3.1%) | 14 (17.9%) |
| 4 or 5 Rooms | 95 (42.2%) | 28 (35.9%) |
| 6 or 7 Rooms | 104 (46.2%) | 27 (34.6%) |
| 8 or more Rooms | 17 (7.6%) | 9 (11.5%) |
| Total | 225 (100.0%) | 78 (100.0%) |
Housing Structure by Heating Type in Port Gamble Tribal Community
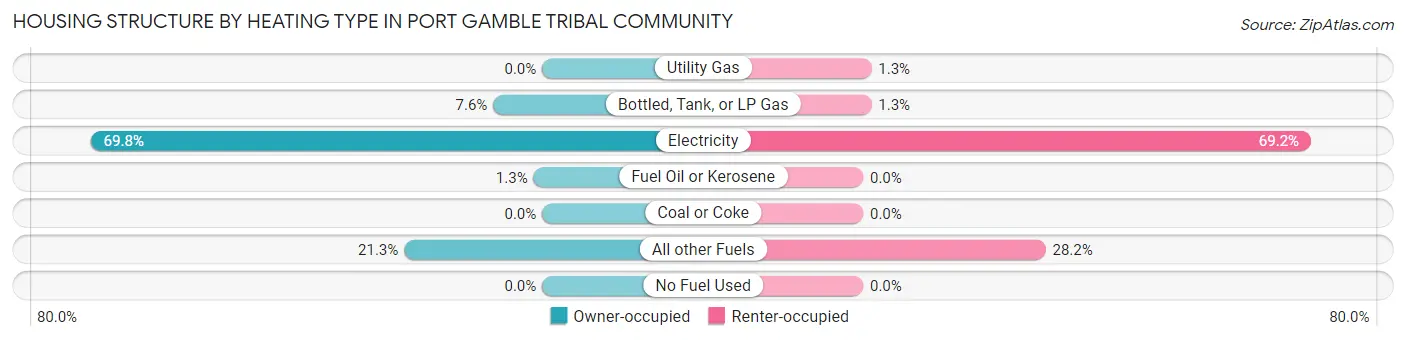
| Heating Type | Owner-occupied | Renter-occupied |
| Utility Gas | 0 (0.0%) | 1 (1.3%) |
| Bottled, Tank, or LP Gas | 17 (7.6%) | 1 (1.3%) |
| Electricity | 157 (69.8%) | 54 (69.2%) |
| Fuel Oil or Kerosene | 3 (1.3%) | 0 (0.0%) |
| Coal or Coke | 0 (0.0%) | 0 (0.0%) |
| All other Fuels | 48 (21.3%) | 22 (28.2%) |
| No Fuel Used | 0 (0.0%) | 0 (0.0%) |
| Total | 225 (100.0%) | 78 (100.0%) |
Household Vehicle Usage in Port Gamble Tribal Community
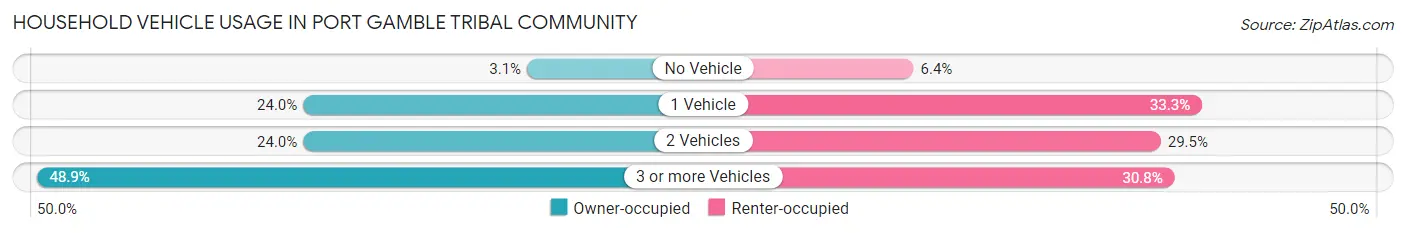
| Vehicles per Household | Owner-occupied | Renter-occupied |
| No Vehicle | 7 (3.1%) | 5 (6.4%) |
| 1 Vehicle | 54 (24.0%) | 26 (33.3%) |
| 2 Vehicles | 54 (24.0%) | 23 (29.5%) |
| 3 or more Vehicles | 110 (48.9%) | 24 (30.8%) |
| Total | 225 (100.0%) | 78 (100.0%) |
Real Estate & Mortgages in Port Gamble Tribal Community
Real Estate and Mortgage Overview in Port Gamble Tribal Community
| Characteristic | Without Mortgage | With Mortgage |
| Housing Units | 167 | 58 |
| Median Property Value | - | - |
| Median Household Income | $72,917 | $27 |
| Monthly Housing Costs | $345 | $0 |
| Real Estate Taxes | $4,734 | $30 |
Property Value by Mortgage Status in Port Gamble Tribal Community
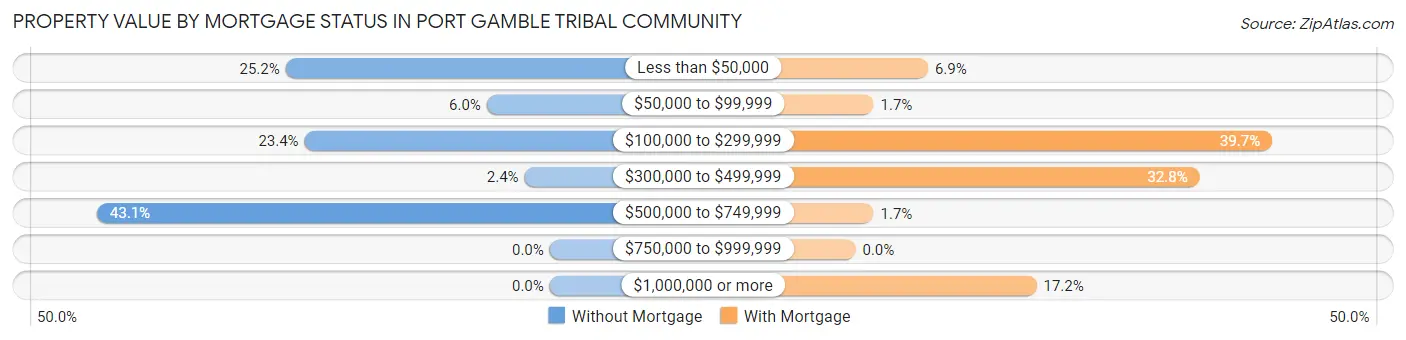
| Property Value | Without Mortgage | With Mortgage |
| Less than $50,000 | 42 (25.2%) | 4 (6.9%) |
| $50,000 to $99,999 | 10 (6.0%) | 1 (1.7%) |
| $100,000 to $299,999 | 39 (23.4%) | 23 (39.7%) |
| $300,000 to $499,999 | 4 (2.4%) | 19 (32.8%) |
| $500,000 to $749,999 | 72 (43.1%) | 1 (1.7%) |
| $750,000 to $999,999 | 0 (0.0%) | 0 (0.0%) |
| $1,000,000 or more | 0 (0.0%) | 10 (17.2%) |
| Total | 167 (100.0%) | 58 (100.0%) |
Household Income by Mortgage Status in Port Gamble Tribal Community
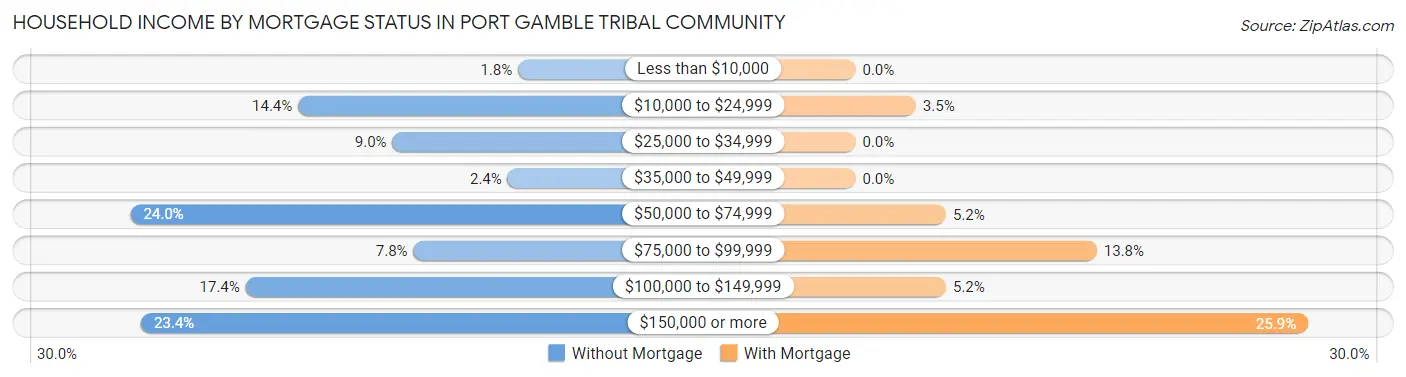
| Household Income | Without Mortgage | With Mortgage |
| Less than $10,000 | 3 (1.8%) | 0 (0.0%) |
| $10,000 to $24,999 | 24 (14.4%) | 2 (3.5%) |
| $25,000 to $34,999 | 15 (9.0%) | 0 (0.0%) |
| $35,000 to $49,999 | 4 (2.4%) | 0 (0.0%) |
| $50,000 to $74,999 | 40 (23.9%) | 3 (5.2%) |
| $75,000 to $99,999 | 13 (7.8%) | 8 (13.8%) |
| $100,000 to $149,999 | 29 (17.4%) | 3 (5.2%) |
| $150,000 or more | 39 (23.4%) | 15 (25.9%) |
| Total | 167 (100.0%) | 58 (100.0%) |
Property Value to Household Income Ratio in Port Gamble Tribal Community
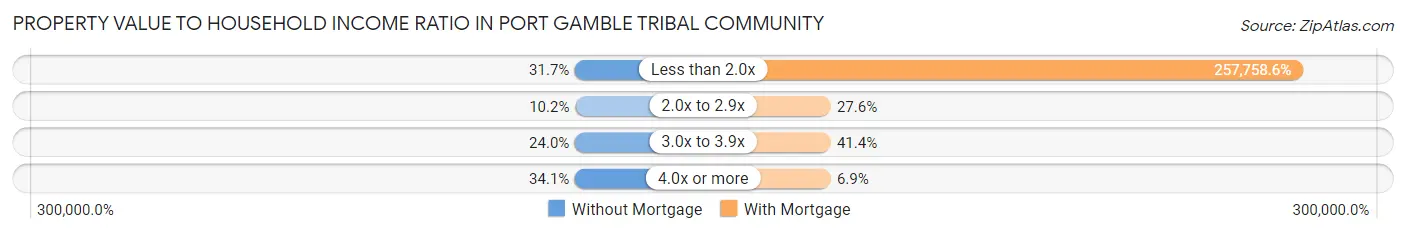
| Value-to-Income Ratio | Without Mortgage | With Mortgage |
| Less than 2.0x | 53 (31.7%) | 149,500 (257,758.6%) |
| 2.0x to 2.9x | 17 (10.2%) | 16 (27.6%) |
| 3.0x to 3.9x | 40 (23.9%) | 24 (41.4%) |
| 4.0x or more | 57 (34.1%) | 4 (6.9%) |
| Total | 167 (100.0%) | 58 (100.0%) |
Real Estate Taxes by Mortgage Status in Port Gamble Tribal Community
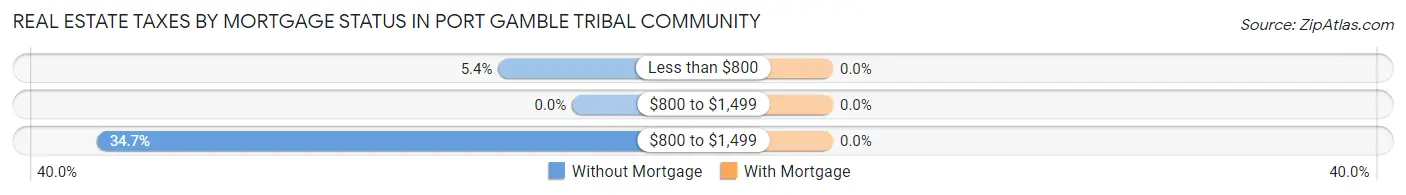
| Property Taxes | Without Mortgage | With Mortgage |
| Less than $800 | 9 (5.4%) | 0 (0.0%) |
| $800 to $1,499 | 0 (0.0%) | 0 (0.0%) |
| $800 to $1,499 | 58 (34.7%) | 0 (0.0%) |
| Total | 167 (100.0%) | 58 (100.0%) |
Health & Disability in Port Gamble Tribal Community
Health Insurance Coverage by Age in Port Gamble Tribal Community
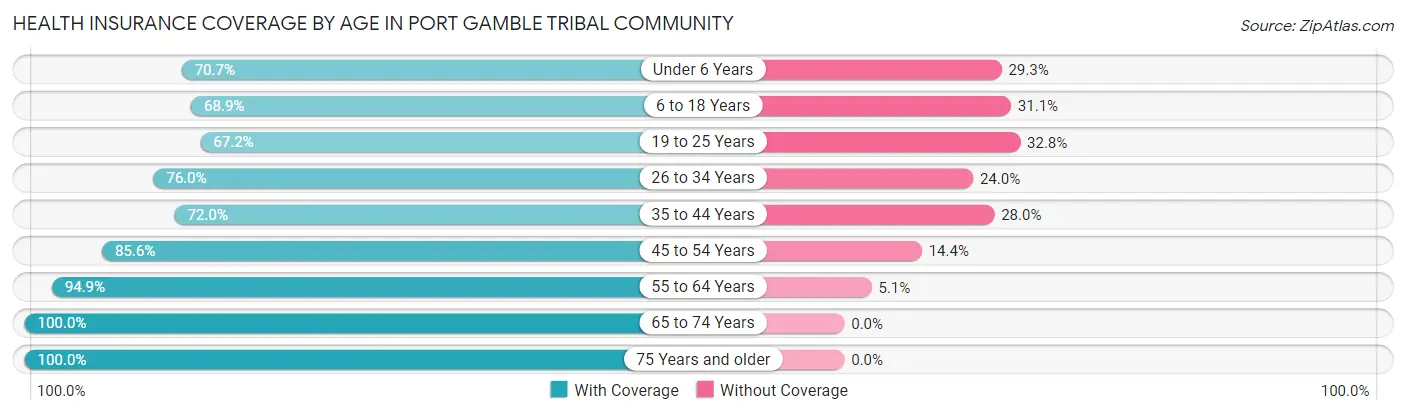
| Age Bracket | With Coverage | Without Coverage |
| Under 6 Years | 41 (70.7%) | 17 (29.3%) |
| 6 to 18 Years | 122 (68.9%) | 55 (31.1%) |
| 19 to 25 Years | 41 (67.2%) | 20 (32.8%) |
| 26 to 34 Years | 76 (76.0%) | 24 (24.0%) |
| 35 to 44 Years | 67 (72.0%) | 26 (28.0%) |
| 45 to 54 Years | 77 (85.6%) | 13 (14.4%) |
| 55 to 64 Years | 112 (94.9%) | 6 (5.1%) |
| 65 to 74 Years | 111 (100.0%) | 0 (0.0%) |
| 75 Years and older | 42 (100.0%) | 0 (0.0%) |
| Total | 689 (81.1%) | 161 (18.9%) |
Health Insurance Coverage by Citizenship Status in Port Gamble Tribal Community
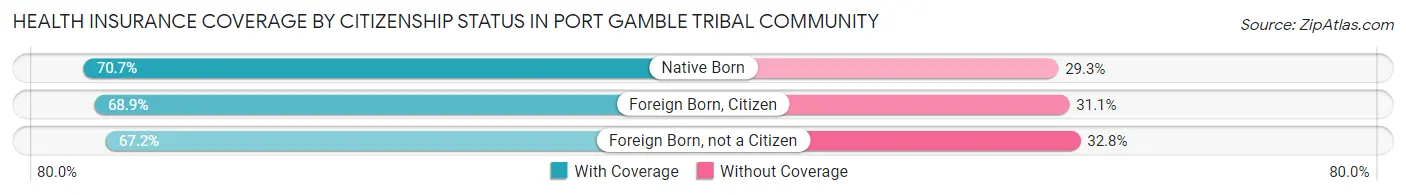
| Citizenship Status | With Coverage | Without Coverage |
| Native Born | 41 (70.7%) | 17 (29.3%) |
| Foreign Born, Citizen | 122 (68.9%) | 55 (31.1%) |
| Foreign Born, not a Citizen | 41 (67.2%) | 20 (32.8%) |
Health Insurance Coverage by Household Income in Port Gamble Tribal Community
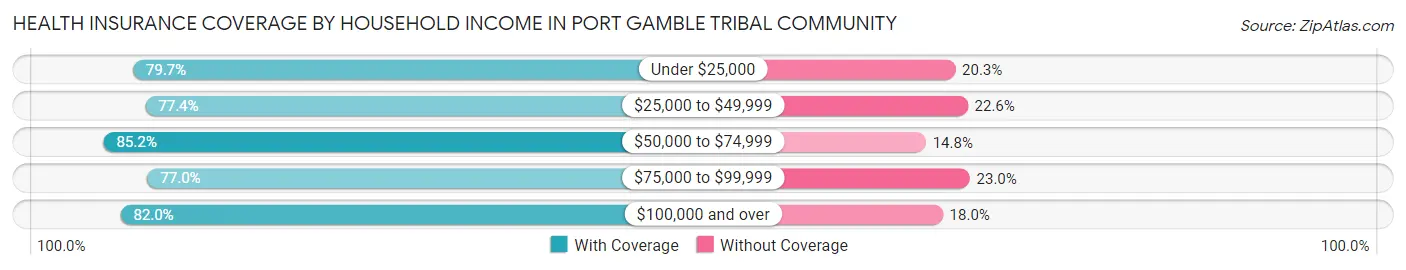
| Household Income | With Coverage | Without Coverage |
| Under $25,000 | 55 (79.7%) | 14 (20.3%) |
| $25,000 to $49,999 | 106 (77.4%) | 31 (22.6%) |
| $50,000 to $74,999 | 144 (85.2%) | 25 (14.8%) |
| $75,000 to $99,999 | 87 (77.0%) | 26 (23.0%) |
| $100,000 and over | 297 (82.0%) | 65 (18.0%) |
Public vs Private Health Insurance Coverage by Age in Port Gamble Tribal Community
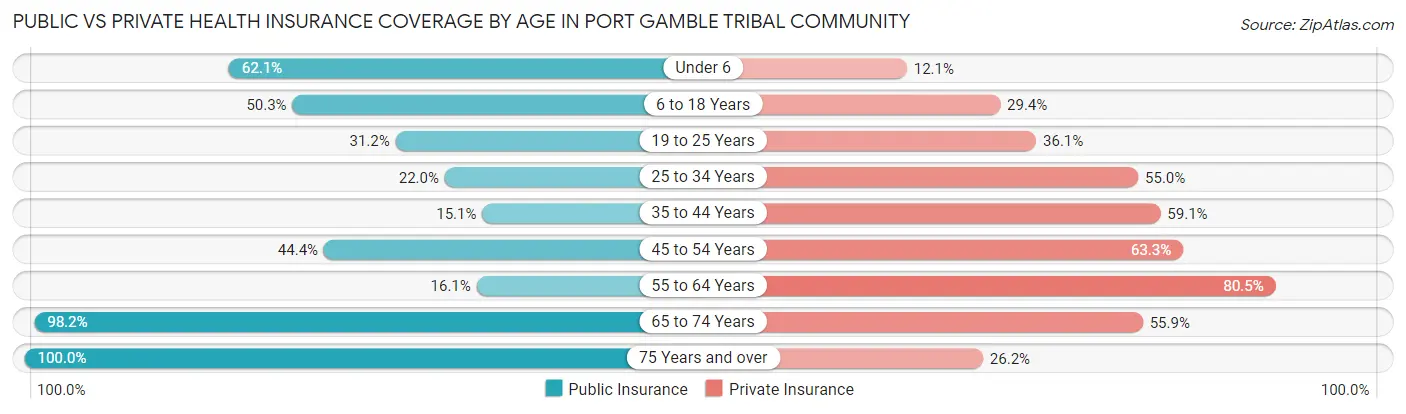
| Age Bracket | Public Insurance | Private Insurance |
| Under 6 | 36 (62.1%) | 7 (12.1%) |
| 6 to 18 Years | 89 (50.3%) | 52 (29.4%) |
| 19 to 25 Years | 19 (31.1%) | 22 (36.1%) |
| 25 to 34 Years | 22 (22.0%) | 55 (55.0%) |
| 35 to 44 Years | 14 (15.0%) | 55 (59.1%) |
| 45 to 54 Years | 40 (44.4%) | 57 (63.3%) |
| 55 to 64 Years | 19 (16.1%) | 95 (80.5%) |
| 65 to 74 Years | 109 (98.2%) | 62 (55.9%) |
| 75 Years and over | 42 (100.0%) | 11 (26.2%) |
| Total | 390 (45.9%) | 416 (48.9%) |
Disability Status by Sex by Age in Port Gamble Tribal Community
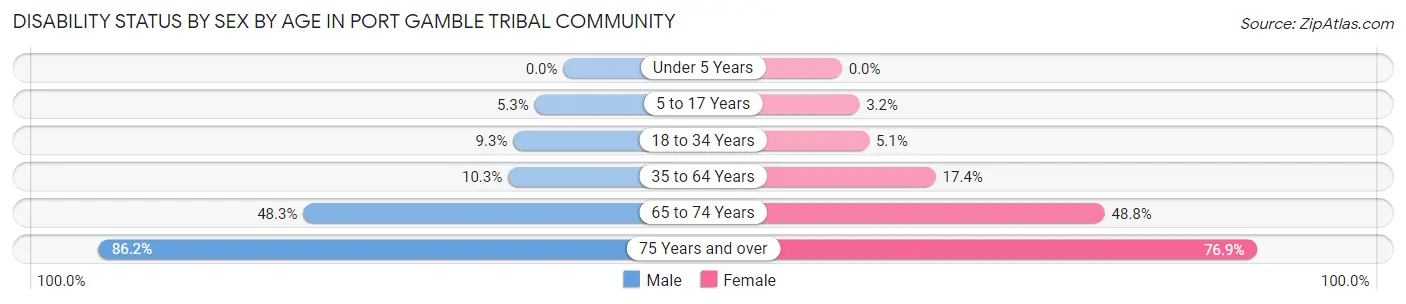
| Age Bracket | Male | Female |
| Under 5 Years | 0 (0.0%) | 0 (0.0%) |
| 5 to 17 Years | 4 (5.3%) | 3 (3.2%) |
| 18 to 34 Years | 8 (9.3%) | 5 (5.1%) |
| 35 to 64 Years | 15 (10.3%) | 27 (17.4%) |
| 65 to 74 Years | 14 (48.3%) | 40 (48.8%) |
| 75 Years and over | 25 (86.2%) | 10 (76.9%) |
Disability Class by Sex by Age in Port Gamble Tribal Community
Disability Class: Hearing Difficulty
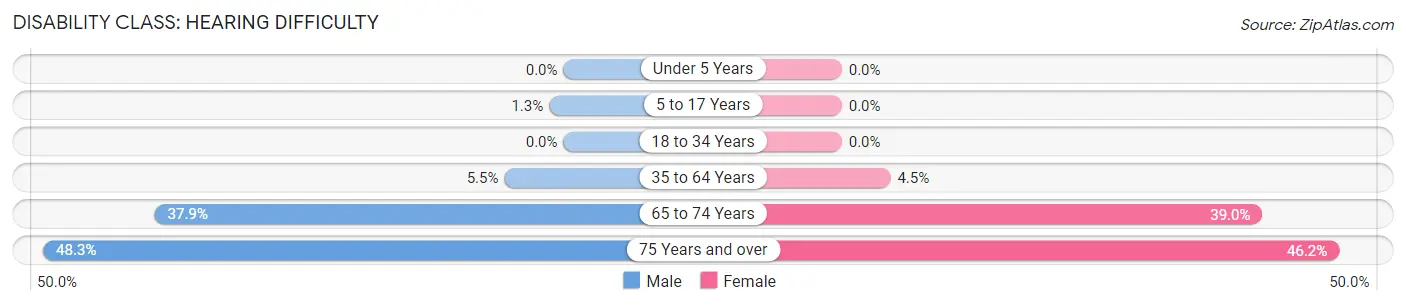
| Age Bracket | Male | Female |
| Under 5 Years | 0 (0.0%) | 0 (0.0%) |
| 5 to 17 Years | 1 (1.3%) | 0 (0.0%) |
| 18 to 34 Years | 0 (0.0%) | 0 (0.0%) |
| 35 to 64 Years | 8 (5.5%) | 7 (4.5%) |
| 65 to 74 Years | 11 (37.9%) | 32 (39.0%) |
| 75 Years and over | 14 (48.3%) | 6 (46.2%) |
Disability Class: Vision Difficulty
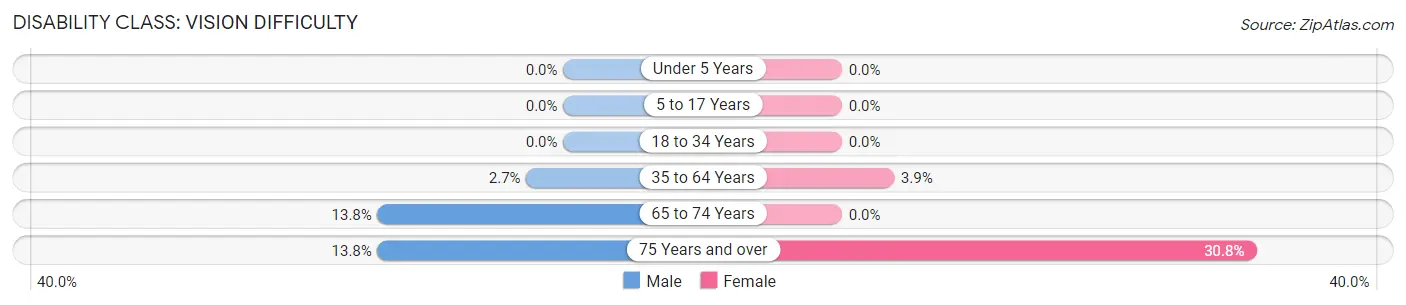
| Age Bracket | Male | Female |
| Under 5 Years | 0 (0.0%) | 0 (0.0%) |
| 5 to 17 Years | 0 (0.0%) | 0 (0.0%) |
| 18 to 34 Years | 0 (0.0%) | 0 (0.0%) |
| 35 to 64 Years | 4 (2.7%) | 6 (3.9%) |
| 65 to 74 Years | 4 (13.8%) | 0 (0.0%) |
| 75 Years and over | 4 (13.8%) | 4 (30.8%) |
Disability Class: Cognitive Difficulty
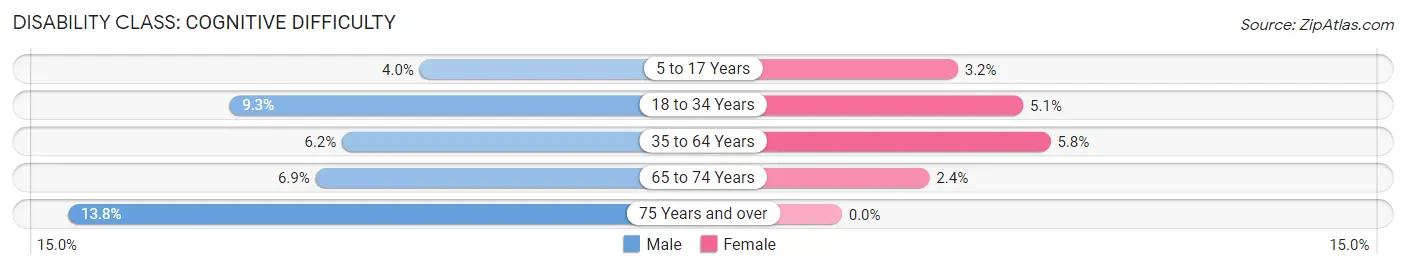
| Age Bracket | Male | Female |
| 5 to 17 Years | 3 (4.0%) | 3 (3.2%) |
| 18 to 34 Years | 8 (9.3%) | 5 (5.1%) |
| 35 to 64 Years | 9 (6.2%) | 9 (5.8%) |
| 65 to 74 Years | 2 (6.9%) | 2 (2.4%) |
| 75 Years and over | 4 (13.8%) | 0 (0.0%) |
Disability Class: Ambulatory Difficulty
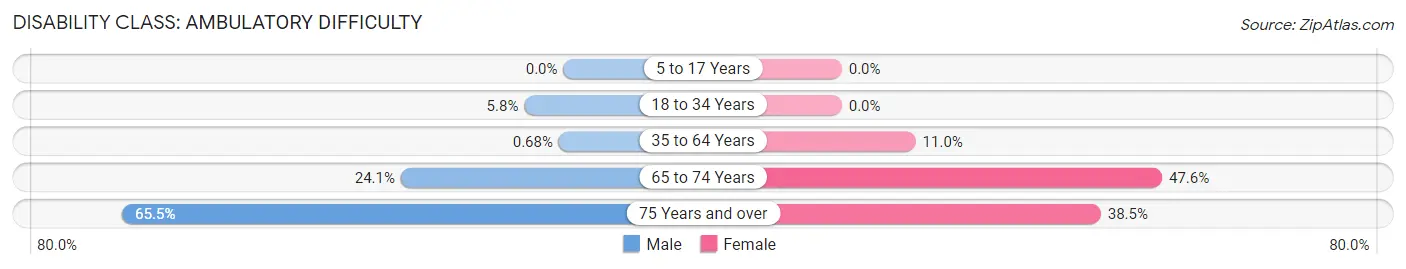
| Age Bracket | Male | Female |
| 5 to 17 Years | 0 (0.0%) | 0 (0.0%) |
| 18 to 34 Years | 5 (5.8%) | 0 (0.0%) |
| 35 to 64 Years | 1 (0.7%) | 17 (11.0%) |
| 65 to 74 Years | 7 (24.1%) | 39 (47.6%) |
| 75 Years and over | 19 (65.5%) | 5 (38.5%) |
Disability Class: Self-Care Difficulty
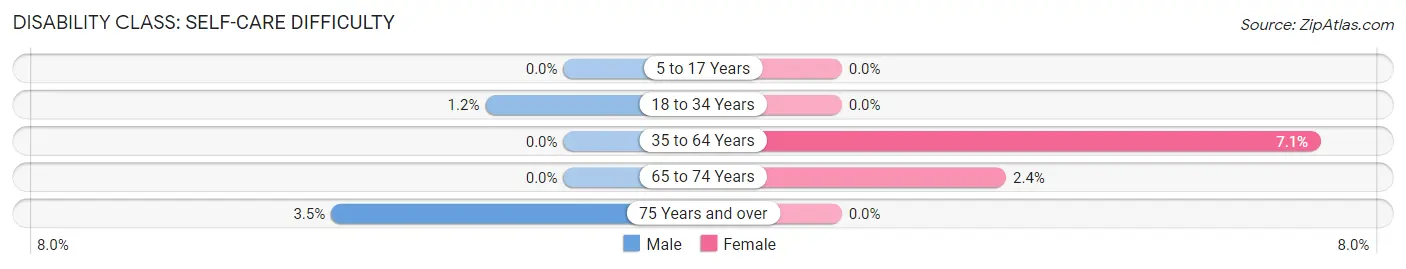
| Age Bracket | Male | Female |
| 5 to 17 Years | 0 (0.0%) | 0 (0.0%) |
| 18 to 34 Years | 1 (1.2%) | 0 (0.0%) |
| 35 to 64 Years | 0 (0.0%) | 11 (7.1%) |
| 65 to 74 Years | 0 (0.0%) | 2 (2.4%) |
| 75 Years and over | 1 (3.5%) | 0 (0.0%) |
Technology Access in Port Gamble Tribal Community
Computing Device Access in Port Gamble Tribal Community
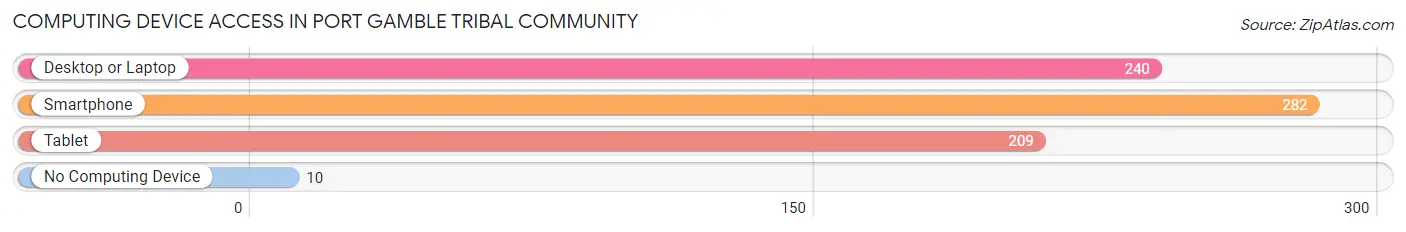
| Device Type | # Households | % Households |
| Desktop or Laptop | 240 | 79.2% |
| Smartphone | 282 | 93.1% |
| Tablet | 209 | 69.0% |
| No Computing Device | 10 | 3.3% |
| Total | 303 | 100.0% |
Internet Access in Port Gamble Tribal Community
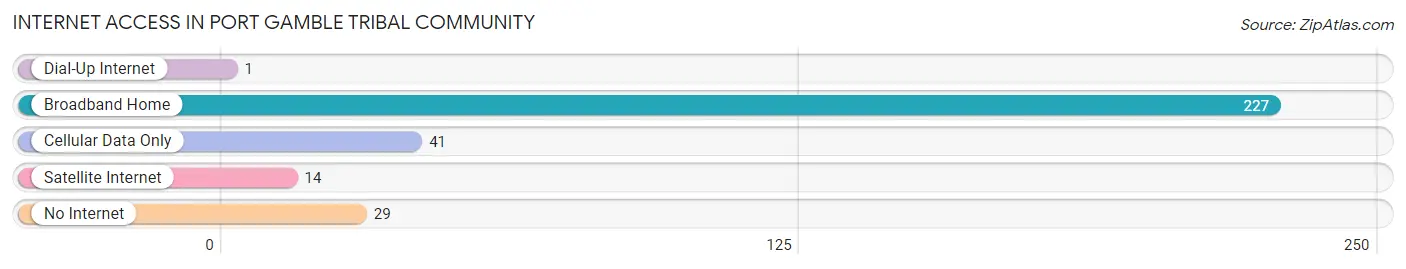
| Internet Type | # Households | % Households |
| Dial-Up Internet | 1 | 0.3% |
| Broadband Home | 227 | 74.9% |
| Cellular Data Only | 41 | 13.5% |
| Satellite Internet | 14 | 4.6% |
| No Internet | 29 | 9.6% |
| Total | 303 | 100.0% |
Port Gamble Tribal Community Summary
The Port Gamble Tribal Community is a federally recognized Native American tribe located in Kitsap County, Washington. The tribe is a member of the S'Klallam Tribe, which is composed of seven distinct communities. The Port Gamble Tribal Community is located on the Port Gamble S'Klallam Reservation, which is located on the northern tip of the Kitsap Peninsula. The reservation is approximately 2,500 acres in size and is bordered by Hood Canal, the Puget Sound, and the Olympic Mountains.
The Port Gamble Tribal Community is a vibrant and diverse community with a rich history and culture. The tribe has a long and proud history of self-governance and self-determination. The tribe is governed by a seven-member Tribal Council, which is elected by the tribal members. The Tribal Council is responsible for the day-to-day operations of the tribe, including the development of tribal policies and programs.
The Port Gamble Tribal Community is a vibrant and diverse community with a rich history and culture. The tribe has a long and proud history of self-governance and self-determination. The tribe is governed by a seven-member Tribal Council, which is elected by the tribal members. The Tribal Council is responsible for the day-to-day operations of the tribe, including the development of tribal policies and programs.
The Port Gamble Tribal Community is located in Kitsap County, Washington. The reservation is located on the northern tip of the Kitsap Peninsula, and is bordered by Hood Canal, the Puget Sound, and the Olympic Mountains. The reservation is approximately 2,500 acres in size and is home to approximately 1,000 tribal members. The reservation is home to a variety of wildlife, including deer, elk, bear, and salmon.
The Port Gamble Tribal Community has a strong economy, which is based primarily on timber harvesting, fishing, and tourism. The tribe operates a number of businesses, including a sawmill, a fish hatchery, and a casino. The tribe also operates a number of cultural and educational programs, including a language program, a cultural center, and a museum.
The Port Gamble Tribal Community has a population of approximately 1,000 tribal members. The population is diverse, with members of many different backgrounds and cultures. The majority of the population is Native American, with a small percentage of non-Native Americans. The median age of the population is 35, and the median household income is $45,000.
The Port Gamble Tribal Community is a vibrant and diverse community with a rich history and culture. The tribe has a long and proud history of self-governance and self-determination. The tribe is governed by a seven-member Tribal Council, which is elected by the tribal members. The Tribal Council is responsible for the day-to-day operations of the tribe, including the development of tribal policies and programs. The tribe has a strong economy, which is based primarily on timber harvesting, fishing, and tourism. The tribe also operates a number of cultural and educational programs, including a language program, a cultural center, and a museum. The population of the Port Gamble Tribal Community is approximately 1,000 tribal members, and is diverse, with members of many different backgrounds and cultures. The median age of the population is 35, and the median household income is $45,000.
Common Questions
What is Per Capita Income in Port Gamble Tribal Community?
Per Capita income in Port Gamble Tribal Community is $35,773.
What is the Median Family Income in Port Gamble Tribal Community?
Median Family Income in Port Gamble Tribal Community is $68,750.
What is the Median Household income in Port Gamble Tribal Community?
Median Household Income in Port Gamble Tribal Community is $77,188.
What is Income or Wage Gap in Port Gamble Tribal Community?
Income or Wage Gap in Port Gamble Tribal Community is 28.7%.
Women in Port Gamble Tribal Community earn 71.3 cents for every dollar earned by a man.
What is Family Income Deficit in Port Gamble Tribal Community?
Family Income Deficit in Port Gamble Tribal Community is $10,143.
Families that are below poverty line in Port Gamble Tribal Community earn $10,143 less on average than the poverty threshold level.
What is Inequality or Gini Index in Port Gamble Tribal Community?
Inequality or Gini Index in Port Gamble Tribal Community is 0.44.
What is the Total Population of Port Gamble Tribal Community?
Total Population of Port Gamble Tribal Community is 850.
What is the Total Male Population of Port Gamble Tribal Community?
Total Male Population of Port Gamble Tribal Community is 389.
What is the Total Female Population of Port Gamble Tribal Community?
Total Female Population of Port Gamble Tribal Community is 461.
What is the Ratio of Males per 100 Females in Port Gamble Tribal Community?
There are 84.38 Males per 100 Females in Port Gamble Tribal Community.
What is the Ratio of Females per 100 Males in Port Gamble Tribal Community?
There are 118.51 Females per 100 Males in Port Gamble Tribal Community.
What is the Median Population Age in Port Gamble Tribal Community?
Median Population Age in Port Gamble Tribal Community is 37.6 Years.
What is the Average Family Size in Port Gamble Tribal Community
Average Family Size in Port Gamble Tribal Community is 2.8 People.
What is the Average Household Size in Port Gamble Tribal Community
Average Household Size in Port Gamble Tribal Community is 2.8 People.
How Large is the Labor Force in Port Gamble Tribal Community?
There are 374 People in the Labor Forcein in Port Gamble Tribal Community.
What is the Percentage of People in the Labor Force in Port Gamble Tribal Community?
56.8% of People are in the Labor Force in Port Gamble Tribal Community.
What is the Unemployment Rate in Port Gamble Tribal Community?
Unemployment Rate in Port Gamble Tribal Community is 7.2%.