Cities with the Highest Percentage of Lithuanian Population in Washington
RELATED REPORTS & OPTIONS
Lithuanian
Washington
Compare Cities
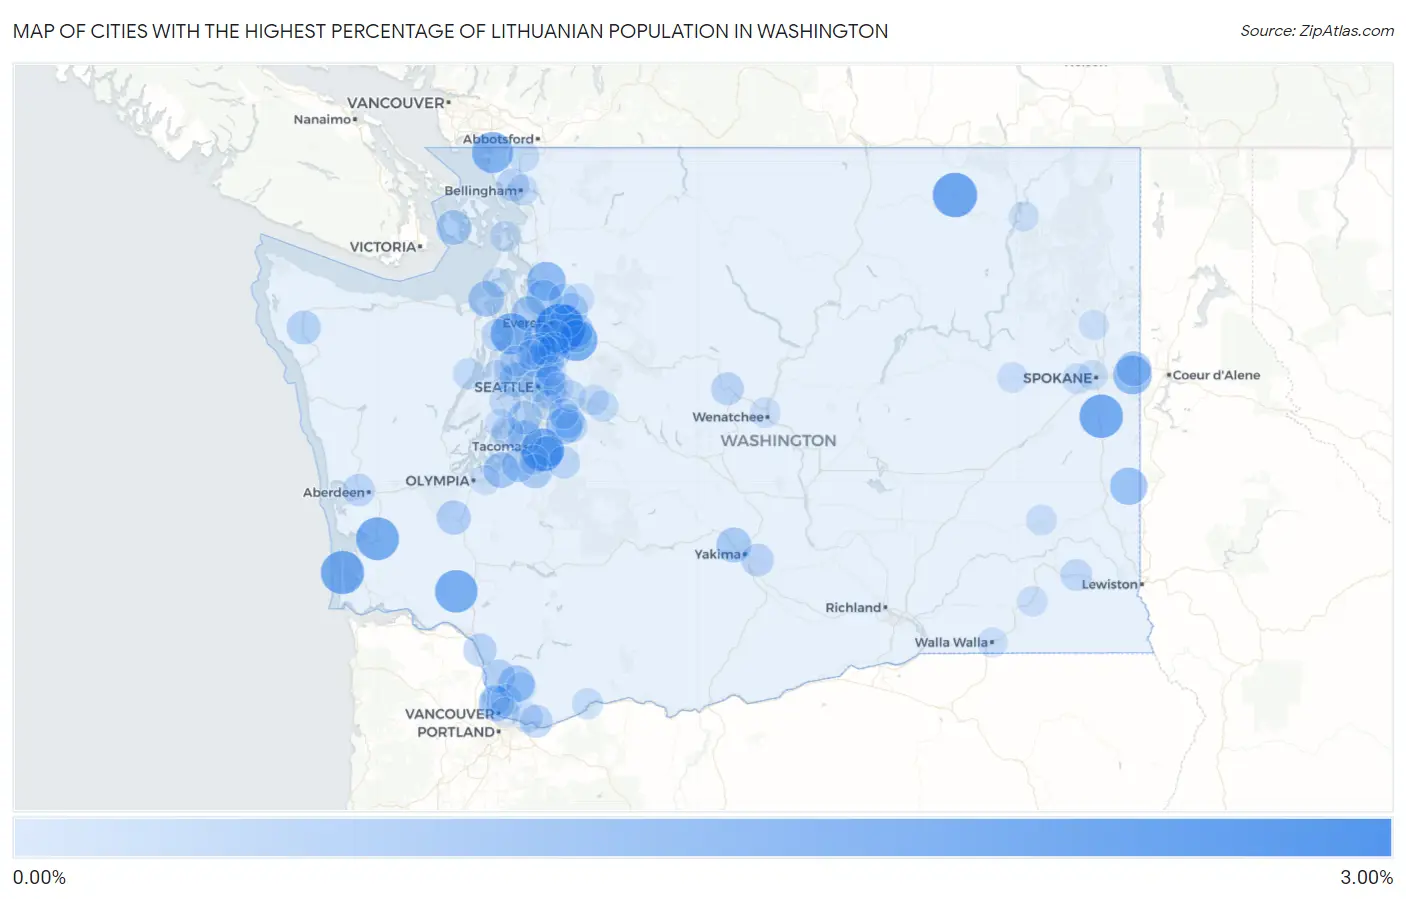
Map of Cities with the Highest Percentage of Lithuanian Population in Washington
0.00%
3.00%
Cities with the Highest Percentage of Lithuanian Population in Washington
| City | Lithuanian | vs State | vs National | |
| 1. | Fobes Hill | 2.50% | 0.16%(+2.34)#1 | 0.19%(+2.32)#334 |
| 2. | Curlew Lake | 1.88% | 0.16%(+1.72)#2 | 0.19%(+1.70)#511 |
| 3. | Spangle | 1.76% | 0.16%(+1.60)#3 | 0.19%(+1.58)#557 |
| 4. | Ocean Park | 1.73% | 0.16%(+1.57)#4 | 0.19%(+1.55)#578 |
| 5. | Edgewood | 1.69% | 0.16%(+1.53)#5 | 0.19%(+1.51)#597 |
| 6. | Raymond | 1.68% | 0.16%(+1.52)#6 | 0.19%(+1.50)#607 |
| 7. | Ryderwood | 1.65% | 0.16%(+1.48)#7 | 0.19%(+1.46)#627 |
| 8. | Monroe North | 1.60% | 0.16%(+1.43)#8 | 0.19%(+1.41)#650 |
| 9. | Hansville | 1.48% | 0.16%(+1.32)#9 | 0.19%(+1.29)#721 |
| 10. | Blaine | 1.47% | 0.16%(+1.30)#10 | 0.19%(+1.28)#730 |
| 11. | Sunday Lake | 1.20% | 0.16%(+1.04)#11 | 0.19%(+1.02)#916 |
| 12. | Liberty Lake | 1.17% | 0.16%(+1.01)#12 | 0.19%(+0.987)#941 |
| 13. | Garfield | 1.02% | 0.16%(+0.861)#13 | 0.19%(+0.839)#1,115 |
| 14. | Lewisville | 0.93% | 0.16%(+0.767)#14 | 0.19%(+0.744)#1,277 |
| 15. | Covington | 0.89% | 0.16%(+0.726)#15 | 0.19%(+0.704)#1,361 |
| 16. | Port Townsend | 0.83% | 0.16%(+0.664)#16 | 0.19%(+0.642)#1,479 |
| 17. | Dupont | 0.82% | 0.16%(+0.661)#17 | 0.19%(+0.639)#1,484 |
| 18. | Lake Goodwin | 0.77% | 0.16%(+0.607)#18 | 0.19%(+0.585)#1,599 |
| 19. | Lake Shore | 0.74% | 0.16%(+0.581)#19 | 0.19%(+0.559)#1,645 |
| 20. | Langley | 0.74% | 0.16%(+0.580)#20 | 0.19%(+0.558)#1,647 |
| 21. | Gleed | 0.74% | 0.16%(+0.580)#21 | 0.19%(+0.558)#1,649 |
| 22. | Otis Orchards East Farms | 0.74% | 0.16%(+0.574)#22 | 0.19%(+0.552)#1,658 |
| 23. | Friday Harbor | 0.72% | 0.16%(+0.555)#23 | 0.19%(+0.533)#1,696 |
| 24. | North Puyallup | 0.71% | 0.16%(+0.549)#24 | 0.19%(+0.527)#1,713 |
| 25. | Frederickson | 0.66% | 0.16%(+0.500)#25 | 0.19%(+0.478)#1,836 |
| 26. | Rochester | 0.65% | 0.16%(+0.490)#26 | 0.19%(+0.467)#1,862 |
| 27. | Bainbridge Island | 0.64% | 0.16%(+0.477)#27 | 0.19%(+0.455)#1,902 |
| 28. | Browns Point | 0.64% | 0.16%(+0.475)#28 | 0.19%(+0.453)#1,909 |
| 29. | Forks | 0.62% | 0.16%(+0.458)#29 | 0.19%(+0.436)#1,961 |
| 30. | Mcchord Afb | 0.62% | 0.16%(+0.458)#30 | 0.19%(+0.436)#1,962 |
| 31. | Vashon | 0.61% | 0.16%(+0.449)#31 | 0.19%(+0.427)#1,989 |
| 32. | Bothell East | 0.61% | 0.16%(+0.446)#32 | 0.19%(+0.424)#2,004 |
| 33. | Three Lakes | 0.59% | 0.16%(+0.425)#33 | 0.19%(+0.403)#2,079 |
| 34. | Mercer Island | 0.59% | 0.16%(+0.422)#34 | 0.19%(+0.400)#2,089 |
| 35. | La Center | 0.57% | 0.16%(+0.407)#35 | 0.19%(+0.385)#2,146 |
| 36. | Shadow Lake | 0.57% | 0.16%(+0.404)#36 | 0.19%(+0.382)#2,161 |
| 37. | Lochsloy | 0.56% | 0.16%(+0.397)#37 | 0.19%(+0.375)#2,193 |
| 38. | Lake Forest Park | 0.56% | 0.16%(+0.394)#38 | 0.19%(+0.372)#2,208 |
| 39. | Cavalero | 0.55% | 0.16%(+0.386)#39 | 0.19%(+0.364)#2,244 |
| 40. | Kalama | 0.54% | 0.16%(+0.379)#40 | 0.19%(+0.357)#2,280 |
| 41. | Shoreline | 0.52% | 0.16%(+0.360)#41 | 0.19%(+0.338)#2,358 |
| 42. | Picnic Point | 0.52% | 0.16%(+0.359)#42 | 0.19%(+0.337)#2,361 |
| 43. | Kenmore | 0.50% | 0.16%(+0.341)#43 | 0.19%(+0.319)#2,428 |
| 44. | Leavenworth | 0.50% | 0.16%(+0.333)#44 | 0.19%(+0.311)#2,455 |
| 45. | Washougal | 0.49% | 0.16%(+0.324)#45 | 0.19%(+0.302)#2,486 |
| 46. | Marietta Alderwood | 0.48% | 0.16%(+0.321)#46 | 0.19%(+0.299)#2,495 |
| 47. | Moxee | 0.48% | 0.16%(+0.313)#47 | 0.19%(+0.291)#2,536 |
| 48. | Suquamish | 0.44% | 0.16%(+0.276)#48 | 0.19%(+0.254)#2,690 |
| 49. | Maple Valley | 0.44% | 0.16%(+0.274)#49 | 0.19%(+0.252)#2,699 |
| 50. | Hoquiam | 0.43% | 0.16%(+0.272)#50 | 0.19%(+0.250)#2,710 |
| 51. | Prairie Heights | 0.43% | 0.16%(+0.270)#51 | 0.19%(+0.248)#2,719 |
| 52. | Chain Lake | 0.43% | 0.16%(+0.266)#52 | 0.19%(+0.244)#2,739 |
| 53. | Port Ludlow | 0.42% | 0.16%(+0.257)#53 | 0.19%(+0.235)#2,792 |
| 54. | Eastmont | 0.41% | 0.16%(+0.251)#54 | 0.19%(+0.229)#2,827 |
| 55. | Gig Harbor | 0.41% | 0.16%(+0.248)#55 | 0.19%(+0.226)#2,845 |
| 56. | Issaquah | 0.37% | 0.16%(+0.202)#56 | 0.19%(+0.180)#3,115 |
| 57. | East Port Orchard | 0.36% | 0.16%(+0.200)#57 | 0.19%(+0.178)#3,126 |
| 58. | Pomeroy | 0.36% | 0.16%(+0.195)#58 | 0.19%(+0.173)#3,151 |
| 59. | Barberton | 0.35% | 0.16%(+0.189)#59 | 0.19%(+0.167)#3,190 |
| 60. | Lynnwood | 0.35% | 0.16%(+0.188)#60 | 0.19%(+0.166)#3,200 |
| 61. | Seattle | 0.35% | 0.16%(+0.182)#61 | 0.19%(+0.160)#3,235 |
| 62. | Brinnon | 0.34% | 0.16%(+0.180)#62 | 0.19%(+0.158)#3,249 |
| 63. | Edmonds | 0.33% | 0.16%(+0.169)#63 | 0.19%(+0.147)#3,315 |
| 64. | Sumner | 0.31% | 0.16%(+0.149)#64 | 0.19%(+0.126)#3,465 |
| 65. | Lynden | 0.31% | 0.16%(+0.142)#65 | 0.19%(+0.120)#3,519 |
| 66. | Stevenson | 0.29% | 0.16%(+0.131)#66 | 0.19%(+0.109)#3,597 |
| 67. | North Bend | 0.29% | 0.16%(+0.128)#67 | 0.19%(+0.106)#3,622 |
| 68. | Bellingham | 0.27% | 0.16%(+0.107)#68 | 0.19%(+0.085)#3,802 |
| 69. | Felida | 0.27% | 0.16%(+0.103)#69 | 0.19%(+0.081)#3,846 |
| 70. | Clyde Hill | 0.26% | 0.16%(+0.094)#70 | 0.19%(+0.072)#3,922 |
| 71. | Canyon Creek | 0.25% | 0.16%(+0.091)#71 | 0.19%(+0.068)#3,948 |
| 72. | Indianola | 0.25% | 0.16%(+0.090)#72 | 0.19%(+0.068)#3,953 |
| 73. | Anacortes | 0.24% | 0.16%(+0.080)#73 | 0.19%(+0.058)#4,047 |
| 74. | Camas | 0.24% | 0.16%(+0.079)#74 | 0.19%(+0.057)#4,056 |
| 75. | Lacrosse | 0.24% | 0.16%(+0.077)#75 | 0.19%(+0.055)#4,086 |
| 76. | Snoqualmie | 0.24% | 0.16%(+0.077)#76 | 0.19%(+0.055)#4,087 |
| 77. | Airway Heights | 0.24% | 0.16%(+0.073)#77 | 0.19%(+0.051)#4,111 |
| 78. | Sisco Heights | 0.24% | 0.16%(+0.072)#78 | 0.19%(+0.050)#4,124 |
| 79. | Yarrow Point | 0.23% | 0.16%(+0.071)#79 | 0.19%(+0.049)#4,137 |
| 80. | Wenatchee | 0.23% | 0.16%(+0.066)#80 | 0.19%(+0.044)#4,194 |
| 81. | Bryn Mawr Skyway | 0.22% | 0.16%(+0.059)#81 | 0.19%(+0.037)#4,282 |
| 82. | Kirkland | 0.22% | 0.16%(+0.059)#82 | 0.19%(+0.037)#4,283 |
| 83. | Spokane | 0.22% | 0.16%(+0.055)#83 | 0.19%(+0.033)#4,322 |
| 84. | Dayton | 0.22% | 0.16%(+0.054)#84 | 0.19%(+0.032)#4,339 |
| 85. | Davenport | 0.22% | 0.16%(+0.053)#85 | 0.19%(+0.031)#4,347 |
| 86. | Venersborg | 0.21% | 0.16%(+0.051)#86 | 0.19%(+0.028)#4,374 |
| 87. | Wauna | 0.21% | 0.16%(+0.050)#87 | 0.19%(+0.028)#4,385 |
| 88. | Bellevue | 0.21% | 0.16%(+0.049)#88 | 0.19%(+0.027)#4,391 |
| 89. | Maple Heights Lake Desire | 0.20% | 0.16%(+0.041)#89 | 0.19%(+0.019)#4,495 |
| 90. | Mill Creek East | 0.20% | 0.16%(+0.034)#90 | 0.19%(+0.012)#4,552 |
| 91. | Coupeville | 0.20% | 0.16%(+0.033)#91 | 0.19%(+0.011)#4,568 |
| 92. | Lacey | 0.19% | 0.16%(+0.025)#92 | 0.19%(+0.003)#4,659 |
| 93. | Kettle Falls | 0.19% | 0.16%(+0.025)#93 | 0.19%(+0.003)#4,666 |
| 94. | Vancouver | 0.19% | 0.16%(+0.024)#94 | 0.19%(+0.002)#4,673 |
| 95. | Summit | 0.18% | 0.16%(+0.018)#95 | 0.19%(-0.004)#4,746 |
| 96. | Alderwood Manor | 0.18% | 0.16%(+0.017)#96 | 0.19%(-0.005)#4,756 |
| 97. | Silverdale | 0.18% | 0.16%(+0.016)#97 | 0.19%(-0.006)#4,769 |
| 98. | Woodway | 0.18% | 0.16%(+0.016)#98 | 0.19%(-0.006)#4,773 |
| 99. | Deer Park | 0.18% | 0.16%(+0.015)#99 | 0.19%(-0.007)#4,779 |
| 100. | Walla Walla | 0.18% | 0.16%(+0.014)#100 | 0.19%(-0.008)#4,797 |
Common Questions
What are the Top 10 Cities with the Highest Percentage of Lithuanian Population in Washington?
Top 10 Cities with the Highest Percentage of Lithuanian Population in Washington are:
#1
2.50%
#2
1.88%
#3
1.76%
#4
1.73%
#5
1.69%
#6
1.68%
#7
1.65%
#8
1.60%
#9
1.48%
#10
1.47%
What city has the Highest Percentage of Lithuanian Population in Washington?
Fobes Hill has the Highest Percentage of Lithuanian Population in Washington with 2.50%.
What is the Percentage of Lithuanian Population in the State of Washington?
Percentage of Lithuanian Population in Washington is 0.16%.
What is the Percentage of Lithuanian Population in the United States?
Percentage of Lithuanian Population in the United States is 0.19%.