Cities with the Highest Percentage of Immigrants from Bulgaria in Washington
RELATED REPORTS & OPTIONS
Bulgaria
Washington
Compare Cities
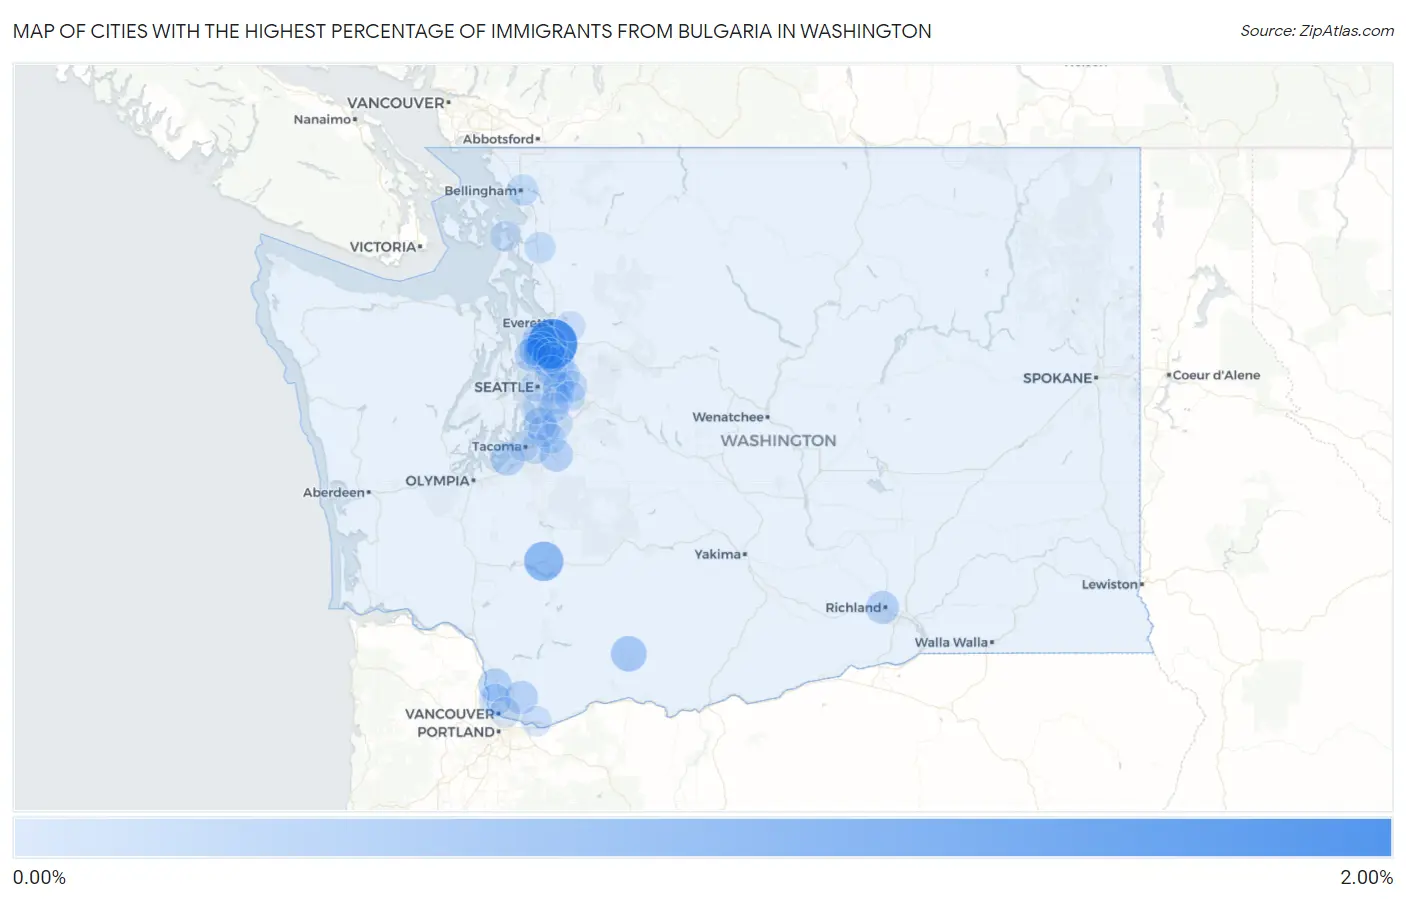
Map of Cities with the Highest Percentage of Immigrants from Bulgaria in Washington
0.00%
2.00%
Cities with the Highest Percentage of Immigrants from Bulgaria in Washington
| City | Bulgaria | vs State | vs National | |
| 1. | Mill Creek | 1.78% | 0.037%(+1.74)#1 | 0.022%(+1.76)#22 |
| 2. | Morton | 0.83% | 0.037%(+0.788)#2 | 0.022%(+0.803)#69 |
| 3. | Martha Lake | 0.55% | 0.037%(+0.517)#3 | 0.022%(+0.532)#112 |
| 4. | Trout Lake | 0.49% | 0.037%(+0.449)#4 | 0.022%(+0.464)#131 |
| 5. | Picnic Point | 0.42% | 0.037%(+0.385)#5 | 0.022%(+0.400)#156 |
| 6. | Lynnwood | 0.33% | 0.037%(+0.296)#6 | 0.022%(+0.311)#196 |
| 7. | Steilacoom | 0.30% | 0.037%(+0.262)#7 | 0.022%(+0.277)#218 |
| 8. | Ridgefield | 0.29% | 0.037%(+0.250)#8 | 0.022%(+0.265)#230 |
| 9. | Mountlake Terrace | 0.28% | 0.037%(+0.239)#9 | 0.022%(+0.254)#239 |
| 10. | Bonney Lake | 0.27% | 0.037%(+0.237)#10 | 0.022%(+0.252)#241 |
| 11. | Hockinson | 0.27% | 0.037%(+0.237)#11 | 0.022%(+0.252)#242 |
| 12. | Richland | 0.27% | 0.037%(+0.232)#12 | 0.022%(+0.247)#245 |
| 13. | Woodway | 0.27% | 0.037%(+0.231)#13 | 0.022%(+0.246)#247 |
| 14. | Des Moines | 0.23% | 0.037%(+0.192)#14 | 0.022%(+0.207)#286 |
| 15. | Woodinville | 0.22% | 0.037%(+0.181)#15 | 0.022%(+0.196)#297 |
| 16. | Felida | 0.19% | 0.037%(+0.153)#16 | 0.022%(+0.168)#341 |
| 17. | Redmond | 0.18% | 0.037%(+0.145)#17 | 0.022%(+0.159)#353 |
| 18. | Sammamish | 0.15% | 0.037%(+0.115)#18 | 0.022%(+0.129)#411 |
| 19. | Kenmore | 0.15% | 0.037%(+0.111)#19 | 0.022%(+0.126)#414 |
| 20. | Bellevue | 0.14% | 0.037%(+0.104)#20 | 0.022%(+0.119)#429 |
| 21. | Bothell West | 0.14% | 0.037%(+0.104)#21 | 0.022%(+0.119)#430 |
| 22. | Edmonds | 0.13% | 0.037%(+0.094)#22 | 0.022%(+0.109)#450 |
| 23. | Lakeland North | 0.13% | 0.037%(+0.090)#23 | 0.022%(+0.105)#461 |
| 24. | Bellingham | 0.10% | 0.037%(+0.065)#24 | 0.022%(+0.079)#526 |
| 25. | Kirkland | 0.090% | 0.037%(+0.053)#25 | 0.022%(+0.068)#560 |
| 26. | Mount Vernon | 0.085% | 0.037%(+0.048)#26 | 0.022%(+0.063)#572 |
| 27. | Burien | 0.082% | 0.037%(+0.044)#27 | 0.022%(+0.059)#586 |
| 28. | Seattle | 0.071% | 0.037%(+0.034)#28 | 0.022%(+0.048)#638 |
| 29. | Fife | 0.064% | 0.037%(+0.027)#29 | 0.022%(+0.042)#671 |
| 30. | Newcastle | 0.062% | 0.037%(+0.025)#30 | 0.022%(+0.039)#683 |
| 31. | Vancouver | 0.044% | 0.037%(+0.006)#31 | 0.022%(+0.021)#791 |
| 32. | Everett | 0.035% | 0.037%(-0.002)#32 | 0.022%(+0.013)#843 |
| 33. | Issaquah | 0.030% | 0.037%(-0.007)#33 | 0.022%(+0.008)#883 |
| 34. | Washougal | 0.030% | 0.037%(-0.007)#34 | 0.022%(+0.007)#892 |
| 35. | Bothell | 0.029% | 0.037%(-0.008)#35 | 0.022%(+0.007)#896 |
| 36. | Kent | 0.028% | 0.037%(-0.009)#36 | 0.022%(+0.006)#906 |
| 37. | Renton | 0.024% | 0.037%(-0.013)#37 | 0.022%(+0.001)#939 |
| 38. | Anacortes | 0.017% | 0.037%(-0.020)#38 | 0.022%(-0.005)#998 |
| 39. | Auburn | 0.011% | 0.037%(-0.027)#39 | 0.022%(-0.012)#1,068 |
| 40. | Tacoma | 0.010% | 0.037%(-0.027)#40 | 0.022%(-0.012)#1,074 |
Common Questions
What are the Top 10 Cities with the Highest Percentage of Immigrants from Bulgaria in Washington?
Top 10 Cities with the Highest Percentage of Immigrants from Bulgaria in Washington are:
#1
1.78%
#2
0.83%
#3
0.55%
#4
0.49%
#5
0.42%
#6
0.33%
#7
0.30%
#8
0.29%
#9
0.28%
#10
0.27%
What city has the Highest Percentage of Immigrants from Bulgaria in Washington?
Mill Creek has the Highest Percentage of Immigrants from Bulgaria in Washington with 1.78%.
What is the Percentage of Immigrants from Bulgaria in the State of Washington?
Percentage of Immigrants from Bulgaria in Washington is 0.037%.
What is the Percentage of Immigrants from Bulgaria in the United States?
Percentage of Immigrants from Bulgaria in the United States is 0.022%.