Cities with the Highest Percentage of Immigrants from Europe in Washington
RELATED REPORTS & OPTIONS
Europe
Washington
Compare Cities
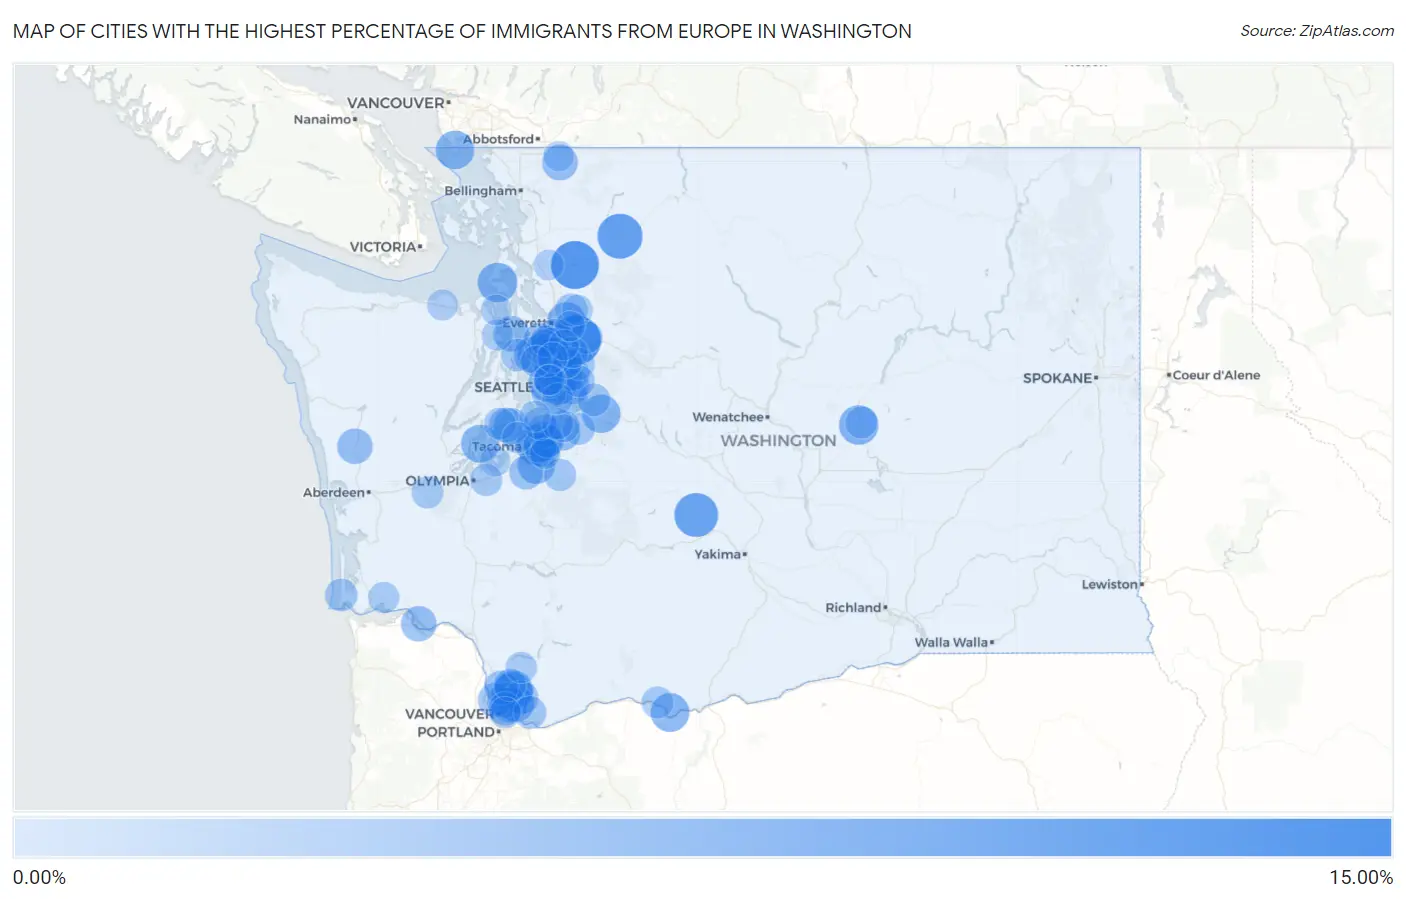
Map of Cities with the Highest Percentage of Immigrants from Europe in Washington
0.00%
15.00%
Cities with the Highest Percentage of Immigrants from Europe in Washington
| City | Europe | vs State | vs National | |
| 1. | Monroe North | 12.55% | 2.13%(+10.4)#1 | 1.46%(+11.1)#125 |
| 2. | Lake Cavanaugh | 11.73% | 2.13%(+9.60)#2 | 1.46%(+10.3)#149 |
| 3. | Rockport | 10.17% | 2.13%(+8.04)#3 | 1.46%(+8.71)#203 |
| 4. | Nile | 9.57% | 2.13%(+7.44)#4 | 1.46%(+8.11)#237 |
| 5. | Fife Heights | 7.76% | 2.13%(+5.63)#5 | 1.46%(+6.30)#381 |
| 6. | Meadow Glade | 7.49% | 2.13%(+5.36)#6 | 1.46%(+6.03)#415 |
| 7. | Coupeville | 7.45% | 2.13%(+5.32)#7 | 1.46%(+6.00)#420 |
| 8. | Lakeview | 7.34% | 2.13%(+5.21)#8 | 1.46%(+5.88)#432 |
| 9. | Battle Ground | 6.98% | 2.13%(+4.85)#9 | 1.46%(+5.52)#477 |
| 10. | Dallesport | 6.94% | 2.13%(+4.82)#10 | 1.46%(+5.49)#486 |
| 11. | Lakeland South | 6.89% | 2.13%(+4.77)#11 | 1.46%(+5.44)#493 |
| 12. | Point Roberts | 6.89% | 2.13%(+4.76)#12 | 1.46%(+5.43)#496 |
| 13. | Wilderness Rim | 6.84% | 2.13%(+4.71)#13 | 1.46%(+5.38)#500 |
| 14. | Medina | 6.71% | 2.13%(+4.58)#14 | 1.46%(+5.25)#518 |
| 15. | Cavalero | 6.66% | 2.13%(+4.53)#15 | 1.46%(+5.20)#532 |
| 16. | Herron Island | 6.56% | 2.13%(+4.43)#16 | 1.46%(+5.10)#550 |
| 17. | Summit View | 6.42% | 2.13%(+4.30)#17 | 1.46%(+4.97)#584 |
| 18. | Esperance | 6.37% | 2.13%(+4.25)#18 | 1.46%(+4.92)#597 |
| 19. | Woodinville | 5.92% | 2.13%(+3.80)#19 | 1.46%(+4.47)#694 |
| 20. | Redmond | 5.78% | 2.13%(+3.65)#20 | 1.46%(+4.32)#732 |
| 21. | Sammamish | 5.75% | 2.13%(+3.62)#21 | 1.46%(+4.29)#737 |
| 22. | Lake Morton Berrydale | 5.63% | 2.13%(+3.51)#22 | 1.46%(+4.18)#768 |
| 23. | Orchards | 5.61% | 2.13%(+3.49)#23 | 1.46%(+4.16)#772 |
| 24. | Maplewood | 5.58% | 2.13%(+3.46)#24 | 1.46%(+4.13)#784 |
| 25. | Kendall | 5.42% | 2.13%(+3.30)#25 | 1.46%(+3.97)#840 |
| 26. | Hansville | 5.42% | 2.13%(+3.30)#26 | 1.46%(+3.97)#841 |
| 27. | Roche Harbor | 5.31% | 2.13%(+3.19)#27 | 1.46%(+3.86)#873 |
| 28. | Humptulips | 5.31% | 2.13%(+3.18)#28 | 1.46%(+3.85)#877 |
| 29. | Puget Island | 5.30% | 2.13%(+3.17)#29 | 1.46%(+3.84)#881 |
| 30. | Five Corners | 5.22% | 2.13%(+3.09)#30 | 1.46%(+3.77)#907 |
| 31. | Issaquah | 5.22% | 2.13%(+3.09)#31 | 1.46%(+3.76)#908 |
| 32. | Barberton | 5.21% | 2.13%(+3.08)#32 | 1.46%(+3.75)#910 |
| 33. | Woodway | 5.19% | 2.13%(+3.06)#33 | 1.46%(+3.73)#916 |
| 34. | Maltby | 5.17% | 2.13%(+3.05)#34 | 1.46%(+3.72)#923 |
| 35. | Eastmont | 5.04% | 2.13%(+2.91)#35 | 1.46%(+3.58)#955 |
| 36. | Bellevue | 5.02% | 2.13%(+2.89)#36 | 1.46%(+3.56)#961 |
| 37. | Mercer Island | 5.00% | 2.13%(+2.88)#37 | 1.46%(+3.55)#966 |
| 38. | Martha Lake | 4.99% | 2.13%(+2.87)#38 | 1.46%(+3.54)#973 |
| 39. | Canterwood | 4.91% | 2.13%(+2.79)#39 | 1.46%(+3.46)#997 |
| 40. | Felida | 4.70% | 2.13%(+2.57)#40 | 1.46%(+3.24)#1,094 |
| 41. | Hockinson | 4.66% | 2.13%(+2.54)#41 | 1.46%(+3.21)#1,107 |
| 42. | Edgewood | 4.63% | 2.13%(+2.50)#42 | 1.46%(+3.17)#1,123 |
| 43. | Union Hill Novelty Hill | 4.62% | 2.13%(+2.49)#43 | 1.46%(+3.16)#1,131 |
| 44. | Duluth | 4.58% | 2.13%(+2.45)#44 | 1.46%(+3.12)#1,154 |
| 45. | Kirkland | 4.56% | 2.13%(+2.43)#45 | 1.46%(+3.10)#1,164 |
| 46. | Spanaway | 4.54% | 2.13%(+2.41)#46 | 1.46%(+3.08)#1,174 |
| 47. | Picnic Point | 4.48% | 2.13%(+2.36)#47 | 1.46%(+3.03)#1,190 |
| 48. | Minnehaha | 4.38% | 2.13%(+2.25)#48 | 1.46%(+2.92)#1,240 |
| 49. | Lakeland North | 4.31% | 2.13%(+2.19)#49 | 1.46%(+2.86)#1,270 |
| 50. | Milton | 4.12% | 2.13%(+1.99)#50 | 1.46%(+2.66)#1,347 |
| 51. | Clyde Hill | 4.12% | 2.13%(+1.99)#51 | 1.46%(+2.66)#1,350 |
| 52. | Bothell West | 4.04% | 2.13%(+1.91)#52 | 1.46%(+2.58)#1,391 |
| 53. | Fern Prairie | 4.01% | 2.13%(+1.88)#53 | 1.46%(+2.55)#1,411 |
| 54. | Algona | 3.98% | 2.13%(+1.86)#54 | 1.46%(+2.53)#1,431 |
| 55. | Snoqualmie | 3.96% | 2.13%(+1.83)#55 | 1.46%(+2.50)#1,441 |
| 56. | Lochsloy | 3.96% | 2.13%(+1.83)#56 | 1.46%(+2.50)#1,443 |
| 57. | Des Moines | 3.95% | 2.13%(+1.82)#57 | 1.46%(+2.49)#1,445 |
| 58. | Kingston | 3.93% | 2.13%(+1.81)#58 | 1.46%(+2.48)#1,453 |
| 59. | Woods Creek | 3.90% | 2.13%(+1.78)#59 | 1.46%(+2.45)#1,476 |
| 60. | Long Beach | 3.88% | 2.13%(+1.75)#60 | 1.46%(+2.42)#1,488 |
| 61. | Ravensdale | 3.78% | 2.13%(+1.66)#61 | 1.46%(+2.33)#1,544 |
| 62. | Mill Creek | 3.76% | 2.13%(+1.63)#62 | 1.46%(+2.30)#1,564 |
| 63. | Duvall | 3.75% | 2.13%(+1.63)#63 | 1.46%(+2.30)#1,567 |
| 64. | Cherry Grove | 3.73% | 2.13%(+1.60)#64 | 1.46%(+2.27)#1,578 |
| 65. | Crocker | 3.69% | 2.13%(+1.57)#65 | 1.46%(+2.24)#1,596 |
| 66. | Tanglewilde | 3.65% | 2.13%(+1.53)#66 | 1.46%(+2.20)#1,629 |
| 67. | Covington | 3.63% | 2.13%(+1.51)#67 | 1.46%(+2.18)#1,642 |
| 68. | Soap Lake | 3.63% | 2.13%(+1.50)#68 | 1.46%(+2.17)#1,646 |
| 69. | Wauna | 3.60% | 2.13%(+1.48)#69 | 1.46%(+2.15)#1,672 |
| 70. | Lyle | 3.54% | 2.13%(+1.42)#70 | 1.46%(+2.09)#1,717 |
| 71. | Ames Lake | 3.52% | 2.13%(+1.39)#71 | 1.46%(+2.06)#1,737 |
| 72. | Malone | 3.52% | 2.13%(+1.39)#72 | 1.46%(+2.06)#1,739 |
| 73. | Bothell East | 3.49% | 2.13%(+1.37)#73 | 1.46%(+2.04)#1,761 |
| 74. | Cottage Lake | 3.47% | 2.13%(+1.34)#74 | 1.46%(+2.01)#1,775 |
| 75. | Yarrow Point | 3.36% | 2.13%(+1.23)#75 | 1.46%(+1.90)#1,869 |
| 76. | Lynnwood | 3.35% | 2.13%(+1.23)#76 | 1.46%(+1.90)#1,874 |
| 77. | North Lynnwood | 3.34% | 2.13%(+1.21)#77 | 1.46%(+1.88)#1,892 |
| 78. | Vancouver | 3.33% | 2.13%(+1.21)#78 | 1.46%(+1.88)#1,893 |
| 79. | Kenmore | 3.33% | 2.13%(+1.21)#79 | 1.46%(+1.88)#1,898 |
| 80. | Lake Stickney | 3.31% | 2.13%(+1.18)#80 | 1.46%(+1.85)#1,907 |
| 81. | Kent | 3.29% | 2.13%(+1.17)#81 | 1.46%(+1.84)#1,913 |
| 82. | Shoreline | 3.26% | 2.13%(+1.13)#82 | 1.46%(+1.80)#1,952 |
| 83. | High Bridge | 3.24% | 2.13%(+1.11)#83 | 1.46%(+1.78)#1,968 |
| 84. | Newcastle | 3.22% | 2.13%(+1.09)#84 | 1.46%(+1.76)#1,988 |
| 85. | Amboy | 3.21% | 2.13%(+1.09)#85 | 1.46%(+1.76)#1,990 |
| 86. | Port Ludlow | 3.20% | 2.13%(+1.07)#86 | 1.46%(+1.74)#2,003 |
| 87. | Normandy Park | 3.15% | 2.13%(+1.02)#87 | 1.46%(+1.69)#2,048 |
| 88. | Deep River | 3.14% | 2.13%(+1.02)#88 | 1.46%(+1.69)#2,052 |
| 89. | Ruston | 3.07% | 2.13%(+0.945)#89 | 1.46%(+1.62)#2,126 |
| 90. | Carlsborg | 3.00% | 2.13%(+0.878)#90 | 1.46%(+1.55)#2,190 |
| 91. | Marrowstone | 2.95% | 2.13%(+0.822)#91 | 1.46%(+1.49)#2,244 |
| 92. | Lake Bosworth | 2.93% | 2.13%(+0.801)#92 | 1.46%(+1.47)#2,262 |
| 93. | Cathcart | 2.90% | 2.13%(+0.772)#93 | 1.46%(+1.44)#2,298 |
| 94. | North Puyallup | 2.85% | 2.13%(+0.724)#94 | 1.46%(+1.39)#2,348 |
| 95. | Bothell | 2.82% | 2.13%(+0.697)#95 | 1.46%(+1.37)#2,378 |
| 96. | Peaceful Valley | 2.80% | 2.13%(+0.673)#96 | 1.46%(+1.34)#2,412 |
| 97. | Everett | 2.79% | 2.13%(+0.665)#97 | 1.46%(+1.34)#2,425 |
| 98. | Hunts Point | 2.79% | 2.13%(+0.660)#98 | 1.46%(+1.33)#2,435 |
| 99. | Anderson Island | 2.78% | 2.13%(+0.650)#99 | 1.46%(+1.32)#2,444 |
| 100. | Lake Mcmurray | 2.75% | 2.13%(+0.622)#100 | 1.46%(+1.29)#2,476 |
Common Questions
What are the Top 10 Cities with the Highest Percentage of Immigrants from Europe in Washington?
Top 10 Cities with the Highest Percentage of Immigrants from Europe in Washington are:
#1
12.55%
#2
11.73%
#3
10.17%
#4
9.57%
#5
7.76%
#6
7.49%
#7
7.45%
#8
7.34%
#9
6.98%
#10
6.94%
What city has the Highest Percentage of Immigrants from Europe in Washington?
Monroe North has the Highest Percentage of Immigrants from Europe in Washington with 12.55%.
What is the Percentage of Immigrants from Europe in the State of Washington?
Percentage of Immigrants from Europe in Washington is 2.13%.
What is the Percentage of Immigrants from Europe in the United States?
Percentage of Immigrants from Europe in the United States is 1.46%.