Grayland, WA Map & Demographics
Grayland Map
Grayland Overview
$50,777
PER CAPITA INCOME
$101,020
AVG FAMILY INCOME
$35,250
AVG HOUSEHOLD INCOME
0.55
INEQUALITY / GINI INDEX
575
TOTAL POPULATION
274
MALE POPULATION
301
FEMALE POPULATION
91.03
MALES / 100 FEMALES
109.85
FEMALES / 100 MALES
63.5
MEDIAN AGE
2.2
AVG FAMILY SIZE
1.4
AVG HOUSEHOLD SIZE
196
LABOR FORCE [ PEOPLE ]
36.4%
PERCENT IN LABOR FORCE
26.0%
UNEMPLOYMENT RATE
Grayland Zip Codes
Grayland Area Codes
Income in Grayland
Income Overview in Grayland
Per Capita Income in Grayland is $50,777, while median incomes of families and households are $101,020 and $35,250 respectively.
| Characteristic | Number | Measure |
| Per Capita Income | 575 | $50,777 |
| Median Family Income | 121 | $101,020 |
| Mean Family Income | 121 | $164,894 |
| Median Household Income | 401 | $35,250 |
| Mean Household Income | 401 | $73,936 |
| Income Deficit | 121 | $0 |
| Wage / Income Gap (%) | 575 | 0.00% |
| Wage / Income Gap ($) | 575 | 100.00¢ per $1 |
| Gini / Inequality Index | 575 | 0.55 |
Earnings by Sex in Grayland
| Sex | Number | Average Earnings |
| Male | 116 (52.0%) | $0 |
| Female | 107 (48.0%) | $0 |
| Total | 223 (100.0%) | $0 |
Earnings by Sex by Income Bracket in Grayland
The most common earnings brackets in Grayland are $2,500 to $4,999 for men (27 | 23.3%) and $15,000 to $17,499 for women (51 | 47.7%).
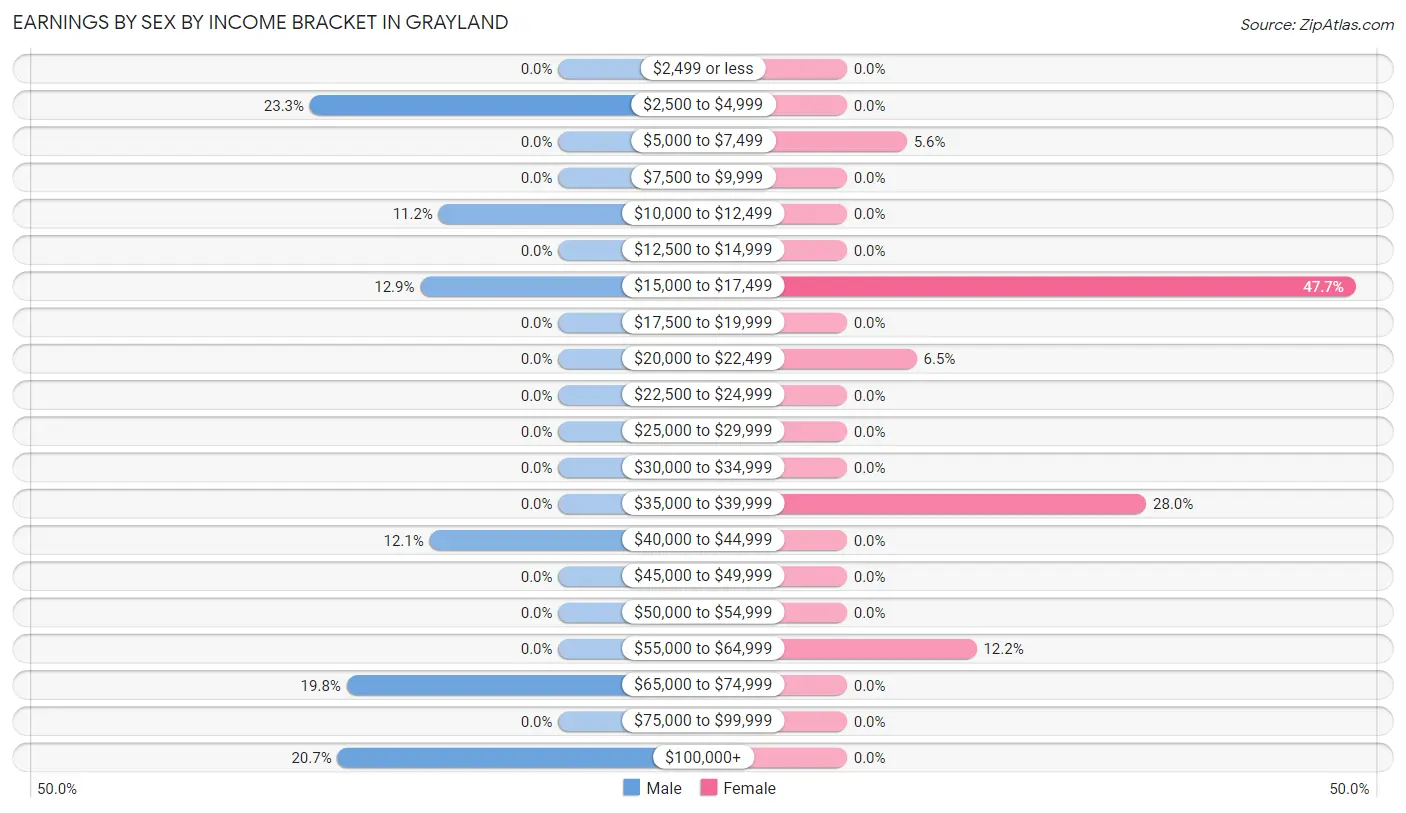
| Income | Male | Female |
| $2,499 or less | 0 (0.0%) | 0 (0.0%) |
| $2,500 to $4,999 | 27 (23.3%) | 0 (0.0%) |
| $5,000 to $7,499 | 0 (0.0%) | 6 (5.6%) |
| $7,500 to $9,999 | 0 (0.0%) | 0 (0.0%) |
| $10,000 to $12,499 | 13 (11.2%) | 0 (0.0%) |
| $12,500 to $14,999 | 0 (0.0%) | 0 (0.0%) |
| $15,000 to $17,499 | 15 (12.9%) | 51 (47.7%) |
| $17,500 to $19,999 | 0 (0.0%) | 0 (0.0%) |
| $20,000 to $22,499 | 0 (0.0%) | 7 (6.5%) |
| $22,500 to $24,999 | 0 (0.0%) | 0 (0.0%) |
| $25,000 to $29,999 | 0 (0.0%) | 0 (0.0%) |
| $30,000 to $34,999 | 0 (0.0%) | 0 (0.0%) |
| $35,000 to $39,999 | 0 (0.0%) | 30 (28.0%) |
| $40,000 to $44,999 | 14 (12.1%) | 0 (0.0%) |
| $45,000 to $49,999 | 0 (0.0%) | 0 (0.0%) |
| $50,000 to $54,999 | 0 (0.0%) | 0 (0.0%) |
| $55,000 to $64,999 | 0 (0.0%) | 13 (12.1%) |
| $65,000 to $74,999 | 23 (19.8%) | 0 (0.0%) |
| $75,000 to $99,999 | 0 (0.0%) | 0 (0.0%) |
| $100,000+ | 24 (20.7%) | 0 (0.0%) |
| Total | 116 (100.0%) | 107 (100.0%) |
Earnings by Sex by Educational Attainment in Grayland
| Educational Attainment | Male Income | Female Income |
| Less than High School | - | - |
| High School Diploma | - | - |
| College or Associate's Degree | - | - |
| Bachelor's Degree | - | - |
| Graduate Degree | - | - |
| Total | - | - |
Family Income in Grayland
Family Income Brackets in Grayland
According to the Grayland family income data, there are 48 families falling into the $100,000 to $149,999 income range, which is the most common income bracket and makes up 39.7% of all families.
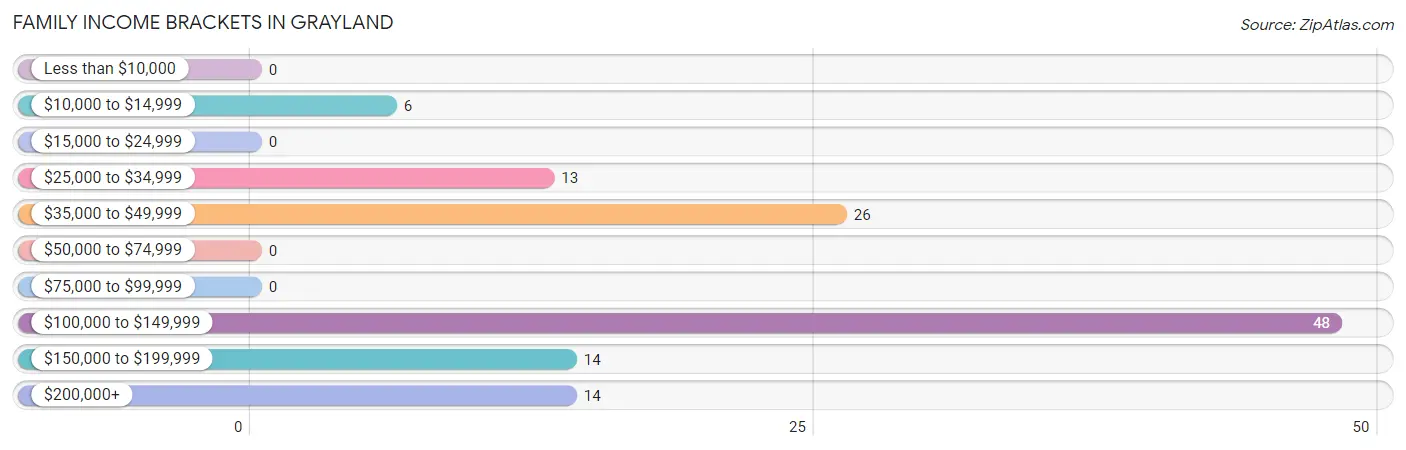
| Income Bracket | # Families | % Families |
| Less than $10,000 | 0 | 0.0% |
| $10,000 to $14,999 | 6 | 5.0% |
| $15,000 to $24,999 | 0 | 0.0% |
| $25,000 to $34,999 | 13 | 10.7% |
| $35,000 to $49,999 | 26 | 21.5% |
| $50,000 to $74,999 | 0 | 0.0% |
| $75,000 to $99,999 | 0 | 0.0% |
| $100,000 to $149,999 | 48 | 39.7% |
| $150,000 to $199,999 | 14 | 11.6% |
| $200,000+ | 14 | 11.6% |
Family Income by Famaliy Size in Grayland
| Income Bracket | # Families | Median Income |
| 2-Person Families | 97 (80.2%) | $0 |
| 3-Person Families | 10 (8.3%) | $0 |
| 4-Person Families | 14 (11.6%) | $0 |
| 5-Person Families | 0 (0.0%) | $0 |
| 6-Person Families | 0 (0.0%) | $0 |
| 7+ Person Families | 0 (0.0%) | $0 |
| Total | 121 (100.0%) | $101,020 |
Family Income by Number of Earners in Grayland
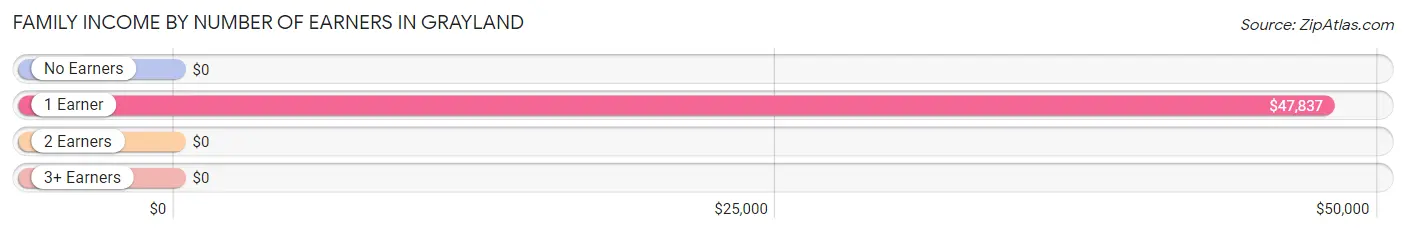
| Number of Earners | # Families | Median Income |
| No Earners | 52 (43.0%) | $0 |
| 1 Earner | 45 (37.2%) | $47,837 |
| 2 Earners | 24 (19.8%) | $0 |
| 3+ Earners | 0 (0.0%) | $0 |
| Total | 121 (100.0%) | $101,020 |
Household Income in Grayland
Household Income Brackets in Grayland
With 103 households falling in the category, the $25,000 to $34,999 income range is the most frequent in Grayland, accounting for 25.7% of all households.
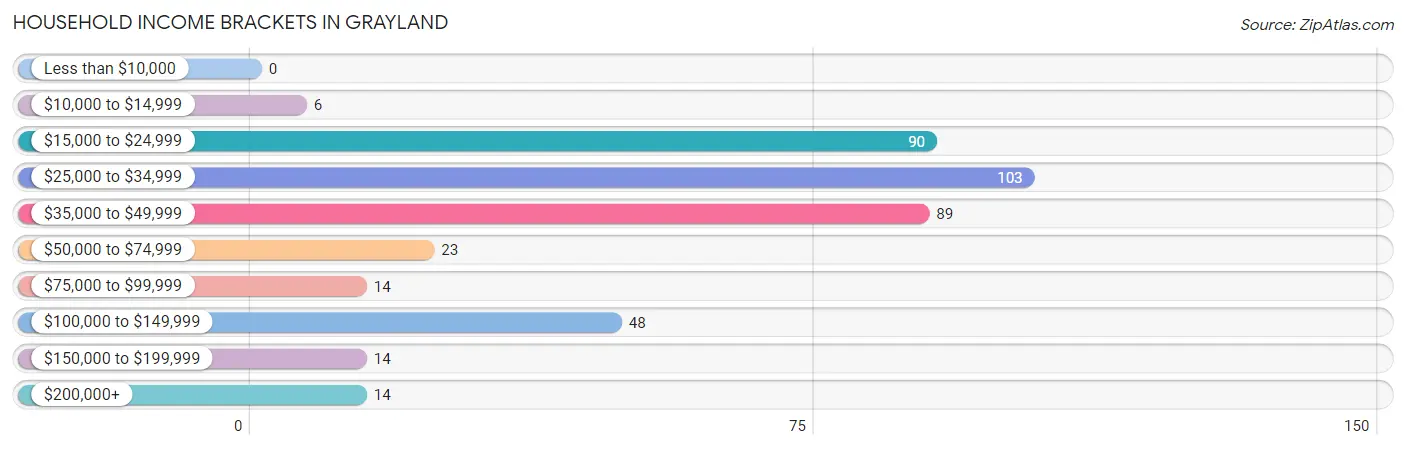
| Income Bracket | # Households | % Households |
| Less than $10,000 | 0 | 0.0% |
| $10,000 to $14,999 | 6 | 1.5% |
| $15,000 to $24,999 | 90 | 22.4% |
| $25,000 to $34,999 | 103 | 25.7% |
| $35,000 to $49,999 | 89 | 22.2% |
| $50,000 to $74,999 | 23 | 5.7% |
| $75,000 to $99,999 | 14 | 3.5% |
| $100,000 to $149,999 | 48 | 12.0% |
| $150,000 to $199,999 | 14 | 3.5% |
| $200,000+ | 14 | 3.5% |
Household Income by Householder Age in Grayland
The median household income in Grayland is $35,250, with the highest median household income of $25,128 found in the 65+ years age bracket for the primary householder. A total of 184 households (45.9%) fall into this category.
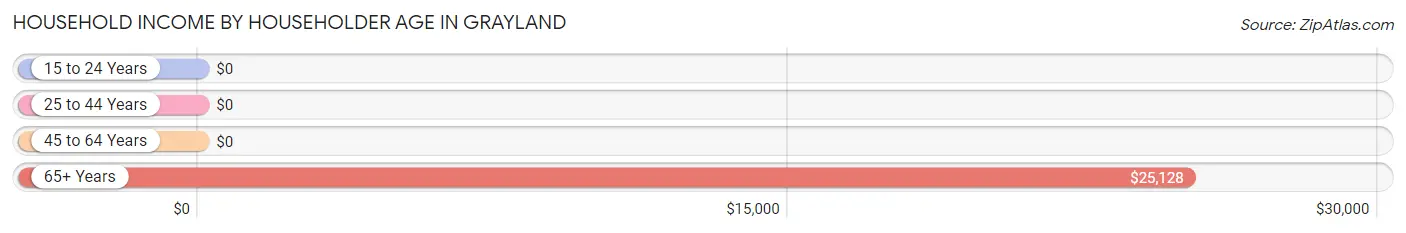
| Income Bracket | # Households | Median Income |
| 15 to 24 Years | 0 (0.0%) | $0 |
| 25 to 44 Years | 14 (3.5%) | $0 |
| 45 to 64 Years | 203 (50.6%) | $0 |
| 65+ Years | 184 (45.9%) | $25,128 |
| Total | 401 (100.0%) | $35,250 |
Poverty in Grayland
Income Below Poverty by Sex and Age in Grayland
With 6.9% poverty level for males and 2.0% for females among the residents of Grayland, 45 to 54 year old males and 45 to 54 year old females are the most vulnerable to poverty, with 13 males (28.3%) and 6 females (25.0%) in their respective age groups living below the poverty level.
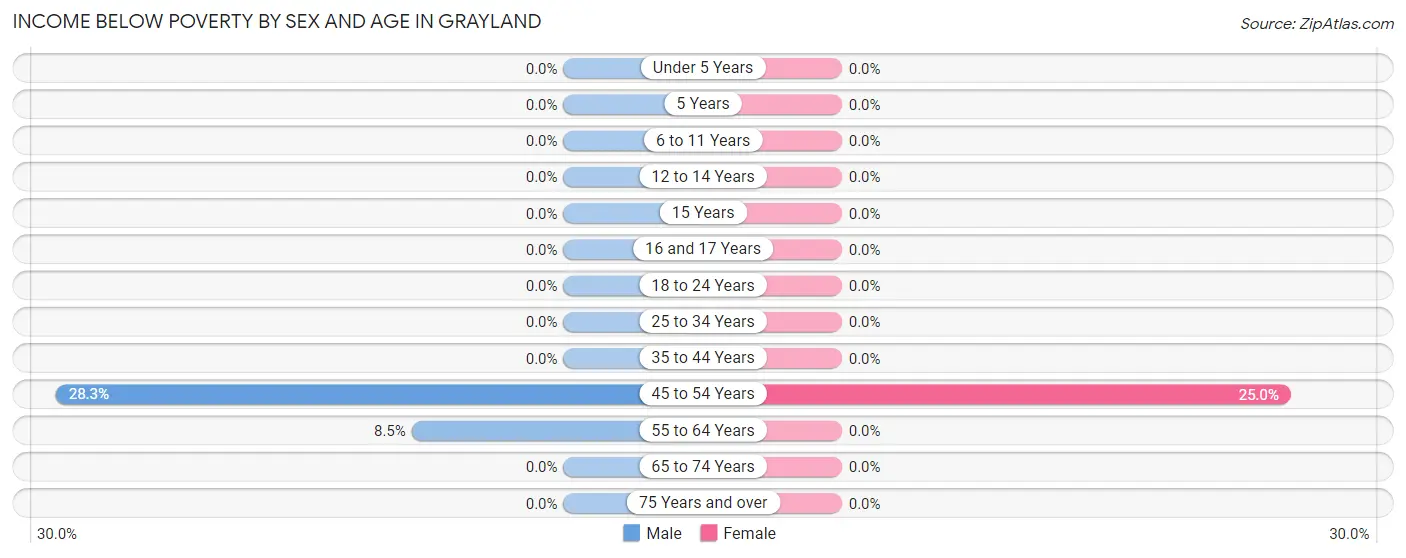
| Age Bracket | Male | Female |
| Under 5 Years | 0 (0.0%) | 0 (0.0%) |
| 5 Years | 0 (0.0%) | 0 (0.0%) |
| 6 to 11 Years | 0 (0.0%) | 0 (0.0%) |
| 12 to 14 Years | 0 (0.0%) | 0 (0.0%) |
| 15 Years | 0 (0.0%) | 0 (0.0%) |
| 16 and 17 Years | 0 (0.0%) | 0 (0.0%) |
| 18 to 24 Years | 0 (0.0%) | 0 (0.0%) |
| 25 to 34 Years | 0 (0.0%) | 0 (0.0%) |
| 35 to 44 Years | 0 (0.0%) | 0 (0.0%) |
| 45 to 54 Years | 13 (28.3%) | 6 (25.0%) |
| 55 to 64 Years | 6 (8.5%) | 0 (0.0%) |
| 65 to 74 Years | 0 (0.0%) | 0 (0.0%) |
| 75 Years and over | 0 (0.0%) | 0 (0.0%) |
| Total | 19 (6.9%) | 6 (2.0%) |
Income Above Poverty by Sex and Age in Grayland
According to the poverty statistics in Grayland, males aged under 5 years and females aged 12 to 14 years are the age groups that are most secure financially, with 100.0% of males and 100.0% of females in these age groups living above the poverty line.
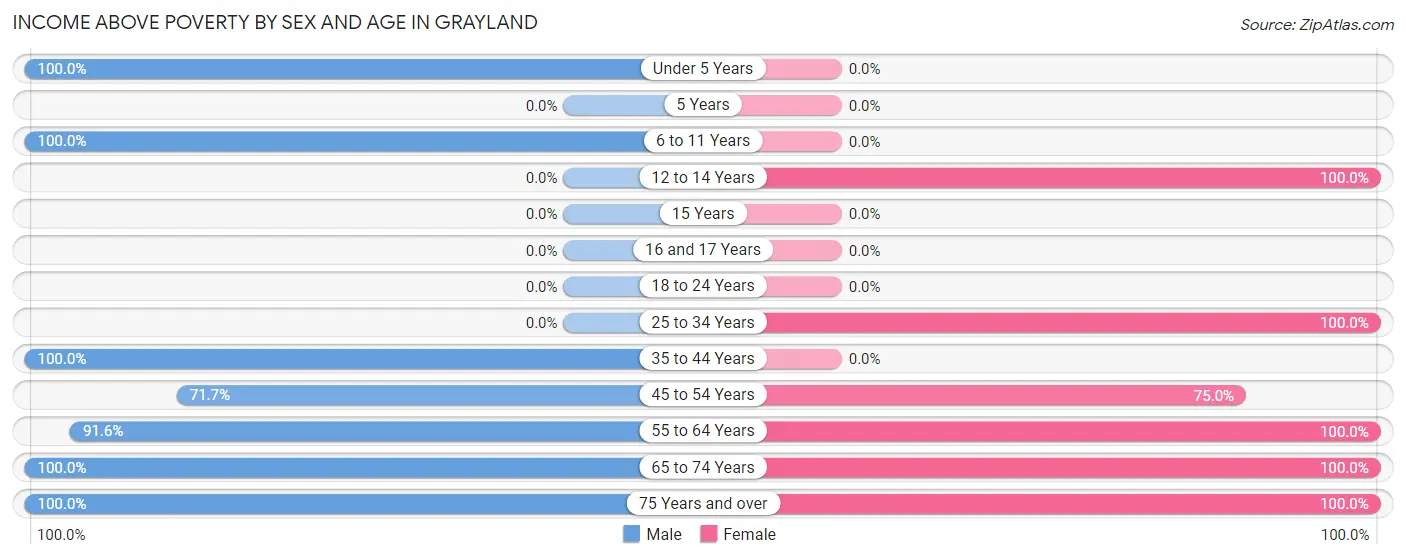
| Age Bracket | Male | Female |
| Under 5 Years | 16 (100.0%) | 0 (0.0%) |
| 5 Years | 0 (0.0%) | 0 (0.0%) |
| 6 to 11 Years | 14 (100.0%) | 0 (0.0%) |
| 12 to 14 Years | 0 (0.0%) | 7 (100.0%) |
| 15 Years | 0 (0.0%) | 0 (0.0%) |
| 16 and 17 Years | 0 (0.0%) | 0 (0.0%) |
| 18 to 24 Years | 0 (0.0%) | 0 (0.0%) |
| 25 to 34 Years | 0 (0.0%) | 13 (100.0%) |
| 35 to 44 Years | 14 (100.0%) | 0 (0.0%) |
| 45 to 54 Years | 33 (71.7%) | 18 (75.0%) |
| 55 to 64 Years | 65 (91.5%) | 147 (100.0%) |
| 65 to 74 Years | 98 (100.0%) | 77 (100.0%) |
| 75 Years and over | 15 (100.0%) | 33 (100.0%) |
| Total | 255 (93.1%) | 295 (98.0%) |
Income Below Poverty Among Married-Couple Families in Grayland
The poverty statistics for married-couple families in Grayland show that 5.0% or 6 of the total 121 families live below the poverty line. Families with no children have the highest poverty rate of 6.2%, comprising of 6 families. On the other hand, families with 1 or 2 children have the lowest poverty rate of 0.0%, which includes 0 families.
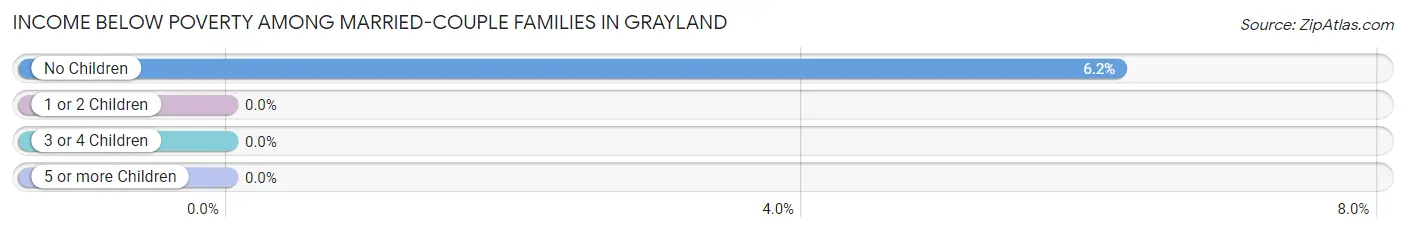
| Children | Above Poverty | Below Poverty |
| No Children | 91 (93.8%) | 6 (6.2%) |
| 1 or 2 Children | 24 (100.0%) | 0 (0.0%) |
| 3 or 4 Children | 0 (0.0%) | 0 (0.0%) |
| 5 or more Children | 0 (0.0%) | 0 (0.0%) |
| Total | 115 (95.0%) | 6 (5.0%) |
Income Below Poverty Among Single-Parent Households in Grayland
| Children | Single Father | Single Mother |
| No Children | 0 (0.0%) | 0 (0.0%) |
| 1 or 2 Children | 0 (0.0%) | 0 (0.0%) |
| 3 or 4 Children | 0 (0.0%) | 0 (0.0%) |
| 5 or more Children | 0 (0.0%) | 0 (0.0%) |
| Total | 0 (0.0%) | 0 (0.0%) |
Income Below Poverty Among Married-Couple vs Single-Parent Households in Grayland
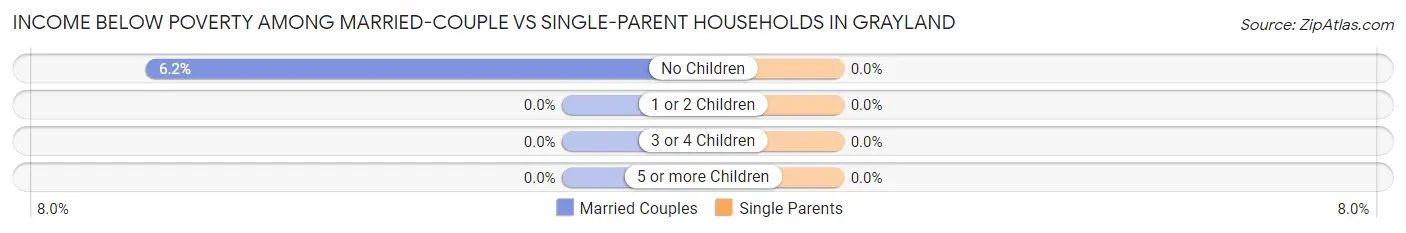
| Children | Married-Couple Families | Single-Parent Households |
| No Children | 6 (6.2%) | 0 (0.0%) |
| 1 or 2 Children | 0 (0.0%) | 0 (0.0%) |
| 3 or 4 Children | 0 (0.0%) | 0 (0.0%) |
| 5 or more Children | 0 (0.0%) | 0 (0.0%) |
| Total | 6 (5.0%) | 0 (0.0%) |
Race in Grayland
The most populous races in Grayland are White / Caucasian (505 | 87.8%), Two or more Races (57 | 9.9%), and Black / African American (13 | 2.3%).
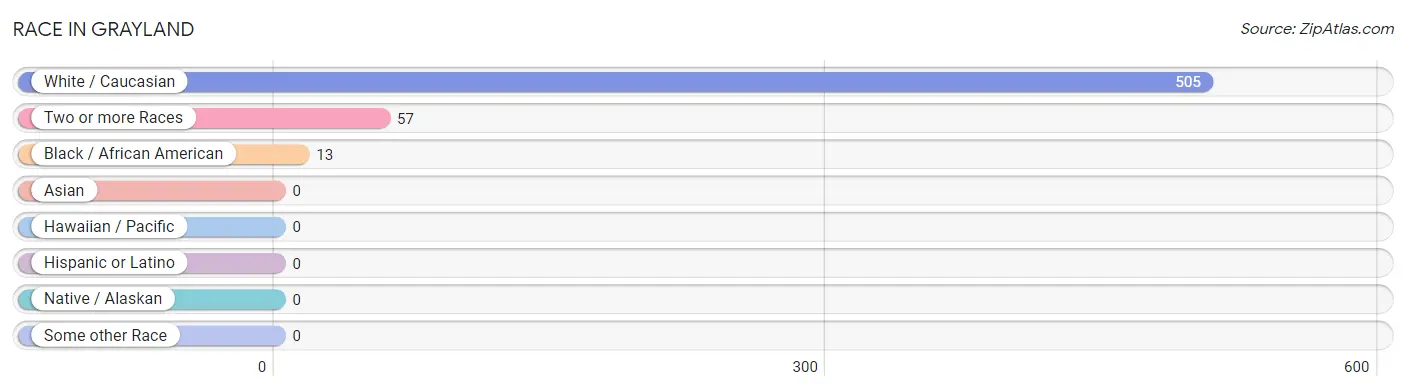
| Race | # Population | % Population |
| Asian | 0 | 0.0% |
| Black / African American | 13 | 2.3% |
| Hawaiian / Pacific | 0 | 0.0% |
| Hispanic or Latino | 0 | 0.0% |
| Native / Alaskan | 0 | 0.0% |
| White / Caucasian | 505 | 87.8% |
| Two or more Races | 57 | 9.9% |
| Some other Race | 0 | 0.0% |
| Total | 575 | 100.0% |
Ancestry in Grayland
The most populous ancestries reported in Grayland are German (165 | 28.7%), Irish (91 | 15.8%), English (77 | 13.4%), Dutch (39 | 6.8%), and Canadian (33 | 5.7%), together accounting for 70.4% of all Grayland residents.
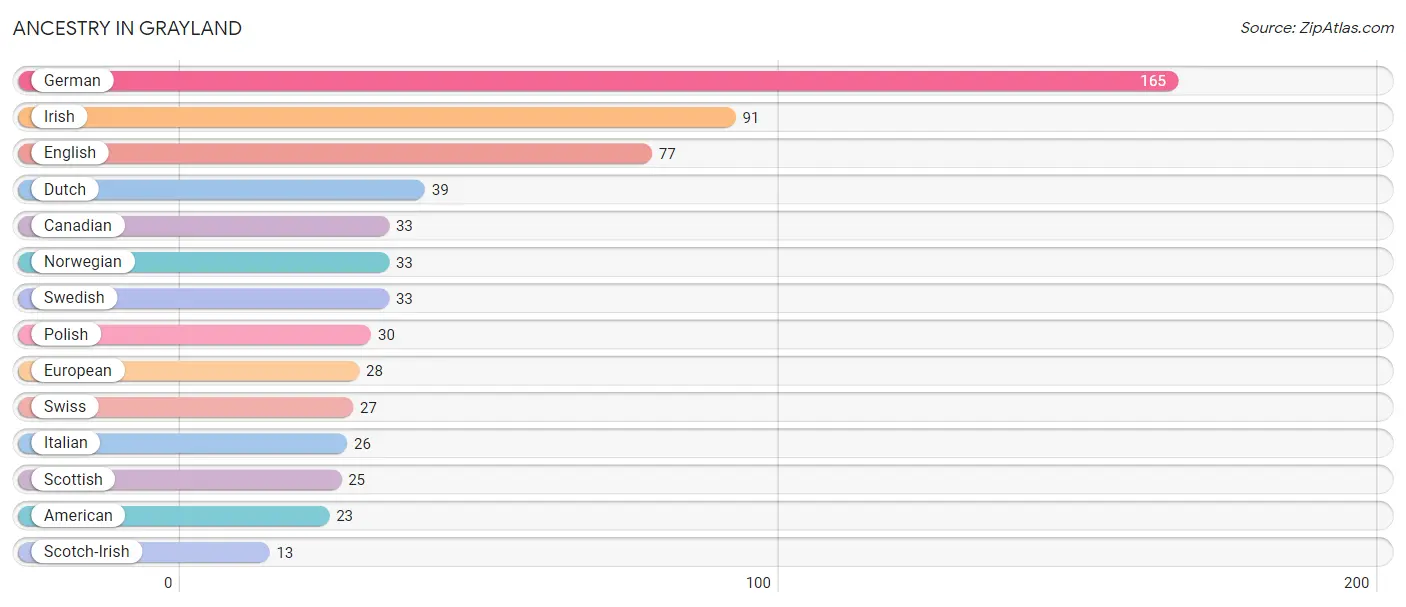
| Ancestry | # Population | % Population |
| American | 23 | 4.0% |
| Canadian | 33 | 5.7% |
| Dutch | 39 | 6.8% |
| English | 77 | 13.4% |
| European | 28 | 4.9% |
| German | 165 | 28.7% |
| Irish | 91 | 15.8% |
| Italian | 26 | 4.5% |
| Norwegian | 33 | 5.7% |
| Polish | 30 | 5.2% |
| Scotch-Irish | 13 | 2.3% |
| Scottish | 25 | 4.3% |
| Swedish | 33 | 5.7% |
| Swiss | 27 | 4.7% | View All 14 Rows |
Immigrants in Grayland

| Immigration Origin | # Population | % Population | View All 0 Rows |
Sex and Age in Grayland
Sex and Age in Grayland
The most populous age groups in Grayland are 65 to 69 Years (55 | 20.1%) for men and 60 to 64 Years (128 | 42.5%) for women.
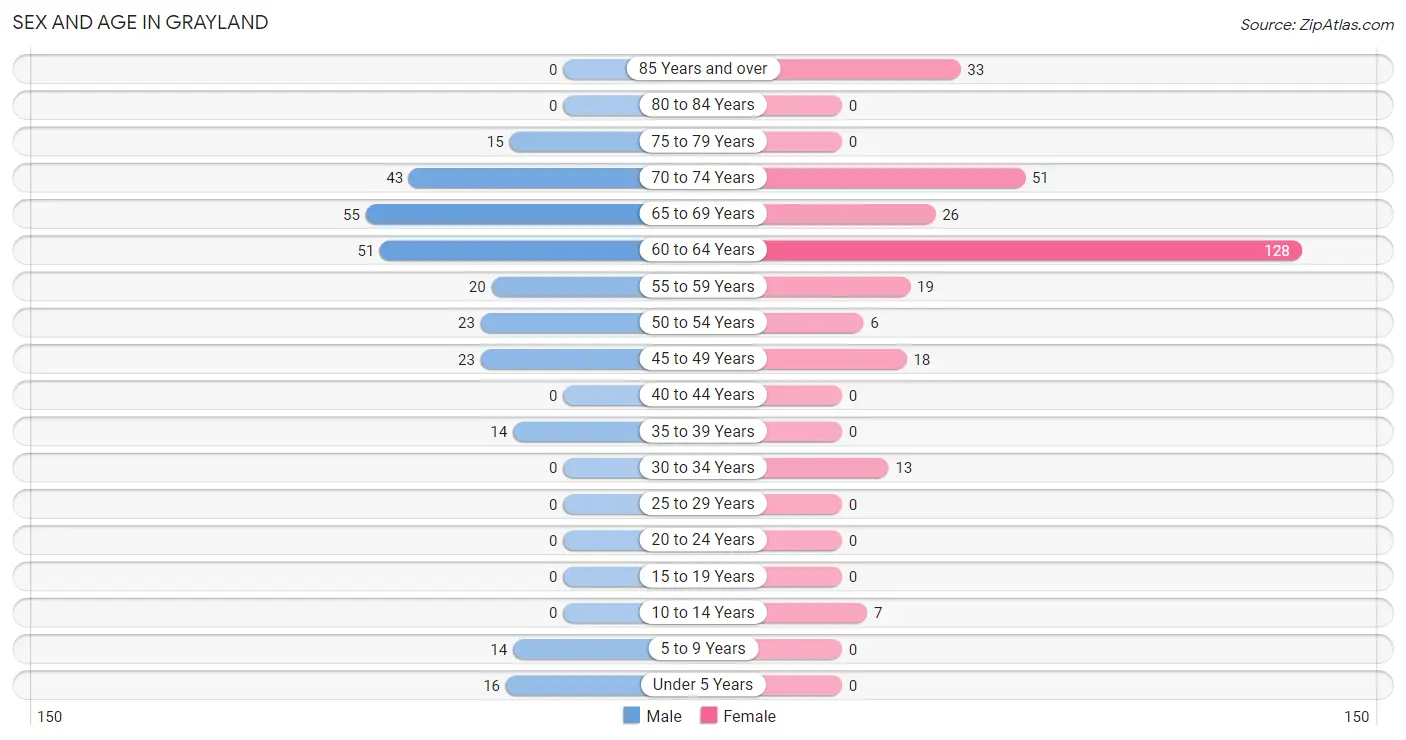
| Age Bracket | Male | Female |
| Under 5 Years | 16 (5.8%) | 0 (0.0%) |
| 5 to 9 Years | 14 (5.1%) | 0 (0.0%) |
| 10 to 14 Years | 0 (0.0%) | 7 (2.3%) |
| 15 to 19 Years | 0 (0.0%) | 0 (0.0%) |
| 20 to 24 Years | 0 (0.0%) | 0 (0.0%) |
| 25 to 29 Years | 0 (0.0%) | 0 (0.0%) |
| 30 to 34 Years | 0 (0.0%) | 13 (4.3%) |
| 35 to 39 Years | 14 (5.1%) | 0 (0.0%) |
| 40 to 44 Years | 0 (0.0%) | 0 (0.0%) |
| 45 to 49 Years | 23 (8.4%) | 18 (6.0%) |
| 50 to 54 Years | 23 (8.4%) | 6 (2.0%) |
| 55 to 59 Years | 20 (7.3%) | 19 (6.3%) |
| 60 to 64 Years | 51 (18.6%) | 128 (42.5%) |
| 65 to 69 Years | 55 (20.1%) | 26 (8.6%) |
| 70 to 74 Years | 43 (15.7%) | 51 (16.9%) |
| 75 to 79 Years | 15 (5.5%) | 0 (0.0%) |
| 80 to 84 Years | 0 (0.0%) | 0 (0.0%) |
| 85 Years and over | 0 (0.0%) | 33 (11.0%) |
| Total | 274 (100.0%) | 301 (100.0%) |
Families and Households in Grayland
Median Family Size in Grayland
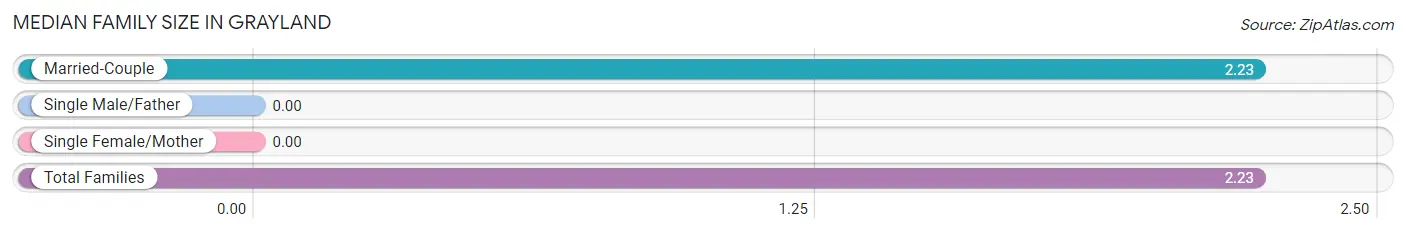
| Family Type | # Families | Family Size |
| Married-Couple | 121 (100.0%) | 2.23 |
| Single Male/Father | 0 (0.0%) | - |
| Single Female/Mother | 0 (0.0%) | - |
| Total Families | 121 (100.0%) | 2.23 |
Median Household Size in Grayland
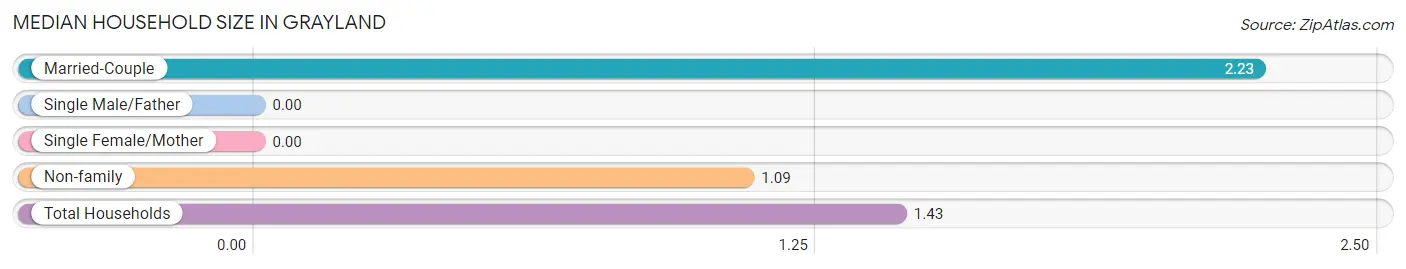
| Household Type | # Households | Household Size |
| Married-Couple | 121 (30.2%) | 2.23 |
| Single Male/Father | 0 (0.0%) | - |
| Single Female/Mother | 0 (0.0%) | - |
| Non-family | 280 (69.8%) | 1.09 |
| Total Households | 401 (100.0%) | 1.43 |
Household Size by Marriage Status in Grayland
Out of a total of 401 households in Grayland, 121 (30.2%) are family households, while 280 (69.8%) are nonfamily households. The most numerous type of family households are 2-person households, comprising 97, and the most common type of nonfamily households are 1-person households, comprising 248.
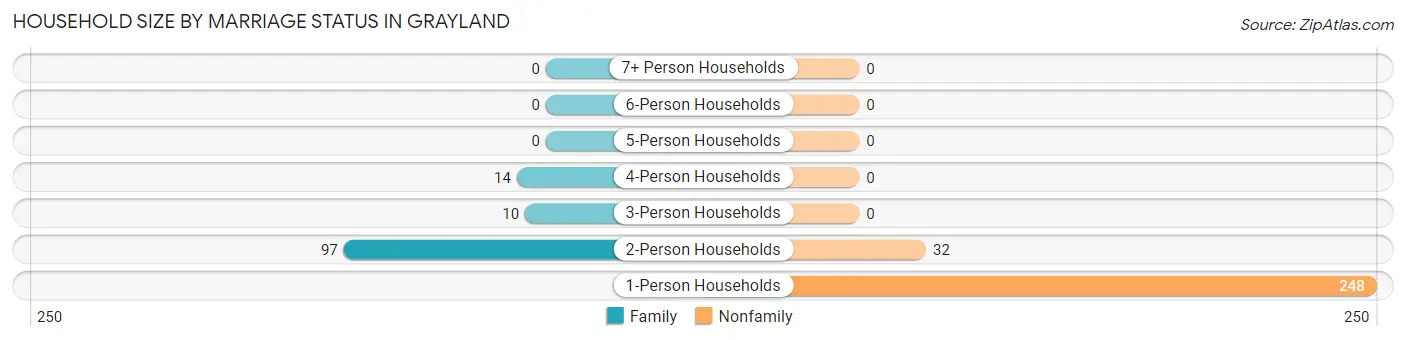
| Household Size | Family Households | Nonfamily Households |
| 1-Person Households | - | 248 (61.9%) |
| 2-Person Households | 97 (24.2%) | 32 (8.0%) |
| 3-Person Households | 10 (2.5%) | 0 (0.0%) |
| 4-Person Households | 14 (3.5%) | 0 (0.0%) |
| 5-Person Households | 0 (0.0%) | 0 (0.0%) |
| 6-Person Households | 0 (0.0%) | 0 (0.0%) |
| 7+ Person Households | 0 (0.0%) | 0 (0.0%) |
| Total | 121 (30.2%) | 280 (69.8%) |
Female Fertility in Grayland
Fertility by Age in Grayland
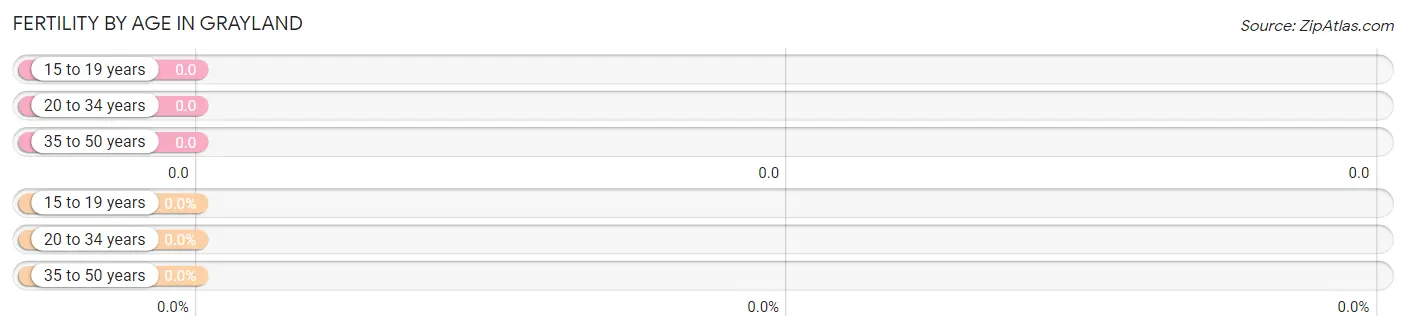
| Age Bracket | Women with Births | Births / 1,000 Women |
| 15 to 19 years | 0 (0.0%) | 0.0 |
| 20 to 34 years | 0 (0.0%) | 0.0 |
| 35 to 50 years | 0 (0.0%) | 0.0 |
| Total | 0 (0.0%) | 0.0 |
Fertility by Age by Marriage Status in Grayland
| Age Bracket | Married | Unmarried |
| 15 to 19 years | 0 (0.0%) | 0 (0.0%) |
| 20 to 34 years | 0 (0.0%) | 0 (0.0%) |
| 35 to 50 years | 0 (0.0%) | 0 (0.0%) |
| Total | 0 (0.0%) | 0 (0.0%) |
Fertility by Education in Grayland
| Educational Attainment | Women with Births | Births / 1,000 Women |
| Less than High School | 0 (0.0%) | 0.0 |
| High School Diploma | 0 (0.0%) | 0.0 |
| College or Associate's Degree | 0 (0.0%) | 0.0 |
| Bachelor's Degree | 0 (0.0%) | 0.0 |
| Graduate Degree | 0 (0.0%) | 0.0 |
| Total | 0 (0.0%) | 0.0 |
Fertility by Education by Marriage Status in Grayland
| Educational Attainment | Married | Unmarried |
| Less than High School | 0 (0.0%) | 0 (0.0%) |
| High School Diploma | 0 (0.0%) | 0 (0.0%) |
| College or Associate's Degree | 0 (0.0%) | 0 (0.0%) |
| Bachelor's Degree | 0 (0.0%) | 0 (0.0%) |
| Graduate Degree | 0 (0.0%) | 0 (0.0%) |
| Total | 0 (0.0%) | 0 (0.0%) |
Employment Characteristics in Grayland
Employment by Class of Employer in Grayland
Among the 145 employed individuals in Grayland, private company employees (37 | 25.5%), local government employees (31 | 21.4%), and self-employed (incorporated) (28 | 19.3%) make up the most common classes of employment.
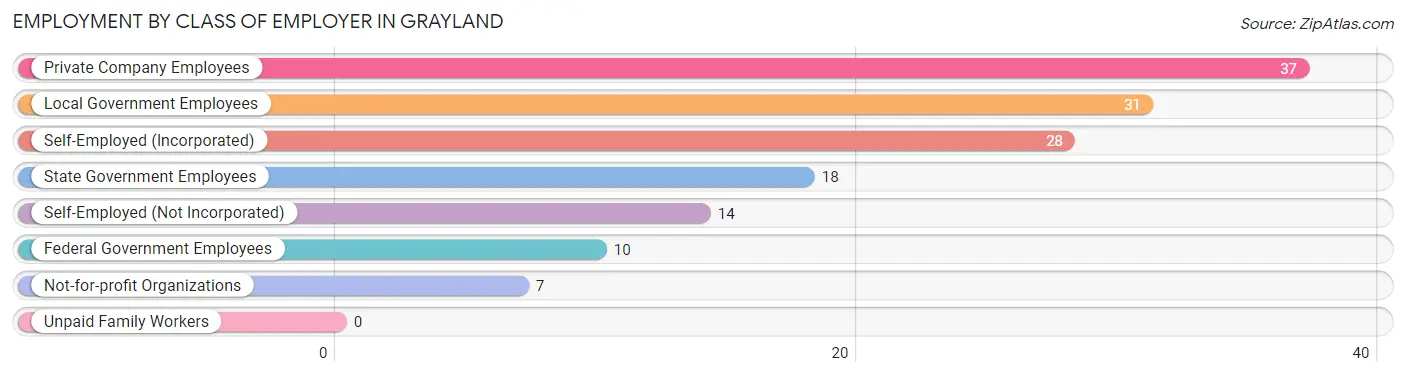
| Employer Class | # Employees | % Employees |
| Private Company Employees | 37 | 25.5% |
| Self-Employed (Incorporated) | 28 | 19.3% |
| Self-Employed (Not Incorporated) | 14 | 9.7% |
| Not-for-profit Organizations | 7 | 4.8% |
| Local Government Employees | 31 | 21.4% |
| State Government Employees | 18 | 12.4% |
| Federal Government Employees | 10 | 6.9% |
| Unpaid Family Workers | 0 | 0.0% |
| Total | 145 | 100.0% |
Employment Status by Age in Grayland
According to the labor force statistics for Grayland, out of the total population over 16 years of age (538), 36.4% or 196 individuals are in the labor force, with 26.0% or 51 of them unemployed. The age group with the highest labor force participation rate is 30 to 34 years, with 100.0% or 13 individuals in the labor force. Within the labor force, the 60 to 64 years age range has the highest percentage of unemployed individuals, with 79.7% or 51 of them being unemployed.
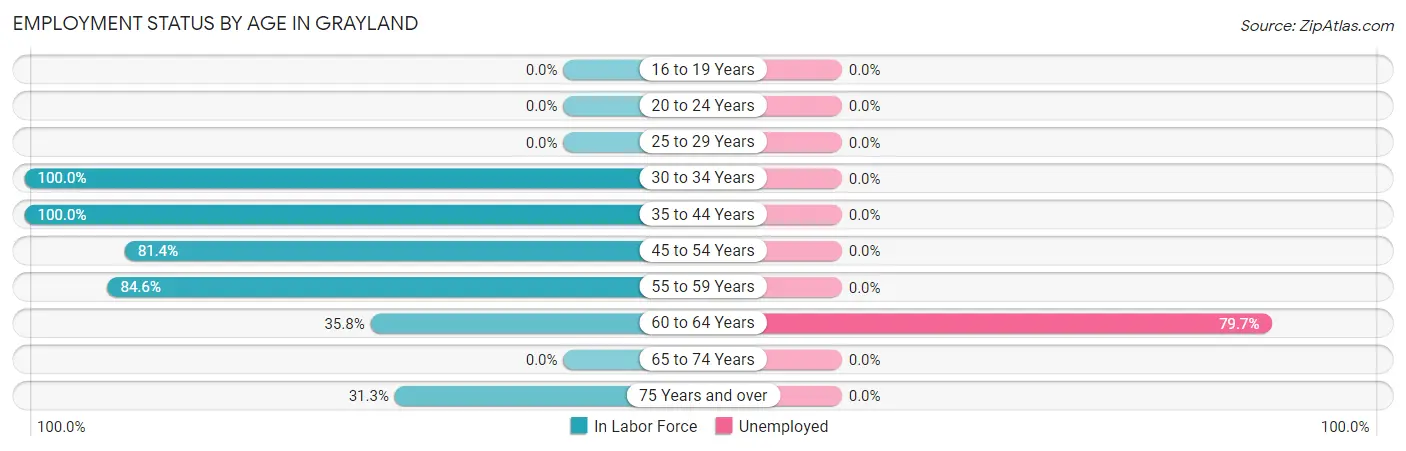
| Age Bracket | In Labor Force | Unemployed |
| 16 to 19 Years | 0 (0.0%) | 0 (0.0%) |
| 20 to 24 Years | 0 (0.0%) | 0 (0.0%) |
| 25 to 29 Years | 0 (0.0%) | 0 (0.0%) |
| 30 to 34 Years | 13 (100.0%) | 0 (0.0%) |
| 35 to 44 Years | 14 (100.0%) | 0 (0.0%) |
| 45 to 54 Years | 57 (81.4%) | 0 (0.0%) |
| 55 to 59 Years | 33 (84.6%) | 0 (0.0%) |
| 60 to 64 Years | 64 (35.8%) | 51 (79.7%) |
| 65 to 74 Years | 0 (0.0%) | 0 (0.0%) |
| 75 Years and over | 15 (31.3%) | 0 (0.0%) |
| Total | 196 (36.4%) | 51 (26.0%) |
Employment Status by Educational Attainment in Grayland
According to labor force statistics for Grayland, 57.5% of individuals (181) out of the total population between 25 and 64 years of age (315) are in the labor force, with 28.2% or 51 of them being unemployed. The group with the highest labor force participation rate are those with the educational attainment of high school diploma, with 100.0% or 76 individuals in the labor force. Within the labor force, individuals with high school diploma education have the highest percentage of unemployment, with 67.1% or 51 of them being unemployed.
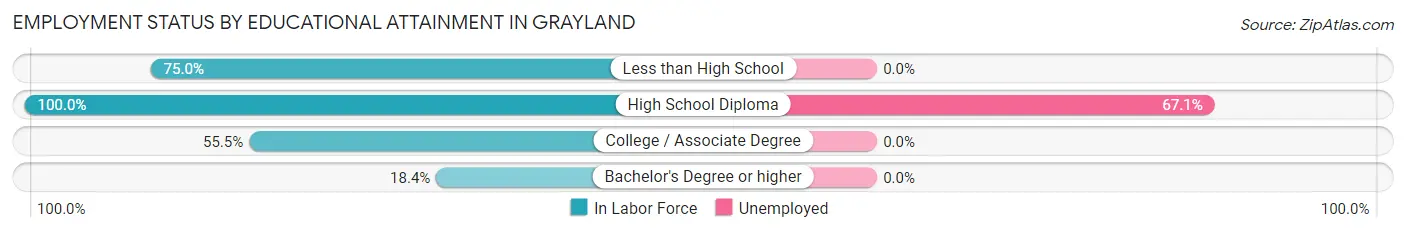
| Educational Attainment | In Labor Force | Unemployed |
| Less than High School | 18 (75.0%) | 0 (0.0%) |
| High School Diploma | 76 (100.0%) | 51 (67.1%) |
| College / Associate Degree | 71 (55.5%) | 0 (0.0%) |
| Bachelor's Degree or higher | 16 (18.4%) | 0 (0.0%) |
| Total | 181 (57.5%) | 89 (28.2%) |
Employment Occupations by Sex in Grayland
Management, Business, Science and Arts Occupations
The most common Management, Business, Science and Arts occupations in Grayland are Management (25 | 17.2%), Community & Social Service (13 | 9.0%), and Education Instruction & Library (13 | 9.0%).
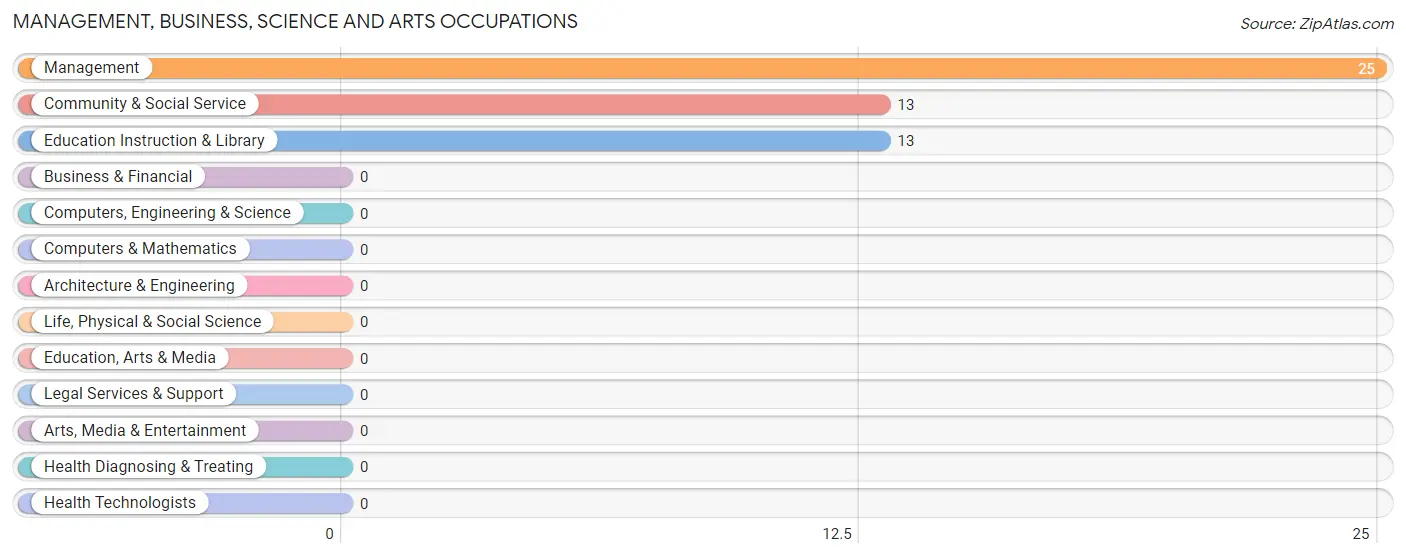
Management, Business, Science and Arts Occupations by Sex
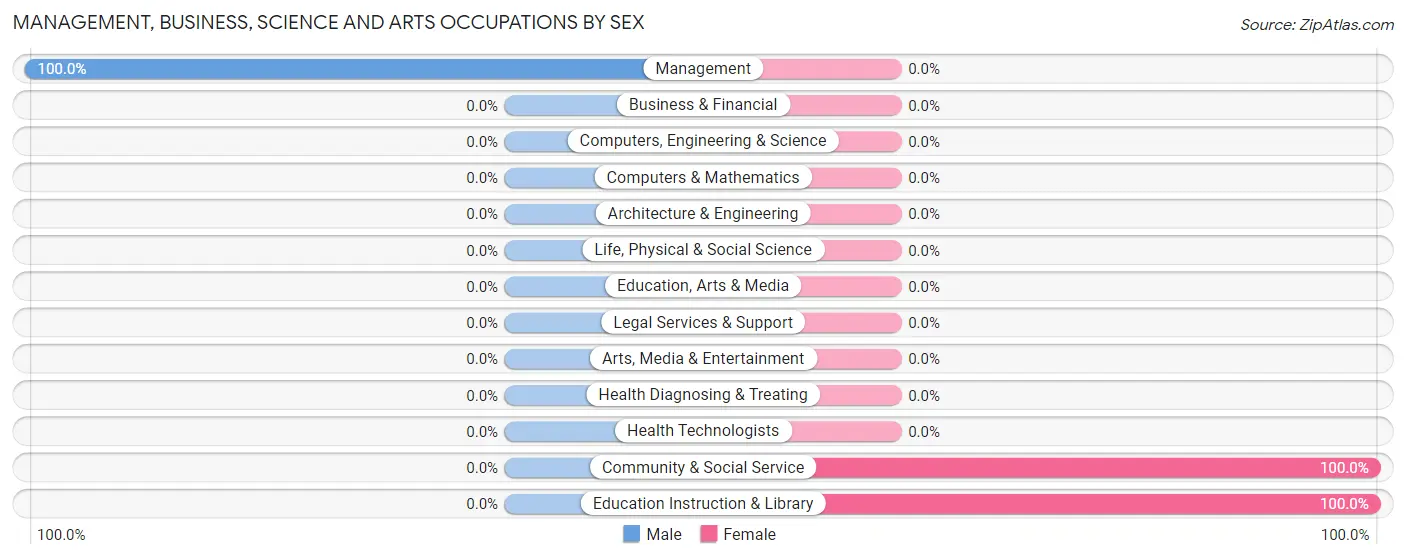
| Occupation | Male | Female |
| Management | 25 (100.0%) | 0 (0.0%) |
| Business & Financial | 0 (0.0%) | 0 (0.0%) |
| Computers, Engineering & Science | 0 (0.0%) | 0 (0.0%) |
| Computers & Mathematics | 0 (0.0%) | 0 (0.0%) |
| Architecture & Engineering | 0 (0.0%) | 0 (0.0%) |
| Life, Physical & Social Science | 0 (0.0%) | 0 (0.0%) |
| Community & Social Service | 0 (0.0%) | 13 (100.0%) |
| Education, Arts & Media | 0 (0.0%) | 0 (0.0%) |
| Legal Services & Support | 0 (0.0%) | 0 (0.0%) |
| Education Instruction & Library | 0 (0.0%) | 13 (100.0%) |
| Arts, Media & Entertainment | 0 (0.0%) | 0 (0.0%) |
| Health Diagnosing & Treating | 0 (0.0%) | 0 (0.0%) |
| Health Technologists | 0 (0.0%) | 0 (0.0%) |
| Total (Category) | 25 (65.8%) | 13 (34.2%) |
| Total (Overall) | 89 (61.4%) | 56 (38.6%) |
Services Occupations
The most common Services occupations in Grayland are Healthcare Support (18 | 12.4%), Food Preparation & Serving (14 | 9.7%), and Personal Care & Service (13 | 9.0%).
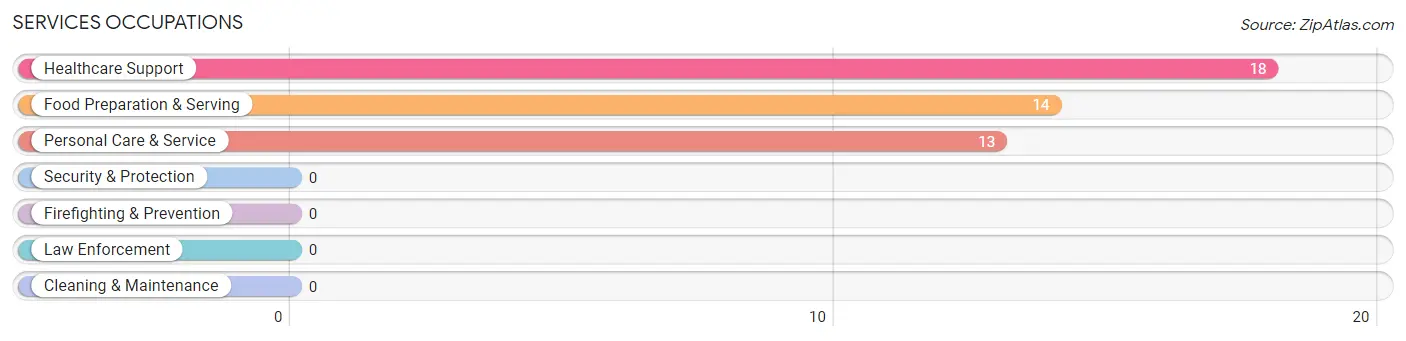
Services Occupations by Sex
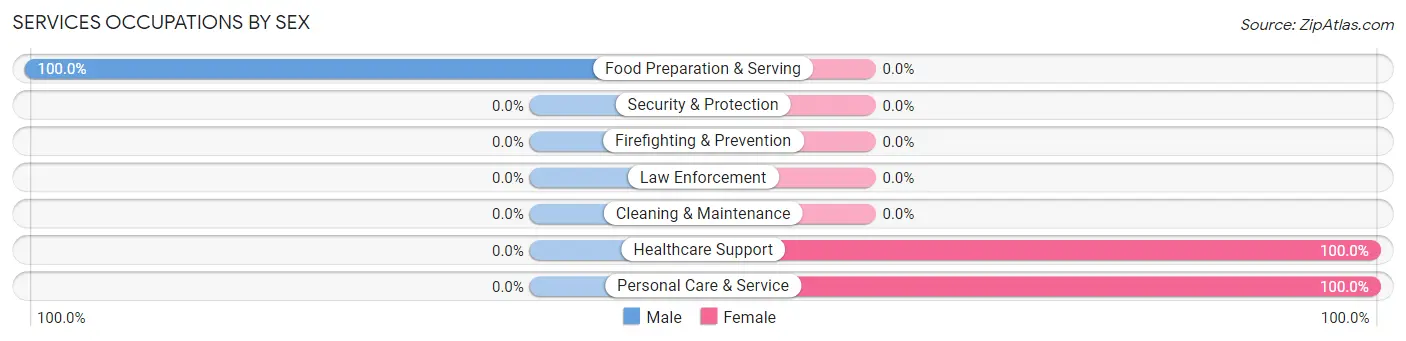
| Occupation | Male | Female |
| Healthcare Support | 0 (0.0%) | 18 (100.0%) |
| Security & Protection | 0 (0.0%) | 0 (0.0%) |
| Firefighting & Prevention | 0 (0.0%) | 0 (0.0%) |
| Law Enforcement | 0 (0.0%) | 0 (0.0%) |
| Food Preparation & Serving | 14 (100.0%) | 0 (0.0%) |
| Cleaning & Maintenance | 0 (0.0%) | 0 (0.0%) |
| Personal Care & Service | 0 (0.0%) | 13 (100.0%) |
| Total (Category) | 14 (31.1%) | 31 (68.9%) |
| Total (Overall) | 89 (61.4%) | 56 (38.6%) |
Sales and Office Occupations
The most common Sales and Office occupations in Grayland are , and Office & Administration (12 | 8.3%).
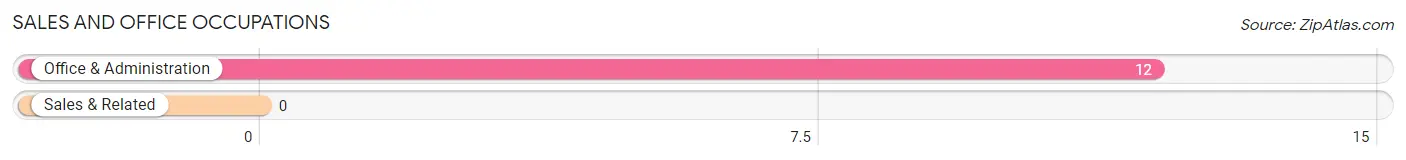
Sales and Office Occupations by Sex
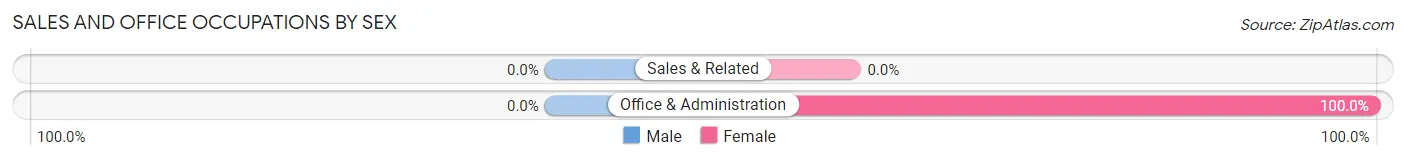
| Occupation | Male | Female |
| Sales & Related | 0 (0.0%) | 0 (0.0%) |
| Office & Administration | 0 (0.0%) | 12 (100.0%) |
| Total (Category) | 0 (0.0%) | 12 (100.0%) |
| Total (Overall) | 89 (61.4%) | 56 (38.6%) |
Natural Resources, Construction and Maintenance Occupations
The most common Natural Resources, Construction and Maintenance occupations in Grayland are Construction & Extraction (23 | 15.9%), and Farming, Fishing & Forestry (14 | 9.7%).
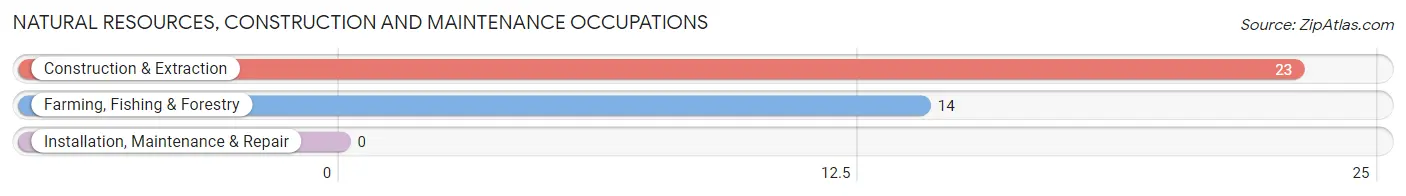
Natural Resources, Construction and Maintenance Occupations by Sex
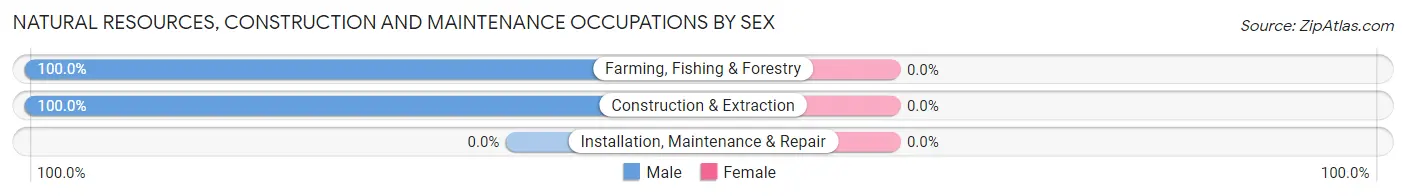
| Occupation | Male | Female |
| Farming, Fishing & Forestry | 14 (100.0%) | 0 (0.0%) |
| Construction & Extraction | 23 (100.0%) | 0 (0.0%) |
| Installation, Maintenance & Repair | 0 (0.0%) | 0 (0.0%) |
| Total (Category) | 37 (100.0%) | 0 (0.0%) |
| Total (Overall) | 89 (61.4%) | 56 (38.6%) |
Production, Transportation and Moving Occupations
The most common Production, Transportation and Moving occupations in Grayland are , and Transportation (13 | 9.0%).
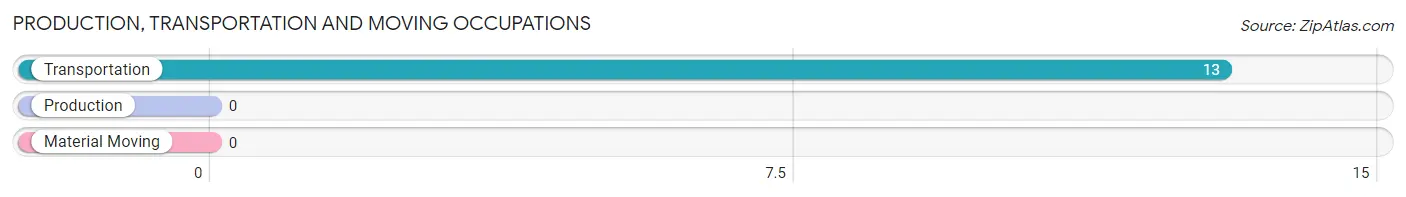
Production, Transportation and Moving Occupations by Sex
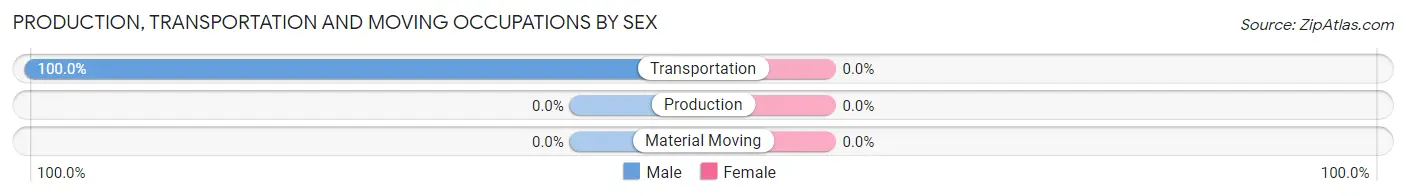
| Occupation | Male | Female |
| Production | 0 (0.0%) | 0 (0.0%) |
| Transportation | 13 (100.0%) | 0 (0.0%) |
| Material Moving | 0 (0.0%) | 0 (0.0%) |
| Total (Category) | 13 (100.0%) | 0 (0.0%) |
| Total (Overall) | 89 (61.4%) | 56 (38.6%) |
Employment Industries by Sex in Grayland
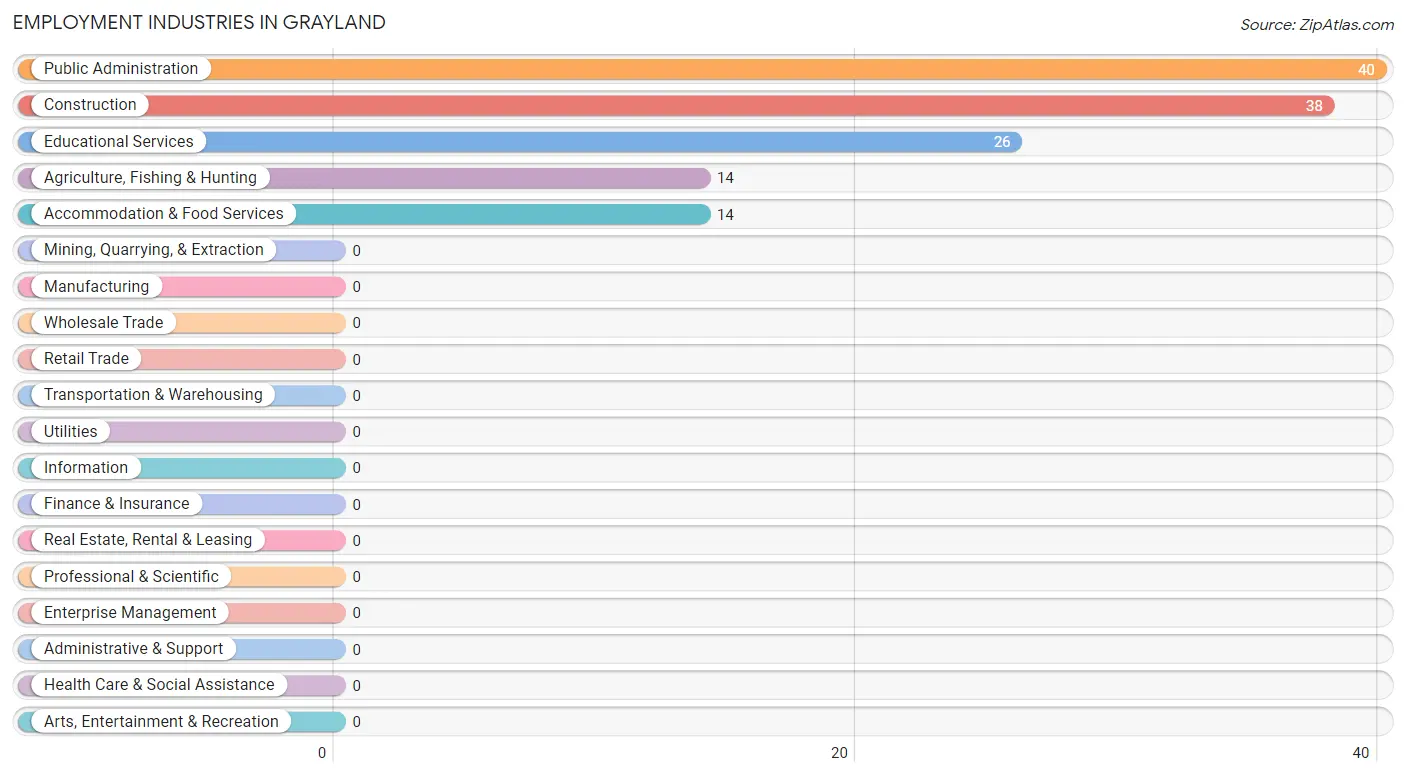
Employment Industries in Grayland
The major employment industries in Grayland include Public Administration (40 | 27.6%), Construction (38 | 26.2%), Educational Services (26 | 17.9%), Agriculture, Fishing & Hunting (14 | 9.7%), and Accommodation & Food Services (14 | 9.7%).
Employment Industries by Sex in Grayland
The Grayland industries that see more men than women are Agriculture, Fishing & Hunting (100.0%), Construction (100.0%), and Accommodation & Food Services (100.0%), whereas the industries that tend to have a higher number of women are Public Administration (75.0%), and Educational Services (50.0%).
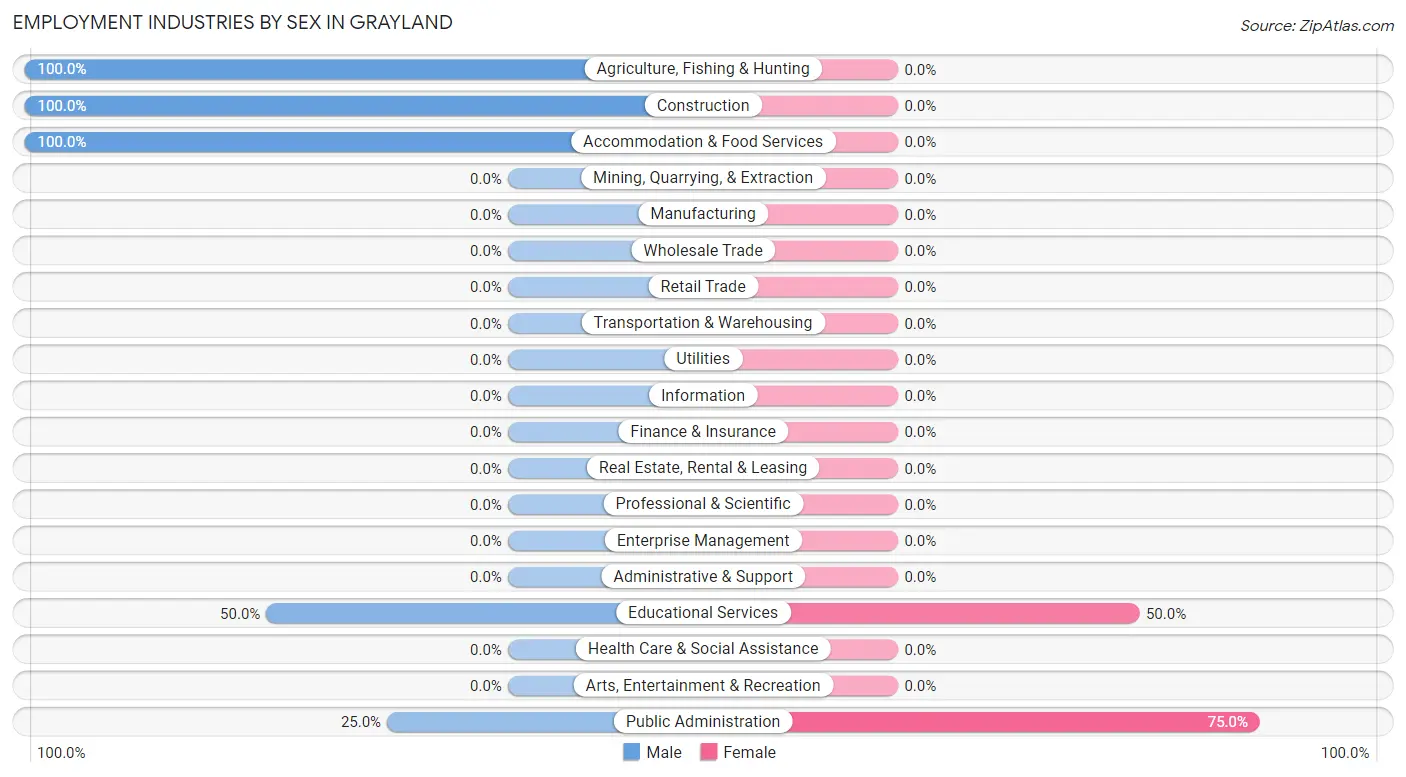
| Industry | Male | Female |
| Agriculture, Fishing & Hunting | 14 (100.0%) | 0 (0.0%) |
| Mining, Quarrying, & Extraction | 0 (0.0%) | 0 (0.0%) |
| Construction | 38 (100.0%) | 0 (0.0%) |
| Manufacturing | 0 (0.0%) | 0 (0.0%) |
| Wholesale Trade | 0 (0.0%) | 0 (0.0%) |
| Retail Trade | 0 (0.0%) | 0 (0.0%) |
| Transportation & Warehousing | 0 (0.0%) | 0 (0.0%) |
| Utilities | 0 (0.0%) | 0 (0.0%) |
| Information | 0 (0.0%) | 0 (0.0%) |
| Finance & Insurance | 0 (0.0%) | 0 (0.0%) |
| Real Estate, Rental & Leasing | 0 (0.0%) | 0 (0.0%) |
| Professional & Scientific | 0 (0.0%) | 0 (0.0%) |
| Enterprise Management | 0 (0.0%) | 0 (0.0%) |
| Administrative & Support | 0 (0.0%) | 0 (0.0%) |
| Educational Services | 13 (50.0%) | 13 (50.0%) |
| Health Care & Social Assistance | 0 (0.0%) | 0 (0.0%) |
| Arts, Entertainment & Recreation | 0 (0.0%) | 0 (0.0%) |
| Accommodation & Food Services | 14 (100.0%) | 0 (0.0%) |
| Public Administration | 10 (25.0%) | 30 (75.0%) |
| Total | 89 (61.4%) | 56 (38.6%) |
Education in Grayland
School Enrollment in Grayland
The most common levels of schooling among the 37 students in Grayland are nursery / preschool (16 | 43.2%), elementary school (14 | 37.8%), and middle school (7 | 18.9%).
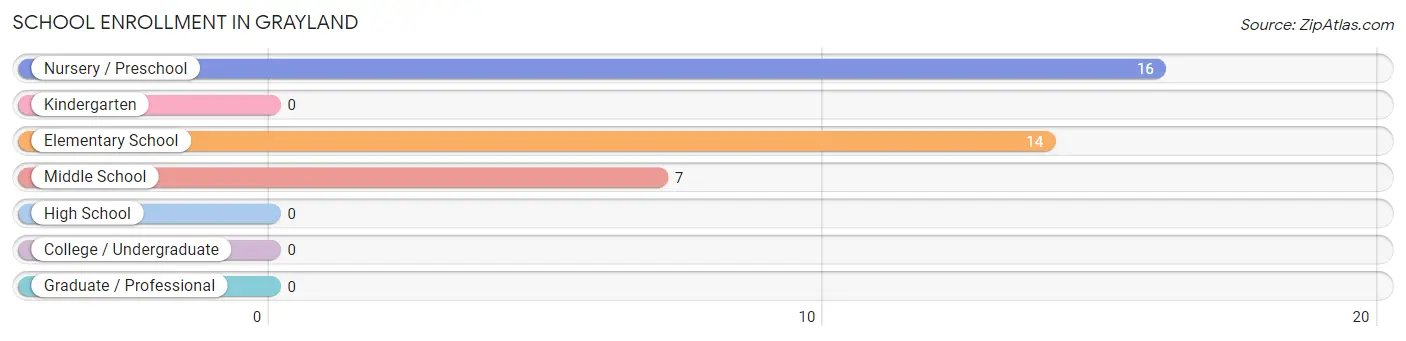
| School Level | # Students | % Students |
| Nursery / Preschool | 16 | 43.2% |
| Kindergarten | 0 | 0.0% |
| Elementary School | 14 | 37.8% |
| Middle School | 7 | 18.9% |
| High School | 0 | 0.0% |
| College / Undergraduate | 0 | 0.0% |
| Graduate / Professional | 0 | 0.0% |
| Total | 37 | 100.0% |
School Enrollment by Age by Funding Source in Grayland
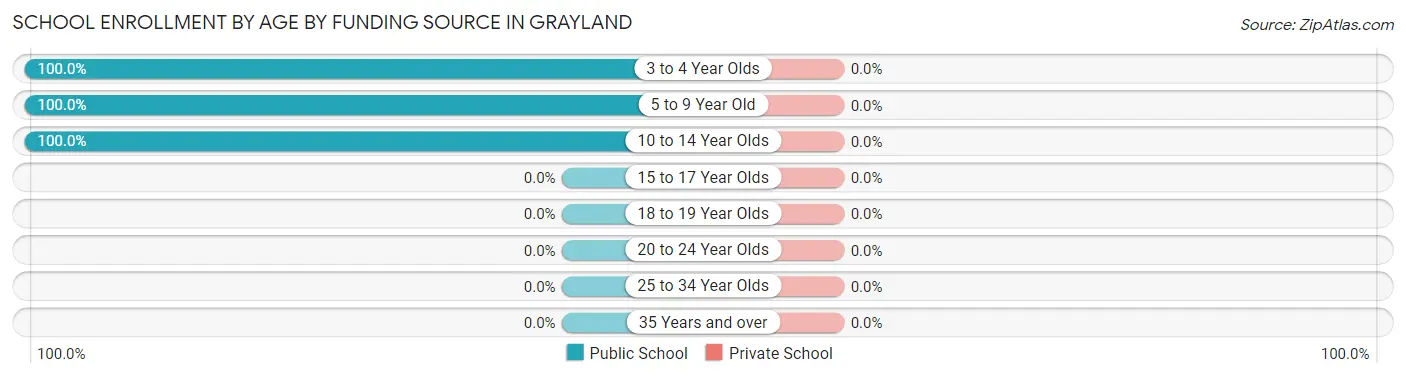
| Age Bracket | Public School | Private School |
| 3 to 4 Year Olds | 16 (100.0%) | 0 (0.0%) |
| 5 to 9 Year Old | 14 (100.0%) | 0 (0.0%) |
| 10 to 14 Year Olds | 7 (100.0%) | 0 (0.0%) |
| 15 to 17 Year Olds | 0 (0.0%) | 0 (0.0%) |
| 18 to 19 Year Olds | 0 (0.0%) | 0 (0.0%) |
| 20 to 24 Year Olds | 0 (0.0%) | 0 (0.0%) |
| 25 to 34 Year Olds | 0 (0.0%) | 0 (0.0%) |
| 35 Years and over | 0 (0.0%) | 0 (0.0%) |
| Total | 37 (100.0%) | 0 (0.0%) |
Educational Attainment by Field of Study in Grayland
Education (77 | 67.0%), social sciences (24 | 20.9%), and liberal arts & history (14 | 12.2%) are the most common fields of study among 115 individuals in Grayland who have obtained a bachelor's degree or higher.
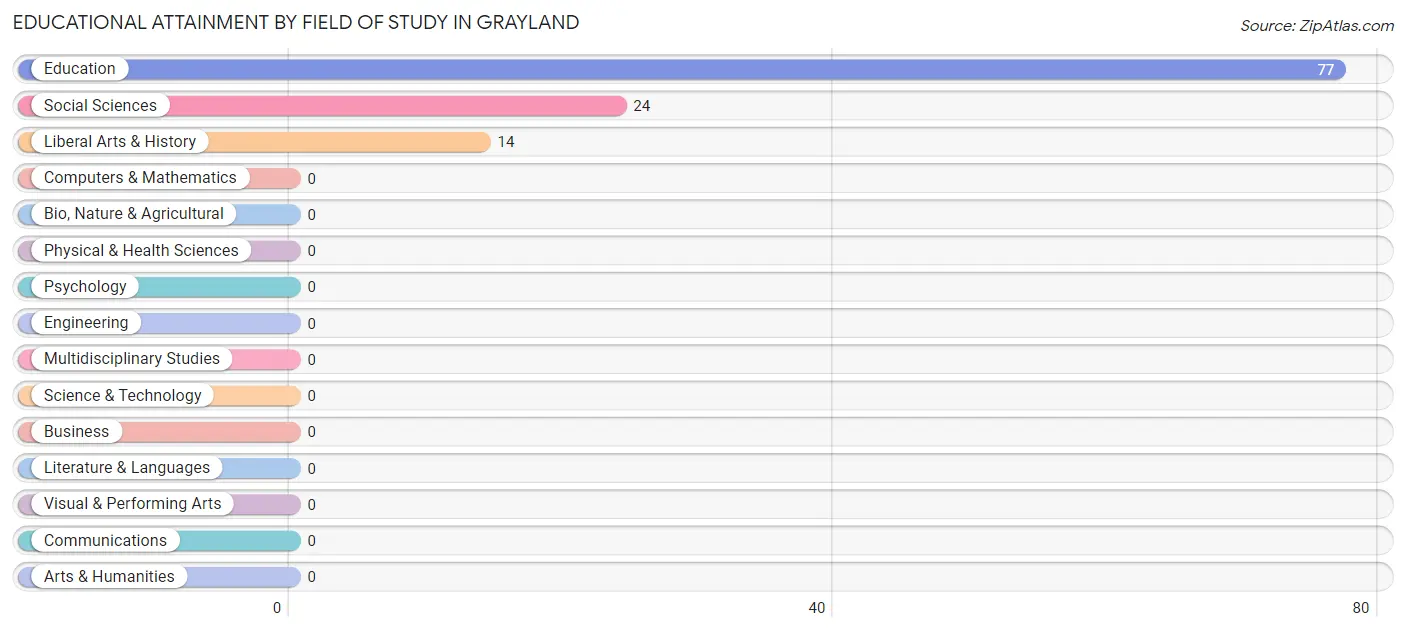
| Field of Study | # Graduates | % Graduates |
| Computers & Mathematics | 0 | 0.0% |
| Bio, Nature & Agricultural | 0 | 0.0% |
| Physical & Health Sciences | 0 | 0.0% |
| Psychology | 0 | 0.0% |
| Social Sciences | 24 | 20.9% |
| Engineering | 0 | 0.0% |
| Multidisciplinary Studies | 0 | 0.0% |
| Science & Technology | 0 | 0.0% |
| Business | 0 | 0.0% |
| Education | 77 | 67.0% |
| Literature & Languages | 0 | 0.0% |
| Liberal Arts & History | 14 | 12.2% |
| Visual & Performing Arts | 0 | 0.0% |
| Communications | 0 | 0.0% |
| Arts & Humanities | 0 | 0.0% |
| Total | 115 | 100.0% |
Transportation & Commute in Grayland
Vehicle Availability by Sex in Grayland
The most prevalent vehicle ownership categories in Grayland are males with 2 vehicles (37, accounting for 41.6%) and females with 2 vehicles (25, making up 66.1%).
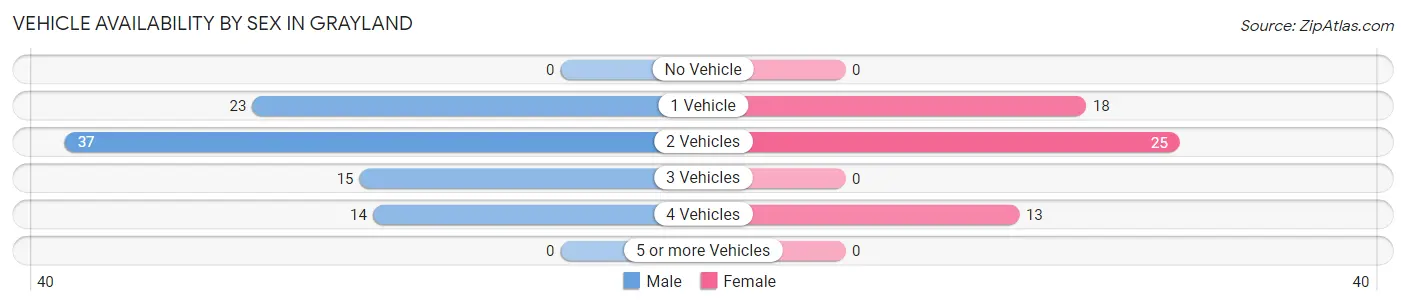
| Vehicles Available | Male | Female |
| No Vehicle | 0 (0.0%) | 0 (0.0%) |
| 1 Vehicle | 23 (25.8%) | 18 (32.1%) |
| 2 Vehicles | 37 (41.6%) | 25 (44.6%) |
| 3 Vehicles | 15 (16.9%) | 0 (0.0%) |
| 4 Vehicles | 14 (15.7%) | 13 (23.2%) |
| 5 or more Vehicles | 0 (0.0%) | 0 (0.0%) |
| Total | 89 (100.0%) | 56 (100.0%) |
Commute Time in Grayland
The most frequently occuring commute durations in Grayland are 10 to 14 minutes (39 commuters, 30.7%), less than 5 minutes (38 commuters, 29.9%), and 5 to 9 minutes (36 commuters, 28.3%).
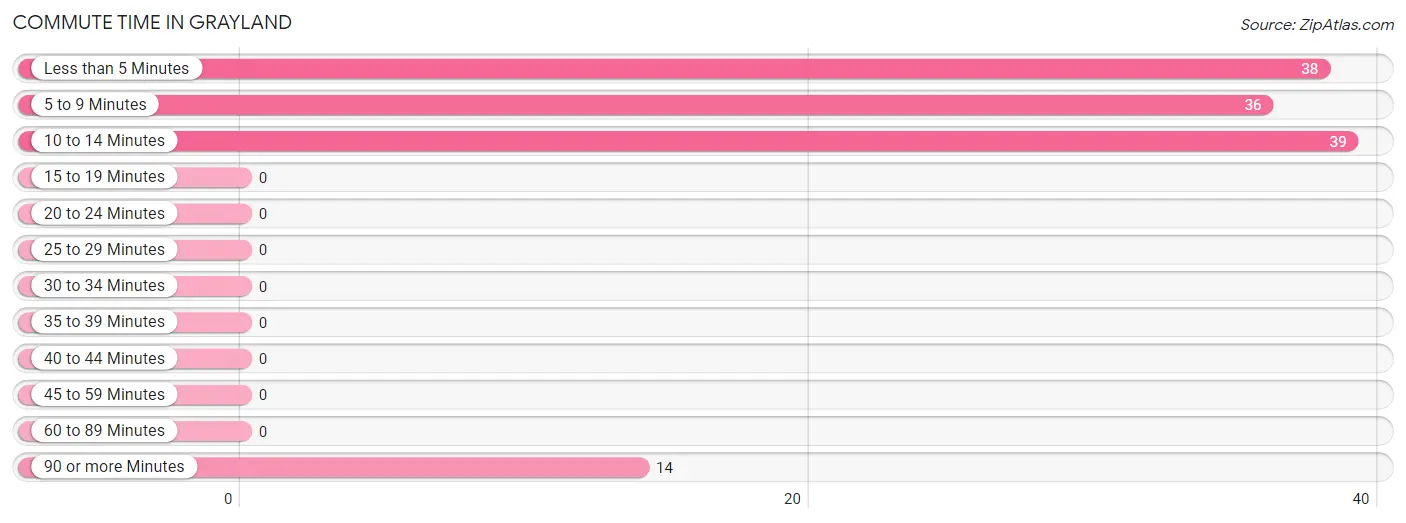
| Commute Time | # Commuters | % Commuters |
| Less than 5 Minutes | 38 | 29.9% |
| 5 to 9 Minutes | 36 | 28.3% |
| 10 to 14 Minutes | 39 | 30.7% |
| 15 to 19 Minutes | 0 | 0.0% |
| 20 to 24 Minutes | 0 | 0.0% |
| 25 to 29 Minutes | 0 | 0.0% |
| 30 to 34 Minutes | 0 | 0.0% |
| 35 to 39 Minutes | 0 | 0.0% |
| 40 to 44 Minutes | 0 | 0.0% |
| 45 to 59 Minutes | 0 | 0.0% |
| 60 to 89 Minutes | 0 | 0.0% |
| 90 or more Minutes | 14 | 11.0% |
Commute Time by Sex in Grayland
The most common commute times in Grayland are 10 to 14 minutes (39 commuters, 43.8%) for males and less than 5 minutes (25 commuters, 65.8%) for females.
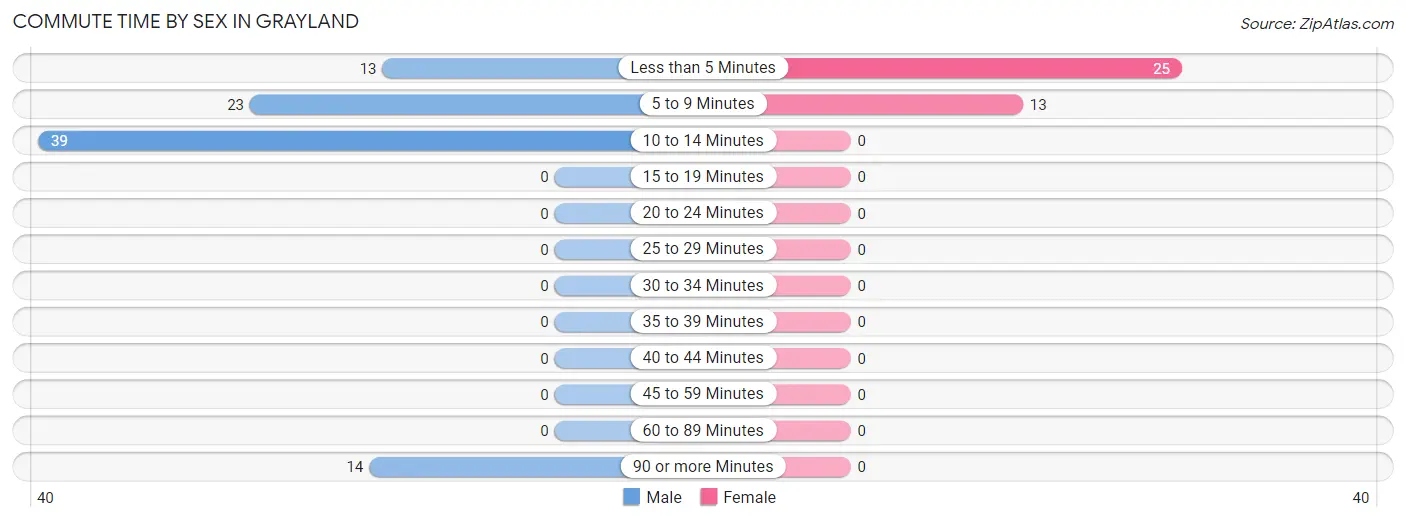
| Commute Time | Male | Female |
| Less than 5 Minutes | 13 (14.6%) | 25 (65.8%) |
| 5 to 9 Minutes | 23 (25.8%) | 13 (34.2%) |
| 10 to 14 Minutes | 39 (43.8%) | 0 (0.0%) |
| 15 to 19 Minutes | 0 (0.0%) | 0 (0.0%) |
| 20 to 24 Minutes | 0 (0.0%) | 0 (0.0%) |
| 25 to 29 Minutes | 0 (0.0%) | 0 (0.0%) |
| 30 to 34 Minutes | 0 (0.0%) | 0 (0.0%) |
| 35 to 39 Minutes | 0 (0.0%) | 0 (0.0%) |
| 40 to 44 Minutes | 0 (0.0%) | 0 (0.0%) |
| 45 to 59 Minutes | 0 (0.0%) | 0 (0.0%) |
| 60 to 89 Minutes | 0 (0.0%) | 0 (0.0%) |
| 90 or more Minutes | 14 (15.7%) | 0 (0.0%) |
Time of Departure to Work by Sex in Grayland
The most frequent times of departure to work in Grayland are 8:00 AM to 8:29 AM (29, 32.6%) for males and 7:30 AM to 7:59 AM (25, 65.8%) for females.
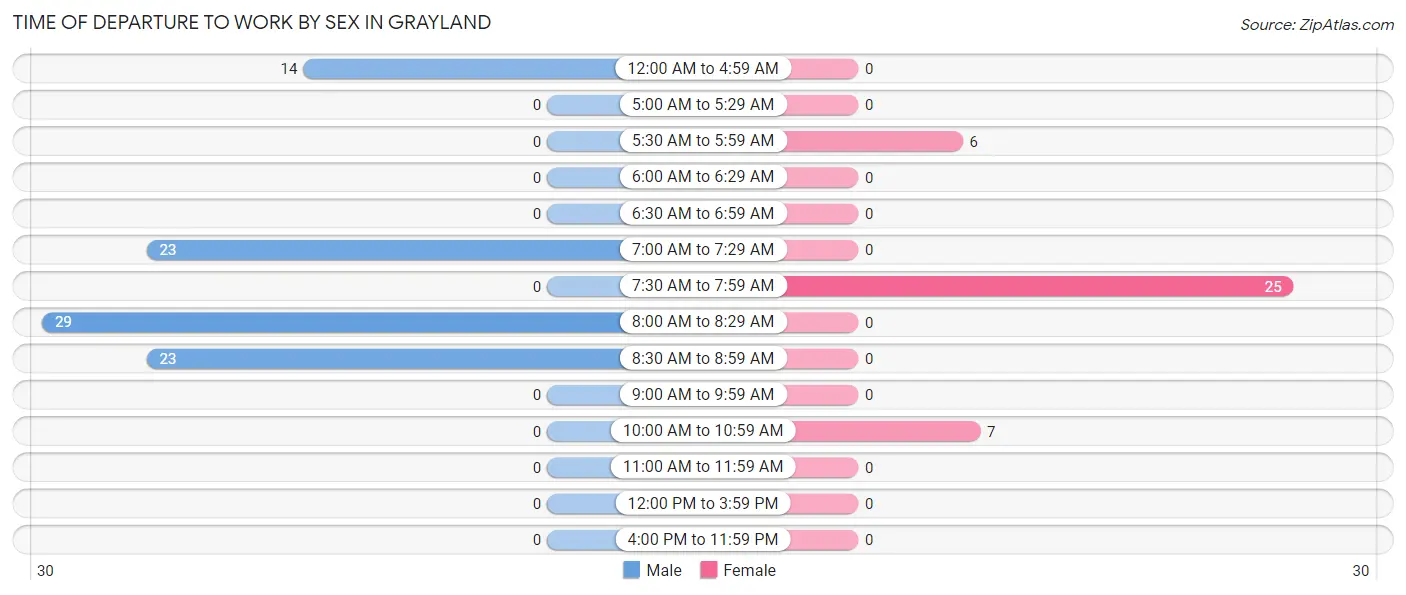
| Time of Departure | Male | Female |
| 12:00 AM to 4:59 AM | 14 (15.7%) | 0 (0.0%) |
| 5:00 AM to 5:29 AM | 0 (0.0%) | 0 (0.0%) |
| 5:30 AM to 5:59 AM | 0 (0.0%) | 6 (15.8%) |
| 6:00 AM to 6:29 AM | 0 (0.0%) | 0 (0.0%) |
| 6:30 AM to 6:59 AM | 0 (0.0%) | 0 (0.0%) |
| 7:00 AM to 7:29 AM | 23 (25.8%) | 0 (0.0%) |
| 7:30 AM to 7:59 AM | 0 (0.0%) | 25 (65.8%) |
| 8:00 AM to 8:29 AM | 29 (32.6%) | 0 (0.0%) |
| 8:30 AM to 8:59 AM | 23 (25.8%) | 0 (0.0%) |
| 9:00 AM to 9:59 AM | 0 (0.0%) | 0 (0.0%) |
| 10:00 AM to 10:59 AM | 0 (0.0%) | 7 (18.4%) |
| 11:00 AM to 11:59 AM | 0 (0.0%) | 0 (0.0%) |
| 12:00 PM to 3:59 PM | 0 (0.0%) | 0 (0.0%) |
| 4:00 PM to 11:59 PM | 0 (0.0%) | 0 (0.0%) |
| Total | 89 (100.0%) | 38 (100.0%) |
Housing Occupancy in Grayland
Occupancy by Ownership in Grayland
Of the total 401 dwellings in Grayland, owner-occupied units account for 326 (81.3%), while renter-occupied units make up 75 (18.7%).
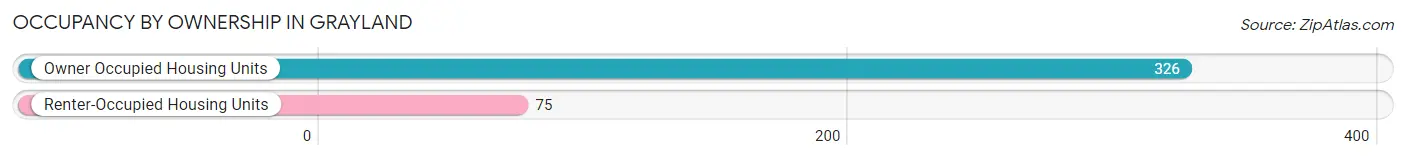
| Occupancy | # Housing Units | % Housing Units |
| Owner Occupied Housing Units | 326 | 81.3% |
| Renter-Occupied Housing Units | 75 | 18.7% |
| Total Occupied Housing Units | 401 | 100.0% |
Occupancy by Household Size in Grayland
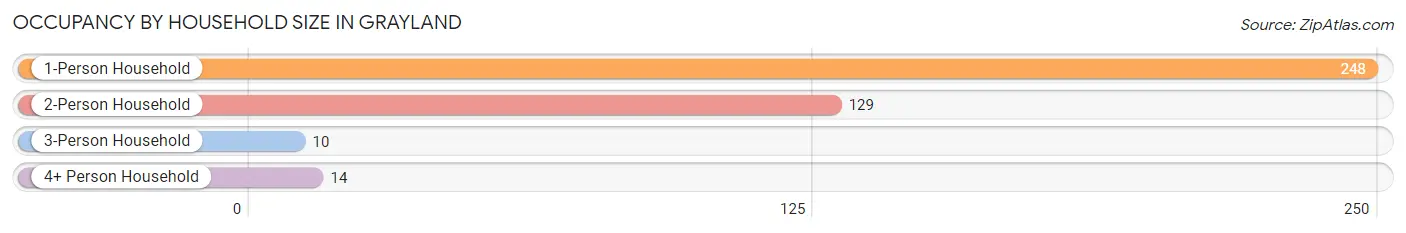
| Household Size | # Housing Units | % Housing Units |
| 1-Person Household | 248 | 61.9% |
| 2-Person Household | 129 | 32.2% |
| 3-Person Household | 10 | 2.5% |
| 4+ Person Household | 14 | 3.5% |
| Total Housing Units | 401 | 100.0% |
Occupancy by Ownership by Household Size in Grayland
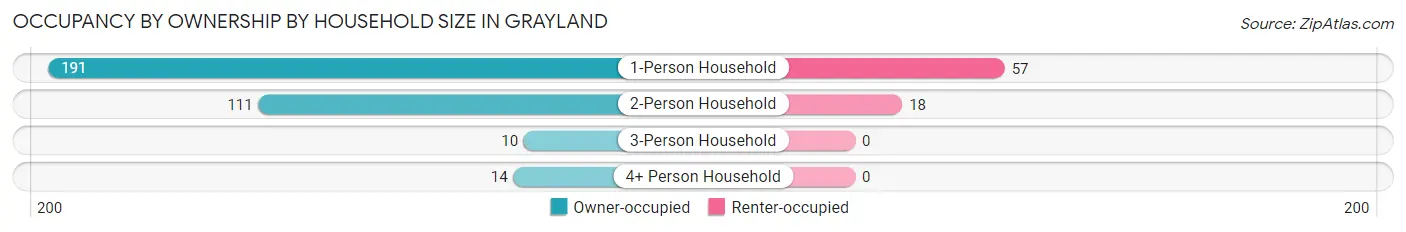
| Household Size | Owner-occupied | Renter-occupied |
| 1-Person Household | 191 (77.0%) | 57 (23.0%) |
| 2-Person Household | 111 (86.1%) | 18 (14.0%) |
| 3-Person Household | 10 (100.0%) | 0 (0.0%) |
| 4+ Person Household | 14 (100.0%) | 0 (0.0%) |
| Total Housing Units | 326 (81.3%) | 75 (18.7%) |
Occupancy by Educational Attainment in Grayland
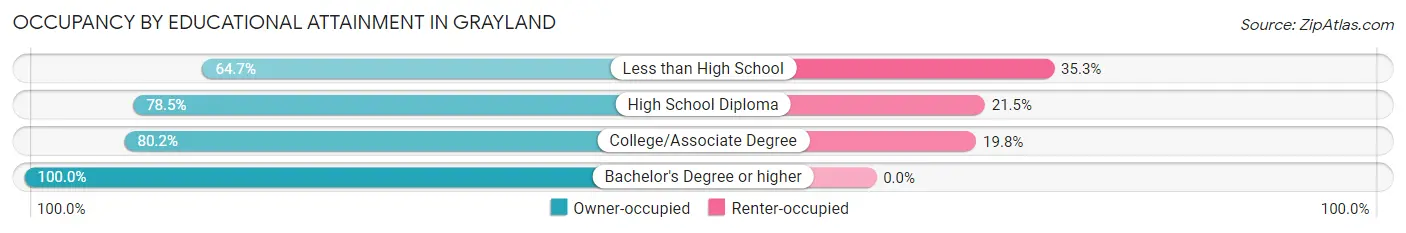
| Household Size | Owner-occupied | Renter-occupied |
| Less than High School | 33 (64.7%) | 18 (35.3%) |
| High School Diploma | 51 (78.5%) | 14 (21.5%) |
| College/Associate Degree | 174 (80.2%) | 43 (19.8%) |
| Bachelor's Degree or higher | 68 (100.0%) | 0 (0.0%) |
Occupancy by Age of Householder in Grayland
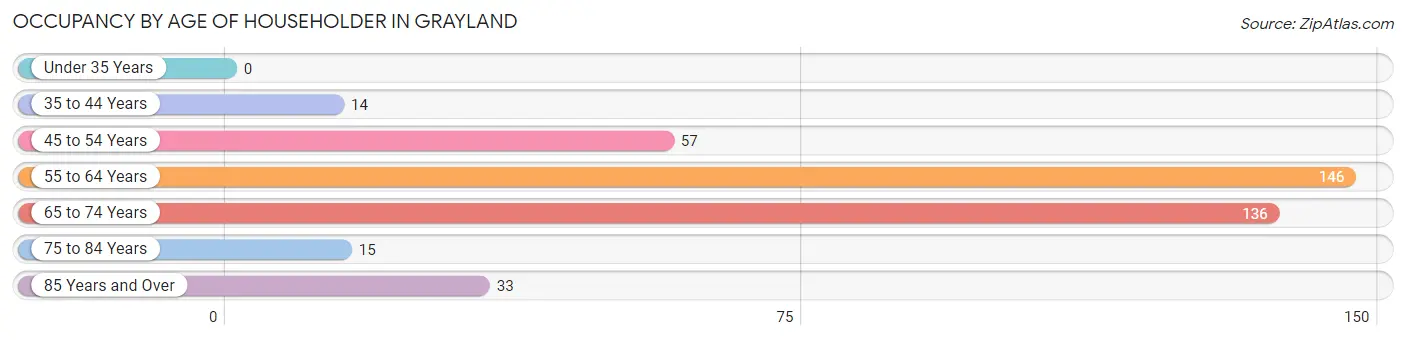
| Age Bracket | # Households | % Households |
| Under 35 Years | 0 | 0.0% |
| 35 to 44 Years | 14 | 3.5% |
| 45 to 54 Years | 57 | 14.2% |
| 55 to 64 Years | 146 | 36.4% |
| 65 to 74 Years | 136 | 33.9% |
| 75 to 84 Years | 15 | 3.7% |
| 85 Years and Over | 33 | 8.2% |
| Total | 401 | 100.0% |
Housing Finances in Grayland
Median Income by Occupancy in Grayland
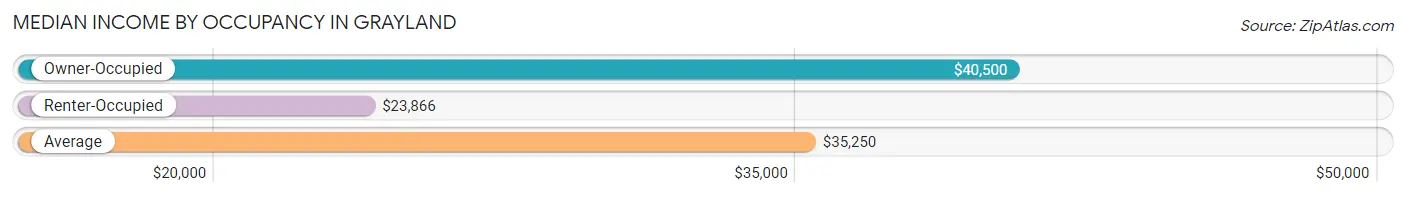
| Occupancy Type | # Households | Median Income |
| Owner-Occupied | 326 (81.3%) | $40,500 |
| Renter-Occupied | 75 (18.7%) | $23,866 |
| Average | 401 (100.0%) | $35,250 |
Occupancy by Householder Income Bracket in Grayland
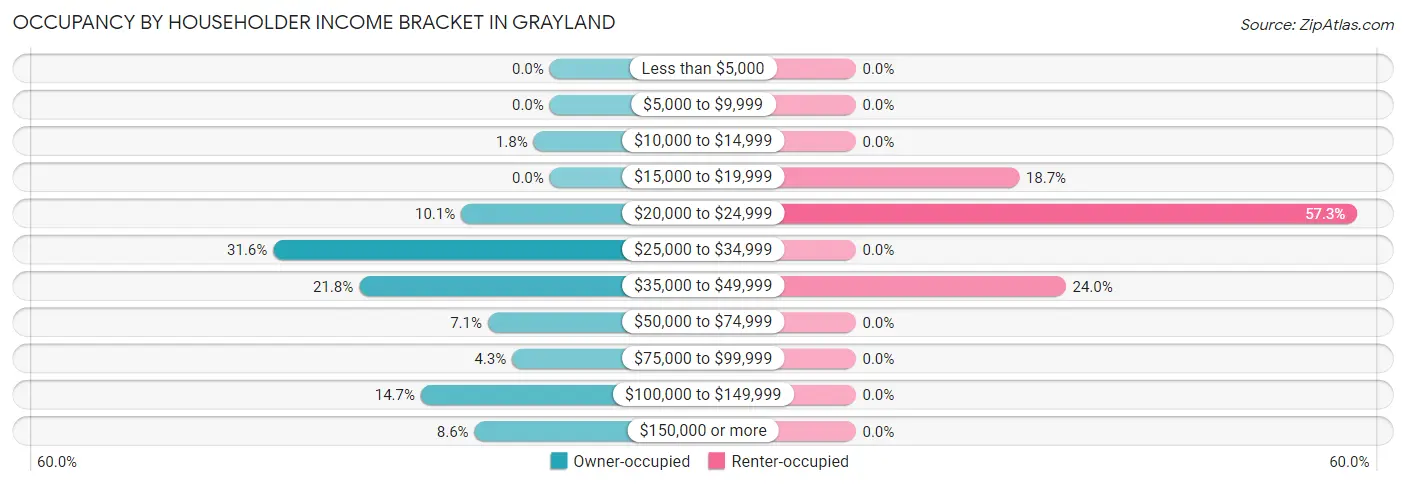
| Income Bracket | Owner-occupied | Renter-occupied |
| Less than $5,000 | 0 (0.0%) | 0 (0.0%) |
| $5,000 to $9,999 | 0 (0.0%) | 0 (0.0%) |
| $10,000 to $14,999 | 6 (1.8%) | 0 (0.0%) |
| $15,000 to $19,999 | 0 (0.0%) | 14 (18.7%) |
| $20,000 to $24,999 | 33 (10.1%) | 43 (57.3%) |
| $25,000 to $34,999 | 103 (31.6%) | 0 (0.0%) |
| $35,000 to $49,999 | 71 (21.8%) | 18 (24.0%) |
| $50,000 to $74,999 | 23 (7.1%) | 0 (0.0%) |
| $75,000 to $99,999 | 14 (4.3%) | 0 (0.0%) |
| $100,000 to $149,999 | 48 (14.7%) | 0 (0.0%) |
| $150,000 or more | 28 (8.6%) | 0 (0.0%) |
| Total | 326 (100.0%) | 75 (100.0%) |
Monthly Housing Cost Tiers in Grayland
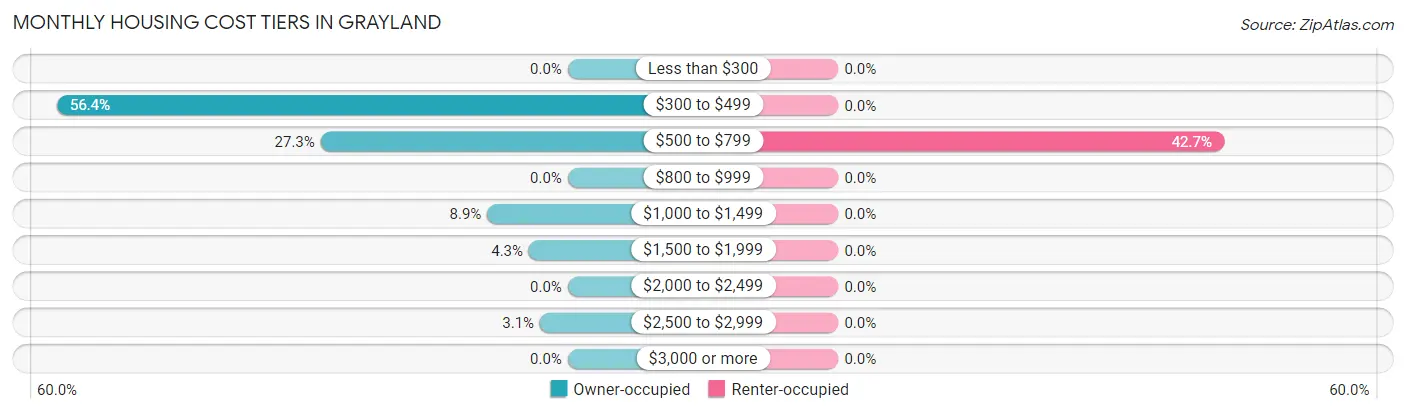
| Monthly Cost | Owner-occupied | Renter-occupied |
| Less than $300 | 0 (0.0%) | 0 (0.0%) |
| $300 to $499 | 184 (56.4%) | 0 (0.0%) |
| $500 to $799 | 89 (27.3%) | 32 (42.7%) |
| $800 to $999 | 0 (0.0%) | 0 (0.0%) |
| $1,000 to $1,499 | 29 (8.9%) | 0 (0.0%) |
| $1,500 to $1,999 | 14 (4.3%) | 0 (0.0%) |
| $2,000 to $2,499 | 0 (0.0%) | 0 (0.0%) |
| $2,500 to $2,999 | 10 (3.1%) | 0 (0.0%) |
| $3,000 or more | 0 (0.0%) | 0 (0.0%) |
| Total | 326 (100.0%) | 75 (100.0%) |
Physical Housing Characteristics in Grayland
Housing Structures in Grayland
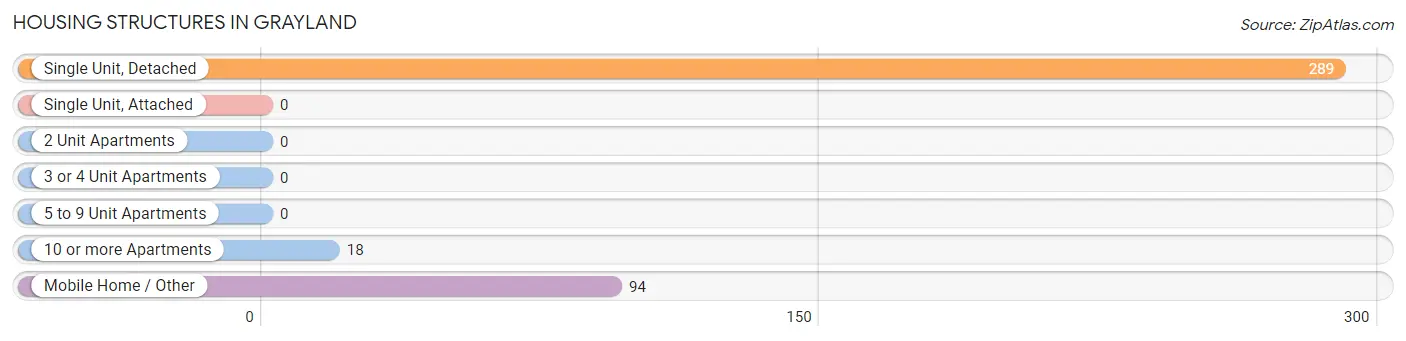
| Structure Type | # Housing Units | % Housing Units |
| Single Unit, Detached | 289 | 72.1% |
| Single Unit, Attached | 0 | 0.0% |
| 2 Unit Apartments | 0 | 0.0% |
| 3 or 4 Unit Apartments | 0 | 0.0% |
| 5 to 9 Unit Apartments | 0 | 0.0% |
| 10 or more Apartments | 18 | 4.5% |
| Mobile Home / Other | 94 | 23.4% |
| Total | 401 | 100.0% |
Housing Structures by Occupancy in Grayland
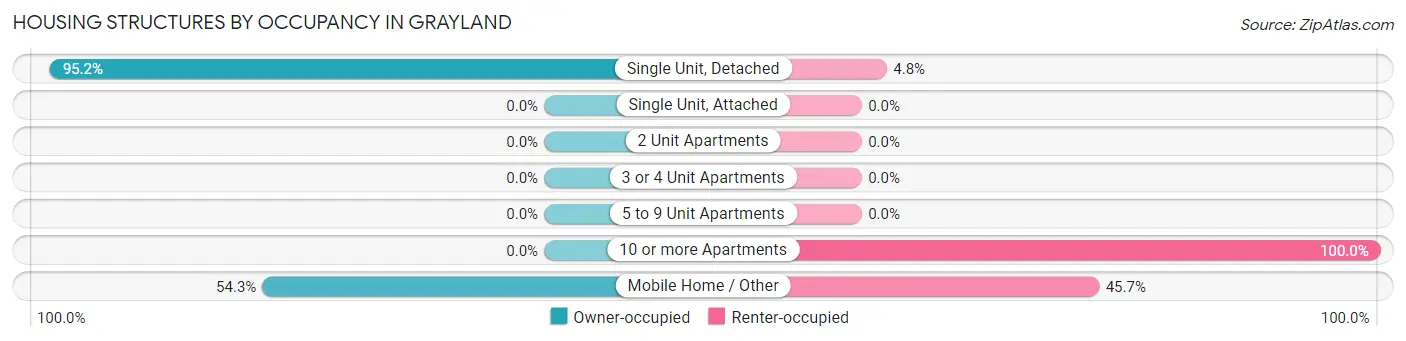
| Structure Type | Owner-occupied | Renter-occupied |
| Single Unit, Detached | 275 (95.2%) | 14 (4.8%) |
| Single Unit, Attached | 0 (0.0%) | 0 (0.0%) |
| 2 Unit Apartments | 0 (0.0%) | 0 (0.0%) |
| 3 or 4 Unit Apartments | 0 (0.0%) | 0 (0.0%) |
| 5 to 9 Unit Apartments | 0 (0.0%) | 0 (0.0%) |
| 10 or more Apartments | 0 (0.0%) | 18 (100.0%) |
| Mobile Home / Other | 51 (54.3%) | 43 (45.7%) |
| Total | 326 (81.3%) | 75 (18.7%) |
Housing Structures by Number of Rooms in Grayland
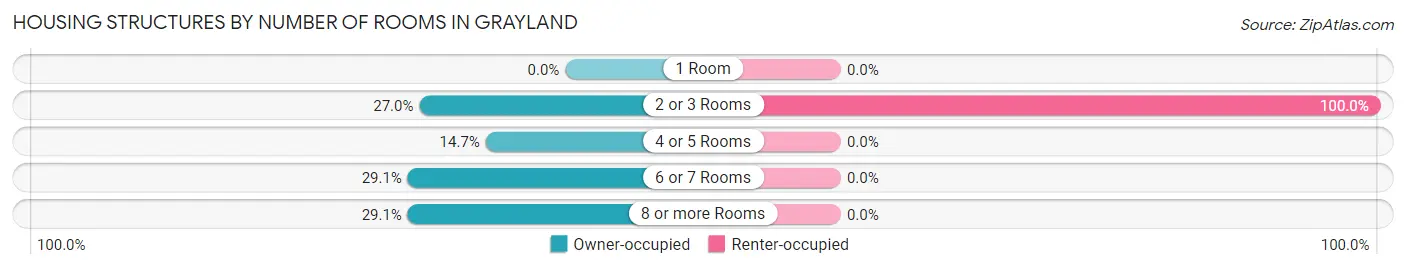
| Number of Rooms | Owner-occupied | Renter-occupied |
| 1 Room | 0 (0.0%) | 0 (0.0%) |
| 2 or 3 Rooms | 88 (27.0%) | 75 (100.0%) |
| 4 or 5 Rooms | 48 (14.7%) | 0 (0.0%) |
| 6 or 7 Rooms | 95 (29.1%) | 0 (0.0%) |
| 8 or more Rooms | 95 (29.1%) | 0 (0.0%) |
| Total | 326 (100.0%) | 75 (100.0%) |
Housing Structure by Heating Type in Grayland
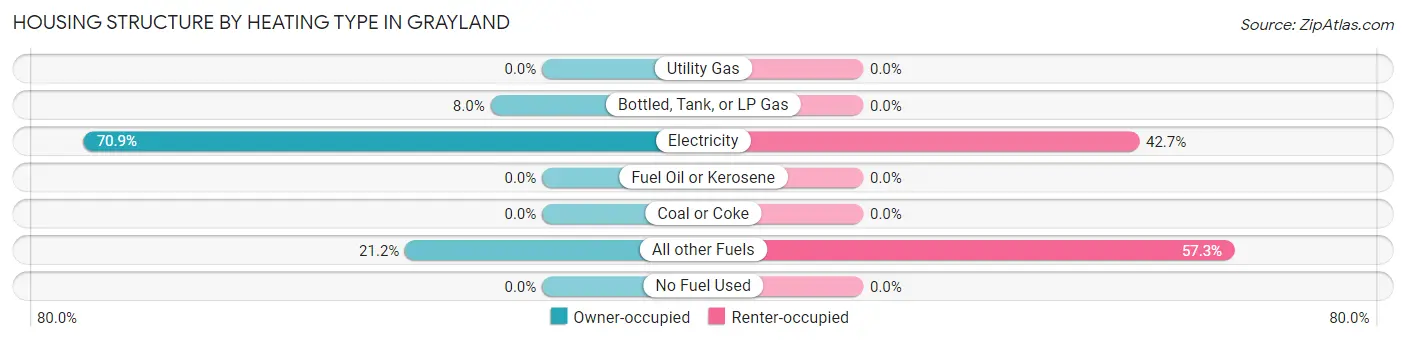
| Heating Type | Owner-occupied | Renter-occupied |
| Utility Gas | 0 (0.0%) | 0 (0.0%) |
| Bottled, Tank, or LP Gas | 26 (8.0%) | 0 (0.0%) |
| Electricity | 231 (70.9%) | 32 (42.7%) |
| Fuel Oil or Kerosene | 0 (0.0%) | 0 (0.0%) |
| Coal or Coke | 0 (0.0%) | 0 (0.0%) |
| All other Fuels | 69 (21.2%) | 43 (57.3%) |
| No Fuel Used | 0 (0.0%) | 0 (0.0%) |
| Total | 326 (100.0%) | 75 (100.0%) |
Household Vehicle Usage in Grayland
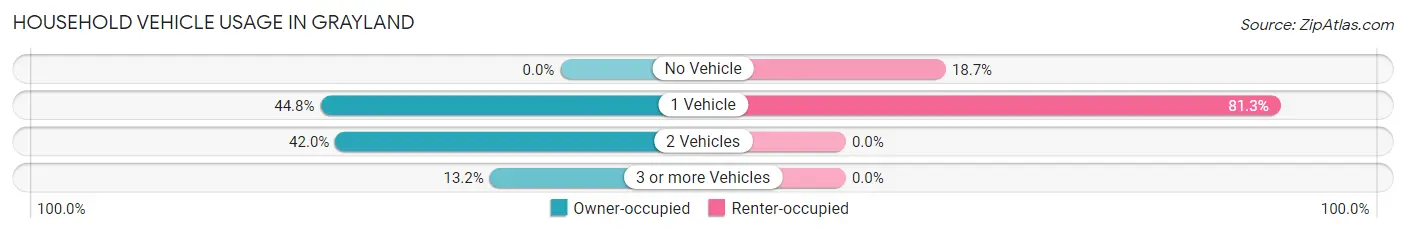
| Vehicles per Household | Owner-occupied | Renter-occupied |
| No Vehicle | 0 (0.0%) | 14 (18.7%) |
| 1 Vehicle | 146 (44.8%) | 61 (81.3%) |
| 2 Vehicles | 137 (42.0%) | 0 (0.0%) |
| 3 or more Vehicles | 43 (13.2%) | 0 (0.0%) |
| Total | 326 (100.0%) | 75 (100.0%) |
Real Estate & Mortgages in Grayland
Real Estate and Mortgage Overview in Grayland
| Characteristic | Without Mortgage | With Mortgage |
| Housing Units | 222 | 104 |
| Median Property Value | $212,500 | $162,500 |
| Median Household Income | - | - |
| Monthly Housing Costs | $454 | $0 |
| Real Estate Taxes | $2,218 | $0 |
Property Value by Mortgage Status in Grayland
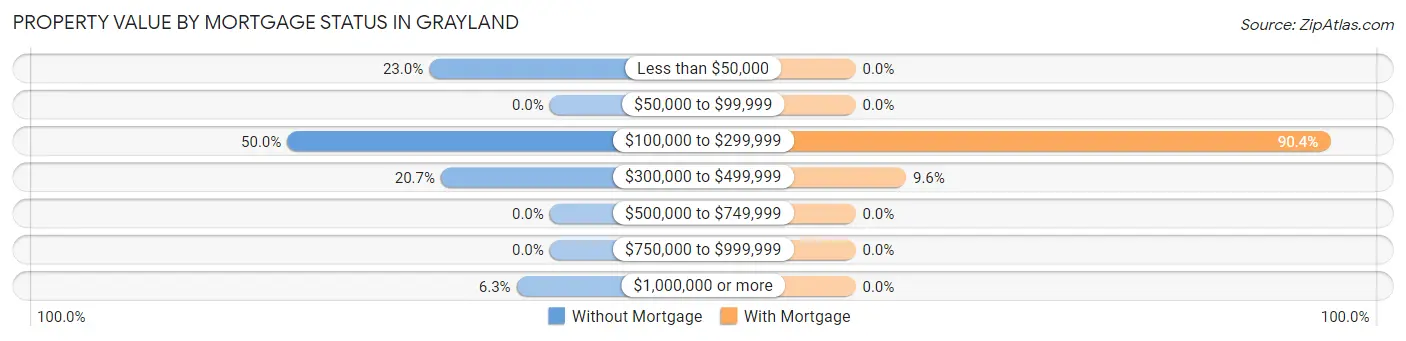
| Property Value | Without Mortgage | With Mortgage |
| Less than $50,000 | 51 (23.0%) | 0 (0.0%) |
| $50,000 to $99,999 | 0 (0.0%) | 0 (0.0%) |
| $100,000 to $299,999 | 111 (50.0%) | 94 (90.4%) |
| $300,000 to $499,999 | 46 (20.7%) | 10 (9.6%) |
| $500,000 to $749,999 | 0 (0.0%) | 0 (0.0%) |
| $750,000 to $999,999 | 0 (0.0%) | 0 (0.0%) |
| $1,000,000 or more | 14 (6.3%) | 0 (0.0%) |
| Total | 222 (100.0%) | 104 (100.0%) |
Household Income by Mortgage Status in Grayland
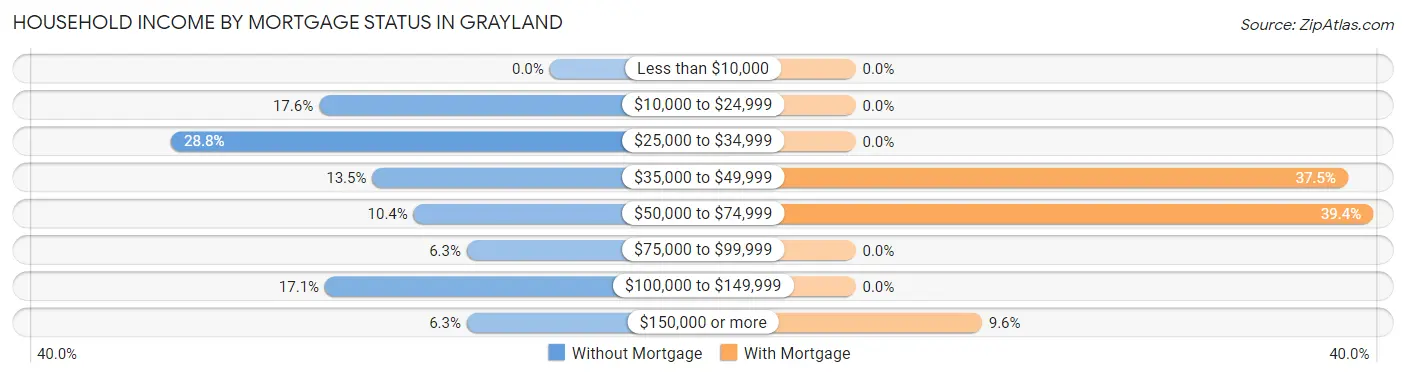
| Household Income | Without Mortgage | With Mortgage |
| Less than $10,000 | 0 (0.0%) | 0 (0.0%) |
| $10,000 to $24,999 | 39 (17.6%) | 0 (0.0%) |
| $25,000 to $34,999 | 64 (28.8%) | 0 (0.0%) |
| $35,000 to $49,999 | 30 (13.5%) | 39 (37.5%) |
| $50,000 to $74,999 | 23 (10.4%) | 41 (39.4%) |
| $75,000 to $99,999 | 14 (6.3%) | 0 (0.0%) |
| $100,000 to $149,999 | 38 (17.1%) | 0 (0.0%) |
| $150,000 or more | 14 (6.3%) | 10 (9.6%) |
| Total | 222 (100.0%) | 104 (100.0%) |
Property Value to Household Income Ratio in Grayland
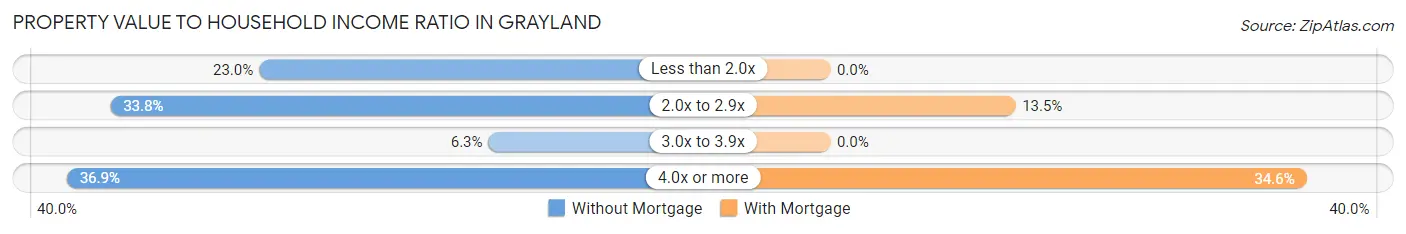
| Value-to-Income Ratio | Without Mortgage | With Mortgage |
| Less than 2.0x | 51 (23.0%) | 0 (0.0%) |
| 2.0x to 2.9x | 75 (33.8%) | 14 (13.5%) |
| 3.0x to 3.9x | 14 (6.3%) | 0 (0.0%) |
| 4.0x or more | 82 (36.9%) | 36 (34.6%) |
| Total | 222 (100.0%) | 104 (100.0%) |
Real Estate Taxes by Mortgage Status in Grayland
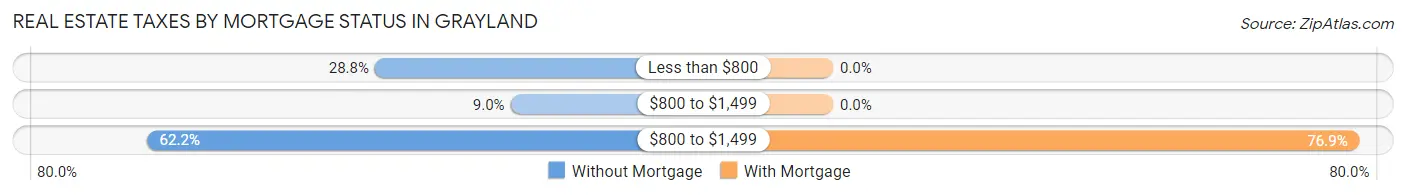
| Property Taxes | Without Mortgage | With Mortgage |
| Less than $800 | 64 (28.8%) | 0 (0.0%) |
| $800 to $1,499 | 20 (9.0%) | 0 (0.0%) |
| $800 to $1,499 | 138 (62.2%) | 80 (76.9%) |
| Total | 222 (100.0%) | 104 (100.0%) |
Health & Disability in Grayland
Health Insurance Coverage by Age in Grayland
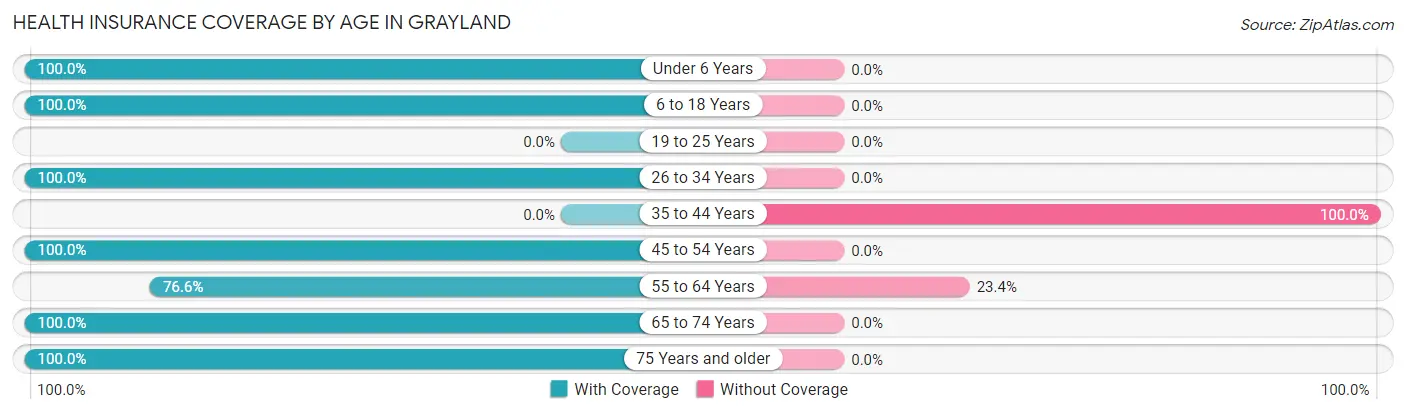
| Age Bracket | With Coverage | Without Coverage |
| Under 6 Years | 16 (100.0%) | 0 (0.0%) |
| 6 to 18 Years | 21 (100.0%) | 0 (0.0%) |
| 19 to 25 Years | 0 (0.0%) | 0 (0.0%) |
| 26 to 34 Years | 13 (100.0%) | 0 (0.0%) |
| 35 to 44 Years | 0 (0.0%) | 14 (100.0%) |
| 45 to 54 Years | 70 (100.0%) | 0 (0.0%) |
| 55 to 64 Years | 167 (76.6%) | 51 (23.4%) |
| 65 to 74 Years | 175 (100.0%) | 0 (0.0%) |
| 75 Years and older | 48 (100.0%) | 0 (0.0%) |
| Total | 510 (88.7%) | 65 (11.3%) |
Health Insurance Coverage by Citizenship Status in Grayland
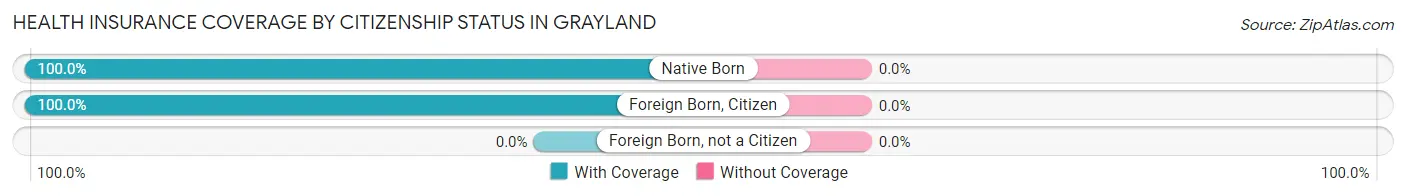
| Citizenship Status | With Coverage | Without Coverage |
| Native Born | 16 (100.0%) | 0 (0.0%) |
| Foreign Born, Citizen | 21 (100.0%) | 0 (0.0%) |
| Foreign Born, not a Citizen | 0 (0.0%) | 0 (0.0%) |
Health Insurance Coverage by Household Income in Grayland
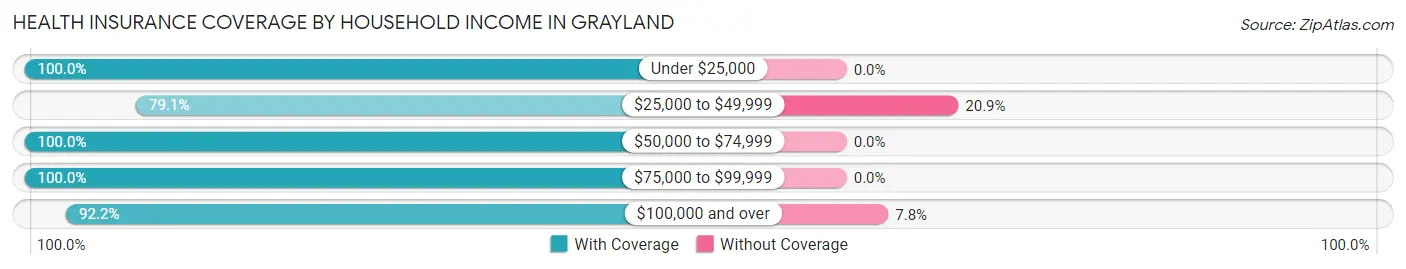
| Household Income | With Coverage | Without Coverage |
| Under $25,000 | 102 (100.0%) | 0 (0.0%) |
| $25,000 to $49,999 | 193 (79.1%) | 51 (20.9%) |
| $50,000 to $74,999 | 23 (100.0%) | 0 (0.0%) |
| $75,000 to $99,999 | 26 (100.0%) | 0 (0.0%) |
| $100,000 and over | 166 (92.2%) | 14 (7.8%) |
Public vs Private Health Insurance Coverage by Age in Grayland
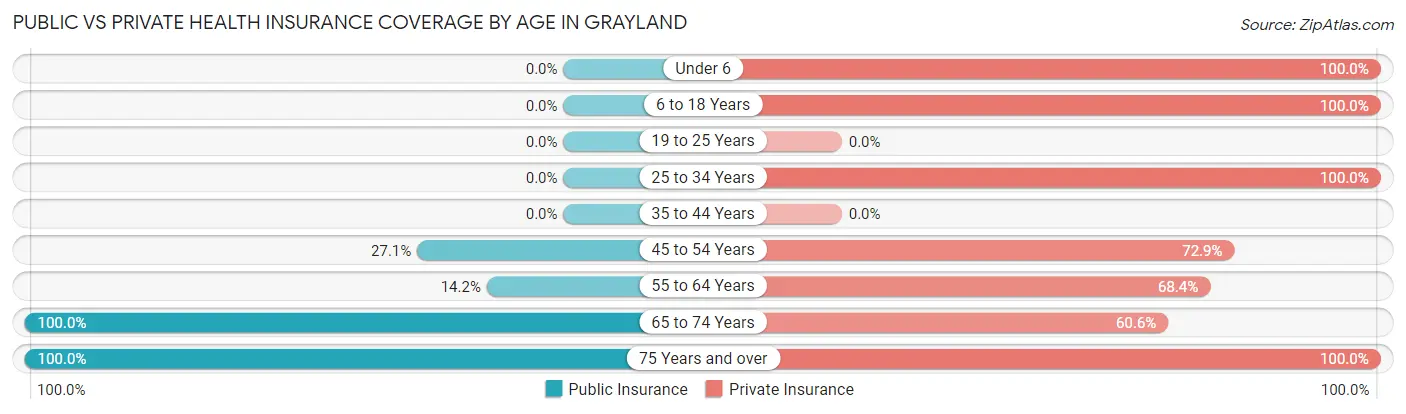
| Age Bracket | Public Insurance | Private Insurance |
| Under 6 | 0 (0.0%) | 16 (100.0%) |
| 6 to 18 Years | 0 (0.0%) | 21 (100.0%) |
| 19 to 25 Years | 0 (0.0%) | 0 (0.0%) |
| 25 to 34 Years | 0 (0.0%) | 13 (100.0%) |
| 35 to 44 Years | 0 (0.0%) | 0 (0.0%) |
| 45 to 54 Years | 19 (27.1%) | 51 (72.9%) |
| 55 to 64 Years | 31 (14.2%) | 149 (68.3%) |
| 65 to 74 Years | 175 (100.0%) | 106 (60.6%) |
| 75 Years and over | 48 (100.0%) | 48 (100.0%) |
| Total | 273 (47.5%) | 404 (70.3%) |
Disability Status by Sex by Age in Grayland
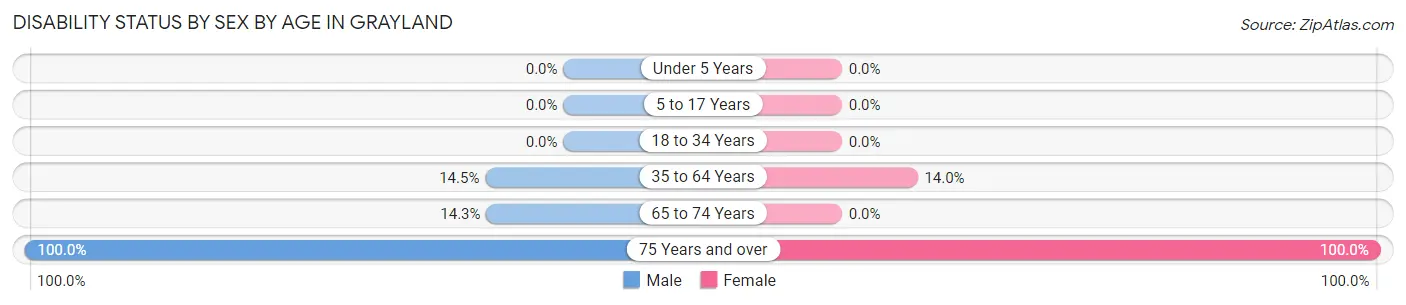
| Age Bracket | Male | Female |
| Under 5 Years | 0 (0.0%) | 0 (0.0%) |
| 5 to 17 Years | 0 (0.0%) | 0 (0.0%) |
| 18 to 34 Years | 0 (0.0%) | 0 (0.0%) |
| 35 to 64 Years | 19 (14.5%) | 24 (14.0%) |
| 65 to 74 Years | 14 (14.3%) | 0 (0.0%) |
| 75 Years and over | 15 (100.0%) | 33 (100.0%) |
Disability Class by Sex by Age in Grayland
Disability Class: Hearing Difficulty
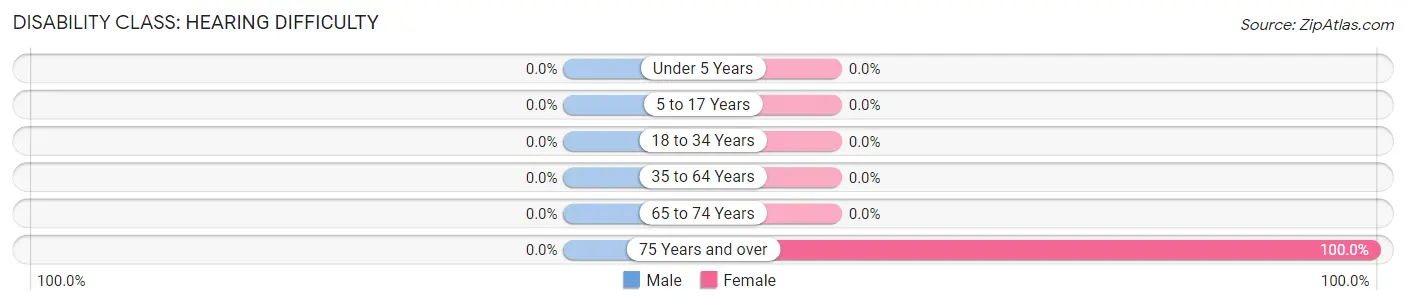
| Age Bracket | Male | Female |
| Under 5 Years | 0 (0.0%) | 0 (0.0%) |
| 5 to 17 Years | 0 (0.0%) | 0 (0.0%) |
| 18 to 34 Years | 0 (0.0%) | 0 (0.0%) |
| 35 to 64 Years | 0 (0.0%) | 0 (0.0%) |
| 65 to 74 Years | 0 (0.0%) | 0 (0.0%) |
| 75 Years and over | 0 (0.0%) | 33 (100.0%) |
Disability Class: Vision Difficulty
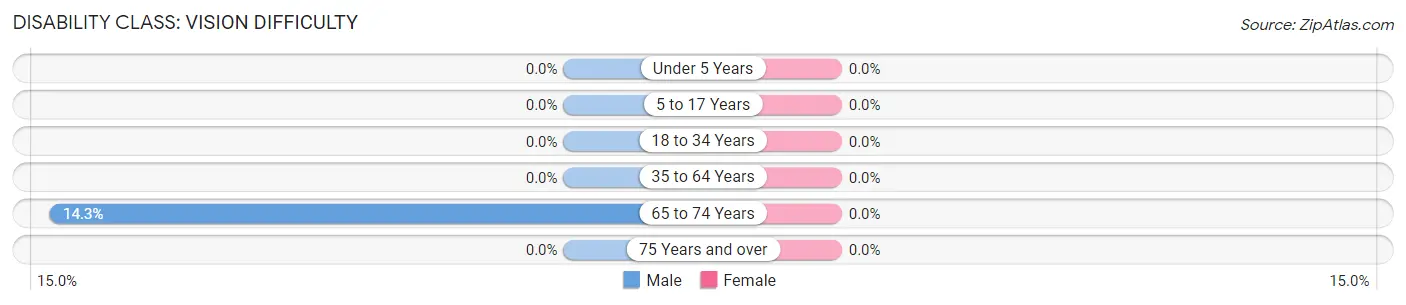
| Age Bracket | Male | Female |
| Under 5 Years | 0 (0.0%) | 0 (0.0%) |
| 5 to 17 Years | 0 (0.0%) | 0 (0.0%) |
| 18 to 34 Years | 0 (0.0%) | 0 (0.0%) |
| 35 to 64 Years | 0 (0.0%) | 0 (0.0%) |
| 65 to 74 Years | 14 (14.3%) | 0 (0.0%) |
| 75 Years and over | 0 (0.0%) | 0 (0.0%) |
Disability Class: Cognitive Difficulty
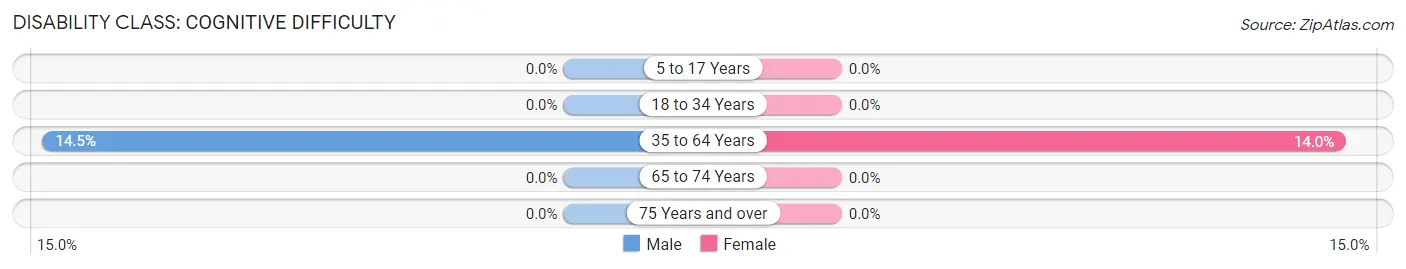
| Age Bracket | Male | Female |
| 5 to 17 Years | 0 (0.0%) | 0 (0.0%) |
| 18 to 34 Years | 0 (0.0%) | 0 (0.0%) |
| 35 to 64 Years | 19 (14.5%) | 24 (14.0%) |
| 65 to 74 Years | 0 (0.0%) | 0 (0.0%) |
| 75 Years and over | 0 (0.0%) | 0 (0.0%) |
Disability Class: Ambulatory Difficulty

| Age Bracket | Male | Female |
| 5 to 17 Years | 0 (0.0%) | 0 (0.0%) |
| 18 to 34 Years | 0 (0.0%) | 0 (0.0%) |
| 35 to 64 Years | 13 (9.9%) | 0 (0.0%) |
| 65 to 74 Years | 0 (0.0%) | 0 (0.0%) |
| 75 Years and over | 15 (100.0%) | 0 (0.0%) |
Disability Class: Self-Care Difficulty
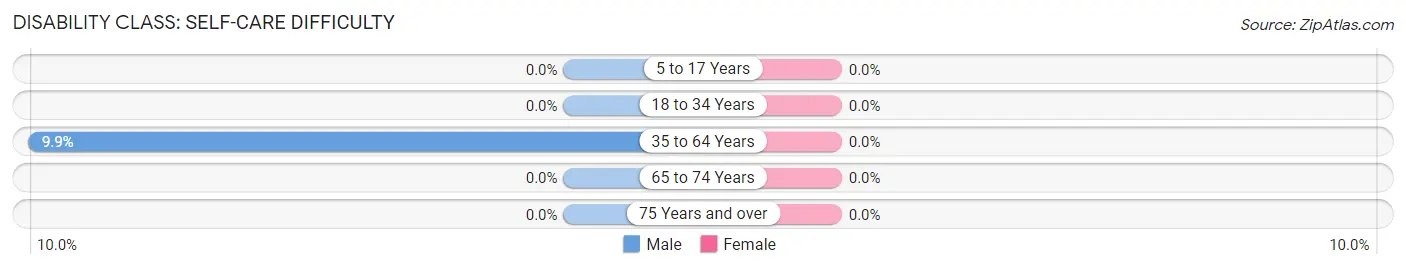
| Age Bracket | Male | Female |
| 5 to 17 Years | 0 (0.0%) | 0 (0.0%) |
| 18 to 34 Years | 0 (0.0%) | 0 (0.0%) |
| 35 to 64 Years | 13 (9.9%) | 0 (0.0%) |
| 65 to 74 Years | 0 (0.0%) | 0 (0.0%) |
| 75 Years and over | 0 (0.0%) | 0 (0.0%) |
Technology Access in Grayland
Computing Device Access in Grayland
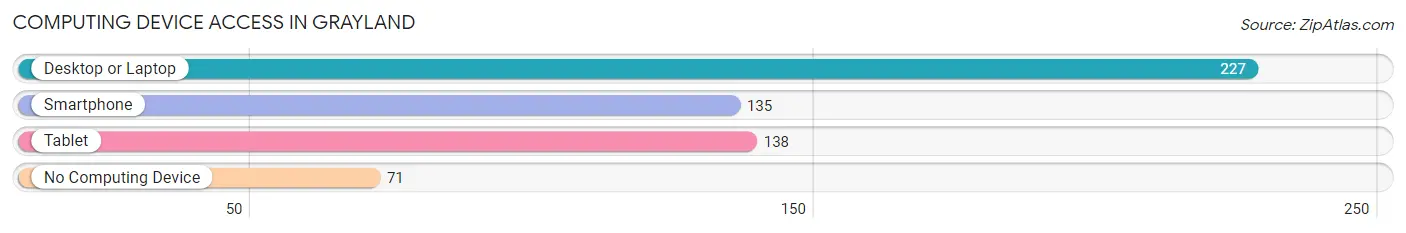
| Device Type | # Households | % Households |
| Desktop or Laptop | 227 | 56.6% |
| Smartphone | 135 | 33.7% |
| Tablet | 138 | 34.4% |
| No Computing Device | 71 | 17.7% |
| Total | 401 | 100.0% |
Internet Access in Grayland
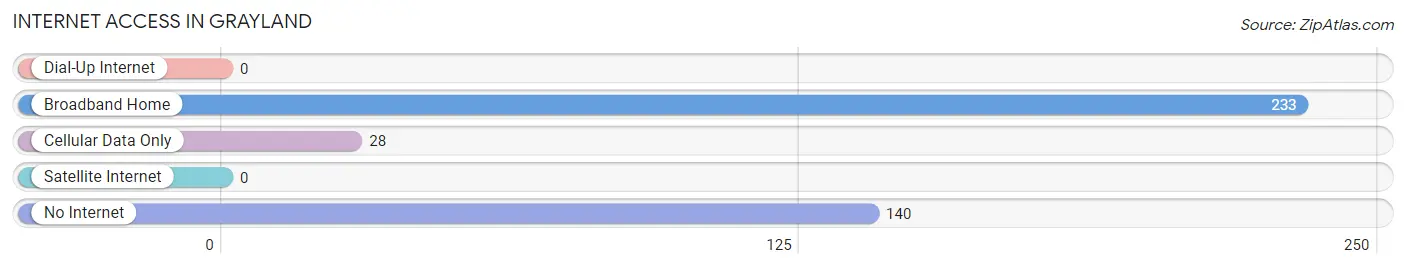
| Internet Type | # Households | % Households |
| Dial-Up Internet | 0 | 0.0% |
| Broadband Home | 233 | 58.1% |
| Cellular Data Only | 28 | 7.0% |
| Satellite Internet | 0 | 0.0% |
| No Internet | 140 | 34.9% |
| Total | 401 | 100.0% |
Grayland Summary
Geography
Grayland is a small unincorporated community located in Grays Harbor County, Washington, United States. It is situated on the Pacific Coast, approximately 20 miles south of the city of Aberdeen and about 10 miles north of the town of Westport. The community is located on the Willapa Bay, a large estuary that is part of the larger Puget Sound. The area is known for its beautiful beaches, lush forests, and abundant wildlife.
The area around Grayland is mostly rural, with a few small towns and villages scattered throughout the region. The nearest major city is Olympia, located about 70 miles to the east. The nearest airport is the Olympia Regional Airport, located about 50 miles away.
The climate in Grayland is mild and temperate, with warm summers and cool winters. The average annual temperature is around 50 degrees Fahrenheit, with temperatures rarely dropping below freezing. The area receives an average of about 40 inches of rain per year, with most of it falling during the winter months.
History
Grayland was first settled in the late 1800s by a group of settlers from the Midwest. The area was originally known as Grayland Station, named after the nearby Grayland Station on the Northern Pacific Railroad. The area was primarily used for logging and fishing, and the town grew slowly over the years.
In the early 1900s, the area began to attract tourists, and the town began to grow. The town was officially incorporated in 1910, and the population grew to over 500 by the 1920s. The town was a popular destination for beachgoers, and the area was known for its beautiful beaches and abundant wildlife.
In the 1950s, the town began to decline as the logging industry began to decline. The population dropped to around 200 by the 1970s, and the town was mostly abandoned by the 1980s. In recent years, the town has seen a resurgence in popularity, and the population has grown to around 500.
Economy
The economy of Grayland is largely based on tourism and fishing. The area is known for its beautiful beaches and abundant wildlife, and it is a popular destination for beachgoers and fishermen. The town also has a few small businesses, including a grocery store, a gas station, and a few restaurants.
The town is also home to a few small industries, including a fish processing plant and a lumber mill. The area is also home to a few small farms, and the local economy is supported by the sale of produce and other agricultural products.
Demographics
As of the 2010 census, the population of Grayland was 514. The racial makeup of the town was 94.3% White, 0.6% African American, 0.4% Native American, 0.4% Asian, 0.2% Pacific Islander, 0.8% from other races, and 3.3% from two or more races. Hispanic or Latino of any race were 2.7% of the population.
The median income for a household in Grayland was $37,500, and the median income for a family was $41,250. The per capita income for the town was $17,845. About 11.2% of families and 14.2% of the population were below the poverty line, including 18.2% of those under age 18 and 8.3% of those age 65 or over.
Common Questions
What is Per Capita Income in Grayland?
Per Capita income in Grayland is $50,777.
What is the Median Family Income in Grayland?
Median Family Income in Grayland is $101,020.
What is the Median Household income in Grayland?
Median Household Income in Grayland is $35,250.
What is Inequality or Gini Index in Grayland?
Inequality or Gini Index in Grayland is 0.55.
What is the Total Population of Grayland?
Total Population of Grayland is 575.
What is the Total Male Population of Grayland?
Total Male Population of Grayland is 274.
What is the Total Female Population of Grayland?
Total Female Population of Grayland is 301.
What is the Ratio of Males per 100 Females in Grayland?
There are 91.03 Males per 100 Females in Grayland.
What is the Ratio of Females per 100 Males in Grayland?
There are 109.85 Females per 100 Males in Grayland.
What is the Median Population Age in Grayland?
Median Population Age in Grayland is 63.5 Years.
What is the Average Family Size in Grayland
Average Family Size in Grayland is 2.2 People.
What is the Average Household Size in Grayland
Average Household Size in Grayland is 1.4 People.
How Large is the Labor Force in Grayland?
There are 196 People in the Labor Forcein in Grayland.
What is the Percentage of People in the Labor Force in Grayland?
36.4% of People are in the Labor Force in Grayland.
What is the Unemployment Rate in Grayland?
Unemployment Rate in Grayland is 26.0%.