Cities with the Highest Percentage of Immigrants from Hong Kong in Washington
RELATED REPORTS & OPTIONS
Hong Kong
Washington
Compare Cities
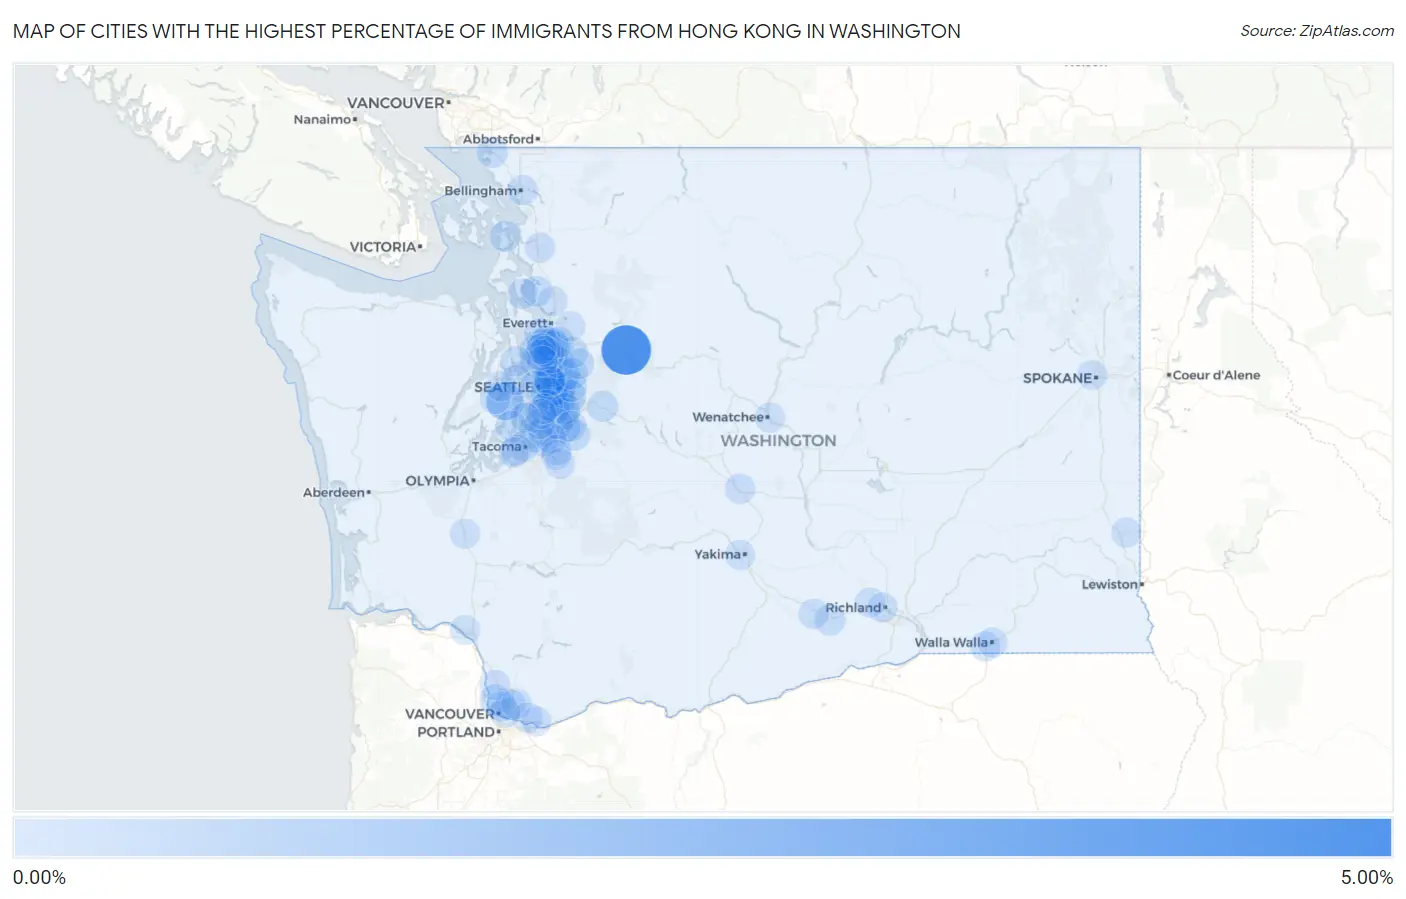
Map of Cities with the Highest Percentage of Immigrants from Hong Kong in Washington
0.00%
5.00%
Cities with the Highest Percentage of Immigrants from Hong Kong in Washington
| City | Hong Kong | vs State | vs National | |
| 1. | Index | 4.55% | 0.11%(+4.43)#1 | 0.072%(+4.47)#8 |
| 2. | East Port Orchard | 1.73% | 0.11%(+1.61)#2 | 0.072%(+1.65)#54 |
| 3. | Mercer Island | 1.25% | 0.11%(+1.14)#3 | 0.072%(+1.18)#96 |
| 4. | Newcastle | 1.13% | 0.11%(+1.01)#4 | 0.072%(+1.06)#114 |
| 5. | Bellevue | 0.86% | 0.11%(+0.748)#5 | 0.072%(+0.790)#167 |
| 6. | Medina | 0.79% | 0.11%(+0.673)#6 | 0.072%(+0.715)#184 |
| 7. | Fairwood Cdp King County | 0.78% | 0.11%(+0.665)#7 | 0.072%(+0.707)#189 |
| 8. | Covington | 0.67% | 0.11%(+0.554)#8 | 0.072%(+0.596)#213 |
| 9. | Normandy Park | 0.54% | 0.11%(+0.423)#9 | 0.072%(+0.465)#267 |
| 10. | Shoreline | 0.52% | 0.11%(+0.404)#10 | 0.072%(+0.446)#272 |
| 11. | Issaquah | 0.50% | 0.11%(+0.388)#11 | 0.072%(+0.430)#284 |
| 12. | Redmond | 0.49% | 0.11%(+0.375)#12 | 0.072%(+0.417)#291 |
| 13. | Renton | 0.48% | 0.11%(+0.362)#13 | 0.072%(+0.404)#307 |
| 14. | Mill Creek East | 0.45% | 0.11%(+0.336)#14 | 0.072%(+0.378)#328 |
| 15. | North Lynnwood | 0.43% | 0.11%(+0.315)#15 | 0.072%(+0.357)#358 |
| 16. | Mill Creek | 0.40% | 0.11%(+0.285)#16 | 0.072%(+0.327)#388 |
| 17. | Yarrow Point | 0.39% | 0.11%(+0.276)#17 | 0.072%(+0.318)#396 |
| 18. | Beaux Arts Village | 0.39% | 0.11%(+0.273)#18 | 0.072%(+0.315)#398 |
| 19. | Kenmore | 0.35% | 0.11%(+0.233)#19 | 0.072%(+0.275)#439 |
| 20. | Kirkland | 0.35% | 0.11%(+0.231)#20 | 0.072%(+0.273)#442 |
| 21. | Federal Way | 0.33% | 0.11%(+0.218)#21 | 0.072%(+0.260)#460 |
| 22. | Martha Lake | 0.32% | 0.11%(+0.208)#22 | 0.072%(+0.250)#473 |
| 23. | Maple Heights Lake Desire | 0.32% | 0.11%(+0.206)#23 | 0.072%(+0.248)#478 |
| 24. | Hunts Point | 0.31% | 0.11%(+0.195)#24 | 0.072%(+0.237)#491 |
| 25. | Mukilteo | 0.30% | 0.11%(+0.190)#25 | 0.072%(+0.232)#498 |
| 26. | East Renton Highlands | 0.28% | 0.11%(+0.167)#26 | 0.072%(+0.209)#524 |
| 27. | Woodinville | 0.28% | 0.11%(+0.164)#27 | 0.072%(+0.206)#529 |
| 28. | Bothell | 0.27% | 0.11%(+0.153)#28 | 0.072%(+0.195)#546 |
| 29. | Sammamish | 0.26% | 0.11%(+0.147)#29 | 0.072%(+0.189)#558 |
| 30. | Maplewood | 0.25% | 0.11%(+0.139)#30 | 0.072%(+0.181)#573 |
| 31. | Union Hill Novelty Hill | 0.25% | 0.11%(+0.136)#31 | 0.072%(+0.178)#583 |
| 32. | Seattle | 0.25% | 0.11%(+0.134)#32 | 0.072%(+0.176)#589 |
| 33. | High Bridge | 0.24% | 0.11%(+0.130)#33 | 0.072%(+0.172)#596 |
| 34. | North Bend | 0.24% | 0.11%(+0.124)#34 | 0.072%(+0.166)#618 |
| 35. | Black Diamond | 0.23% | 0.11%(+0.112)#35 | 0.072%(+0.154)#655 |
| 36. | Warm Beach | 0.22% | 0.11%(+0.108)#36 | 0.072%(+0.150)#664 |
| 37. | Lake Stickney | 0.21% | 0.11%(+0.097)#37 | 0.072%(+0.139)#689 |
| 38. | Duvall | 0.21% | 0.11%(+0.095)#38 | 0.072%(+0.137)#694 |
| 39. | Anacortes | 0.20% | 0.11%(+0.084)#39 | 0.072%(+0.126)#714 |
| 40. | Bothell West | 0.19% | 0.11%(+0.081)#40 | 0.072%(+0.123)#722 |
| 41. | Felida | 0.19% | 0.11%(+0.076)#41 | 0.072%(+0.118)#736 |
| 42. | Edmonds | 0.19% | 0.11%(+0.075)#42 | 0.072%(+0.117)#737 |
| 43. | Blaine | 0.19% | 0.11%(+0.073)#43 | 0.072%(+0.115)#741 |
| 44. | Prosser | 0.18% | 0.11%(+0.065)#44 | 0.072%(+0.107)#766 |
| 45. | Kent | 0.16% | 0.11%(+0.051)#45 | 0.072%(+0.093)#817 |
| 46. | Silver Firs | 0.16% | 0.11%(+0.048)#46 | 0.072%(+0.090)#829 |
| 47. | Clyde Hill | 0.16% | 0.11%(+0.047)#47 | 0.072%(+0.089)#833 |
| 48. | Mountlake Terrace | 0.15% | 0.11%(+0.036)#48 | 0.072%(+0.078)#880 |
| 49. | Lakeland South | 0.13% | 0.11%(+0.021)#49 | 0.072%(+0.063)#939 |
| 50. | Alderwood Manor | 0.13% | 0.11%(+0.019)#50 | 0.072%(+0.061)#946 |
| 51. | Maple Valley | 0.13% | 0.11%(+0.011)#51 | 0.072%(+0.053)#984 |
| 52. | Lakeland North | 0.11% | 0.11%(-0.001)#52 | 0.072%(+0.041)#1,043 |
| 53. | Fircrest | 0.11% | 0.11%(-0.002)#53 | 0.072%(+0.040)#1,049 |
| 54. | Lake Forest Park | 0.11% | 0.11%(-0.003)#54 | 0.072%(+0.039)#1,059 |
| 55. | Bryn Mawr Skyway | 0.11% | 0.11%(-0.003)#55 | 0.072%(+0.039)#1,062 |
| 56. | Five Corners | 0.11% | 0.11%(-0.004)#56 | 0.072%(+0.038)#1,065 |
| 57. | Bremerton | 0.11% | 0.11%(-0.007)#57 | 0.072%(+0.035)#1,078 |
| 58. | Lake Tapps | 0.11% | 0.11%(-0.008)#58 | 0.072%(+0.034)#1,080 |
| 59. | Camano | 0.10% | 0.11%(-0.012)#59 | 0.072%(+0.030)#1,109 |
| 60. | Auburn | 0.10% | 0.11%(-0.014)#60 | 0.072%(+0.028)#1,117 |
| 61. | Vancouver | 0.096% | 0.11%(-0.018)#61 | 0.072%(+0.024)#1,140 |
| 62. | Lynnwood | 0.095% | 0.11%(-0.019)#62 | 0.072%(+0.023)#1,146 |
| 63. | Des Moines | 0.089% | 0.11%(-0.025)#63 | 0.072%(+0.016)#1,177 |
| 64. | Prairie Ridge | 0.088% | 0.11%(-0.026)#64 | 0.072%(+0.016)#1,182 |
| 65. | Hazel Dell | 0.084% | 0.11%(-0.031)#65 | 0.072%(+0.011)#1,208 |
| 66. | Tukwila | 0.083% | 0.11%(-0.031)#66 | 0.072%(+0.011)#1,211 |
| 67. | Ridgefield | 0.078% | 0.11%(-0.036)#67 | 0.072%(+0.006)#1,249 |
| 68. | Bellingham | 0.076% | 0.11%(-0.039)#68 | 0.072%(+0.003)#1,265 |
| 69. | Bainbridge Island | 0.073% | 0.11%(-0.041)#69 | 0.072%(+0.001)#1,282 |
| 70. | Orchards | 0.068% | 0.11%(-0.046)#70 | 0.072%(-0.004)#1,313 |
| 71. | Ellensburg | 0.063% | 0.11%(-0.051)#71 | 0.072%(-0.009)#1,356 |
| 72. | Camas | 0.057% | 0.11%(-0.057)#72 | 0.072%(-0.015)#1,417 |
| 73. | Indianola | 0.056% | 0.11%(-0.058)#73 | 0.072%(-0.016)#1,422 |
| 74. | Grandview | 0.055% | 0.11%(-0.059)#74 | 0.072%(-0.017)#1,434 |
| 75. | Tracyton | 0.053% | 0.11%(-0.061)#75 | 0.072%(-0.019)#1,447 |
| 76. | College Place | 0.051% | 0.11%(-0.063)#76 | 0.072%(-0.021)#1,458 |
| 77. | Mount Vernon | 0.040% | 0.11%(-0.074)#77 | 0.072%(-0.032)#1,559 |
| 78. | Washougal | 0.036% | 0.11%(-0.079)#78 | 0.072%(-0.037)#1,613 |
| 79. | East Wenatchee | 0.028% | 0.11%(-0.086)#79 | 0.072%(-0.044)#1,705 |
| 80. | Seatac | 0.026% | 0.11%(-0.088)#80 | 0.072%(-0.046)#1,740 |
| 81. | Tacoma | 0.024% | 0.11%(-0.090)#81 | 0.072%(-0.048)#1,761 |
| 82. | Walla Walla | 0.024% | 0.11%(-0.091)#82 | 0.072%(-0.049)#1,766 |
| 83. | University Place | 0.023% | 0.11%(-0.091)#83 | 0.072%(-0.049)#1,771 |
| 84. | Pullman | 0.022% | 0.11%(-0.092)#84 | 0.072%(-0.050)#1,790 |
| 85. | Everett | 0.021% | 0.11%(-0.094)#85 | 0.072%(-0.052)#1,799 |
| 86. | Centralia | 0.016% | 0.11%(-0.098)#86 | 0.072%(-0.056)#1,862 |
| 87. | Longview | 0.016% | 0.11%(-0.098)#87 | 0.072%(-0.056)#1,872 |
| 88. | Yakima | 0.016% | 0.11%(-0.099)#88 | 0.072%(-0.057)#1,878 |
| 89. | Bonney Lake | 0.013% | 0.11%(-0.101)#89 | 0.072%(-0.059)#1,917 |
| 90. | West Richland | 0.012% | 0.11%(-0.102)#90 | 0.072%(-0.060)#1,935 |
| 91. | Marysville | 0.011% | 0.11%(-0.103)#91 | 0.072%(-0.061)#1,948 |
| 92. | Spokane | 0.010% | 0.11%(-0.104)#92 | 0.072%(-0.062)#1,958 |
| 93. | Richland | 0.0099% | 0.11%(-0.104)#93 | 0.072%(-0.062)#1,960 |
| 94. | Vashon | 0.0091% | 0.11%(-0.105)#94 | 0.072%(-0.063)#1,966 |
Common Questions
What are the Top 10 Cities with the Highest Percentage of Immigrants from Hong Kong in Washington?
Top 10 Cities with the Highest Percentage of Immigrants from Hong Kong in Washington are:
#1
4.55%
#2
1.73%
#3
1.25%
#4
1.13%
#5
0.86%
#6
0.79%
#7
0.67%
#8
0.54%
#9
0.52%
#10
0.50%
What city has the Highest Percentage of Immigrants from Hong Kong in Washington?
Index has the Highest Percentage of Immigrants from Hong Kong in Washington with 4.55%.
What is the Percentage of Immigrants from Hong Kong in the State of Washington?
Percentage of Immigrants from Hong Kong in Washington is 0.11%.
What is the Percentage of Immigrants from Hong Kong in the United States?
Percentage of Immigrants from Hong Kong in the United States is 0.072%.