Aberdeen, WA Map & Demographics
Aberdeen Map
Aberdeen Overview
$28,210
PER CAPITA INCOME
$63,563
AVG FAMILY INCOME
$50,008
AVG HOUSEHOLD INCOME
24.3%
WAGE / INCOME GAP [ % ]
75.7¢/ $1
WAGE / INCOME GAP [ $ ]
$11,400
FAMILY INCOME DEFICIT
0.48
INEQUALITY / GINI INDEX
16,969
TOTAL POPULATION
8,529
MALE POPULATION
8,440
FEMALE POPULATION
101.05
MALES / 100 FEMALES
98.96
FEMALES / 100 MALES
37.1
MEDIAN AGE
3.4
AVG FAMILY SIZE
2.6
AVG HOUSEHOLD SIZE
7,199
LABOR FORCE [ PEOPLE ]
54.8%
PERCENT IN LABOR FORCE
6.3%
UNEMPLOYMENT RATE
Aberdeen Zip Codes
Aberdeen Area Codes
Income in Aberdeen
Income Overview in Aberdeen
Per Capita Income in Aberdeen is $28,210, while median incomes of families and households are $63,563 and $50,008 respectively.
| Characteristic | Number | Measure |
| Per Capita Income | 16,969 | $28,210 |
| Median Family Income | 3,646 | $63,563 |
| Mean Family Income | 3,646 | $87,143 |
| Median Household Income | 6,441 | $50,008 |
| Mean Household Income | 6,441 | $69,732 |
| Income Deficit | 3,646 | $11,400 |
| Wage / Income Gap (%) | 16,969 | 24.26% |
| Wage / Income Gap ($) | 16,969 | 75.74¢ per $1 |
| Gini / Inequality Index | 16,969 | 0.48 |
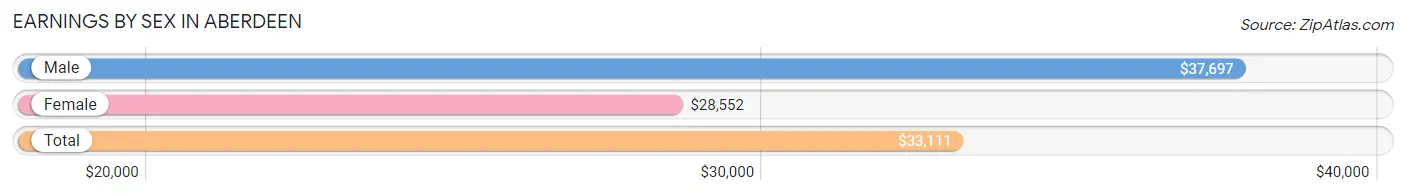
Earnings by Sex in Aberdeen
Average Earnings in Aberdeen are $33,111, $37,697 for men and $28,552 for women, a difference of 24.3%.
| Sex | Number | Average Earnings |
| Male | 4,091 (53.7%) | $37,697 |
| Female | 3,527 (46.3%) | $28,552 |
| Total | 7,618 (100.0%) | $33,111 |
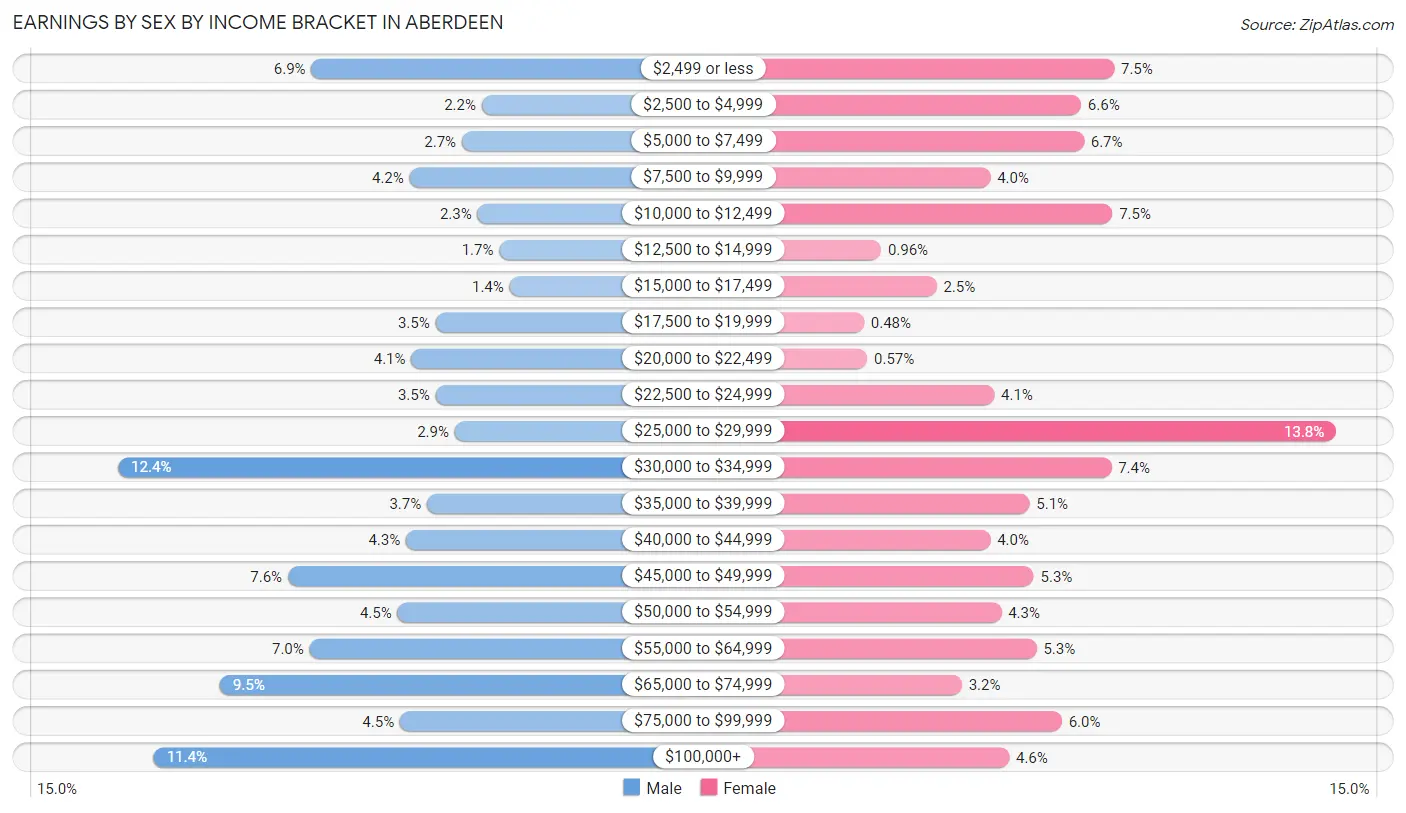
Earnings by Sex by Income Bracket in Aberdeen
The most common earnings brackets in Aberdeen are $30,000 to $34,999 for men (506 | 12.4%) and $25,000 to $29,999 for women (485 | 13.8%).
| Income | Male | Female |
| $2,499 or less | 284 (6.9%) | 265 (7.5%) |
| $2,500 to $4,999 | 88 (2.1%) | 232 (6.6%) |
| $5,000 to $7,499 | 111 (2.7%) | 235 (6.7%) |
| $7,500 to $9,999 | 171 (4.2%) | 142 (4.0%) |
| $10,000 to $12,499 | 93 (2.3%) | 263 (7.5%) |
| $12,500 to $14,999 | 68 (1.7%) | 34 (1.0%) |
| $15,000 to $17,499 | 56 (1.4%) | 89 (2.5%) |
| $17,500 to $19,999 | 141 (3.5%) | 17 (0.5%) |
| $20,000 to $22,499 | 169 (4.1%) | 20 (0.6%) |
| $22,500 to $24,999 | 141 (3.5%) | 146 (4.1%) |
| $25,000 to $29,999 | 119 (2.9%) | 485 (13.8%) |
| $30,000 to $34,999 | 506 (12.4%) | 262 (7.4%) |
| $35,000 to $39,999 | 151 (3.7%) | 181 (5.1%) |
| $40,000 to $44,999 | 175 (4.3%) | 142 (4.0%) |
| $45,000 to $49,999 | 311 (7.6%) | 185 (5.2%) |
| $50,000 to $54,999 | 185 (4.5%) | 153 (4.3%) |
| $55,000 to $64,999 | 286 (7.0%) | 188 (5.3%) |
| $65,000 to $74,999 | 389 (9.5%) | 114 (3.2%) |
| $75,000 to $99,999 | 182 (4.4%) | 213 (6.0%) |
| $100,000+ | 465 (11.4%) | 161 (4.6%) |
| Total | 4,091 (100.0%) | 3,527 (100.0%) |
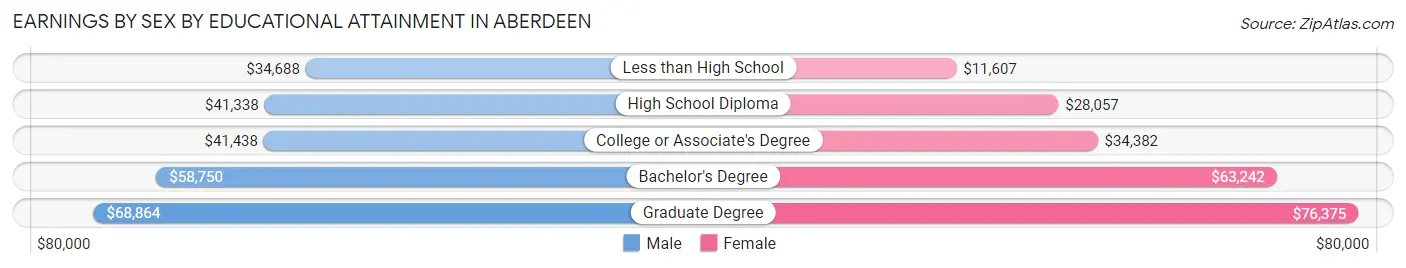
Earnings by Sex by Educational Attainment in Aberdeen
Average earnings in Aberdeen are $44,050 for men and $32,663 for women, a difference of 25.9%. Men with an educational attainment of graduate degree enjoy the highest average annual earnings of $68,864, while those with less than high school education earn the least with $34,688. Women with an educational attainment of graduate degree earn the most with the average annual earnings of $76,375, while those with less than high school education have the smallest earnings of $11,607.
| Educational Attainment | Male Income | Female Income |
| Less than High School | $34,688 | $11,607 |
| High School Diploma | $41,338 | $28,057 |
| College or Associate's Degree | $41,438 | $34,382 |
| Bachelor's Degree | $58,750 | $63,242 |
| Graduate Degree | $68,864 | $76,375 |
| Total | $44,050 | $32,663 |
Family Income in Aberdeen
Family Income Brackets in Aberdeen
According to the Aberdeen family income data, there are 922 families falling into the $50,000 to $74,999 income range, which is the most common income bracket and makes up 25.3% of all families. Conversely, the $10,000 to $14,999 income bracket is the least frequent group with only 88 families (2.4%) belonging to this category.
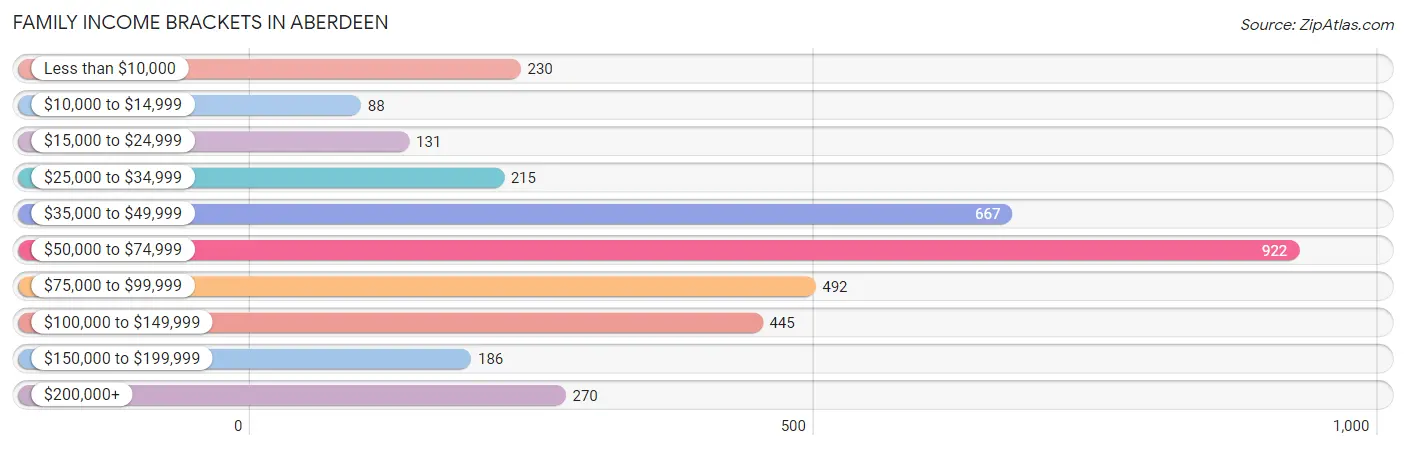
| Income Bracket | # Families | % Families |
| Less than $10,000 | 230 | 6.3% |
| $10,000 to $14,999 | 88 | 2.4% |
| $15,000 to $24,999 | 131 | 3.6% |
| $25,000 to $34,999 | 215 | 5.9% |
| $35,000 to $49,999 | 667 | 18.3% |
| $50,000 to $74,999 | 922 | 25.3% |
| $75,000 to $99,999 | 492 | 13.5% |
| $100,000 to $149,999 | 445 | 12.2% |
| $150,000 to $199,999 | 186 | 5.1% |
| $200,000+ | 270 | 7.4% |
Family Income by Famaliy Size in Aberdeen
5-person families (259 | 7.1%) account for the highest median family income in Aberdeen with $101,375 per family, while 2-person families (1,615 | 44.3%) have the highest median income of $27,007 per family member.
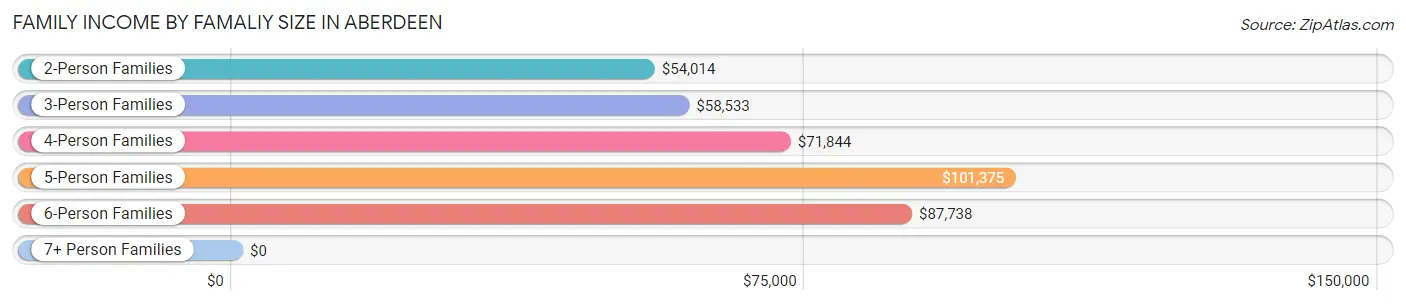
| Income Bracket | # Families | Median Income |
| 2-Person Families | 1,615 (44.3%) | $54,014 |
| 3-Person Families | 865 (23.7%) | $58,533 |
| 4-Person Families | 647 (17.7%) | $71,844 |
| 5-Person Families | 259 (7.1%) | $101,375 |
| 6-Person Families | 180 (4.9%) | $87,738 |
| 7+ Person Families | 80 (2.2%) | $0 |
| Total | 3,646 (100.0%) | $63,563 |
Family Income by Number of Earners in Aberdeen
The median family income in Aberdeen is $63,563, with families comprising 3+ earners (491) having the highest median family income of $109,821, while families with no earners (722) have the lowest median family income of $39,085, accounting for 13.5% and 19.8% of families, respectively.
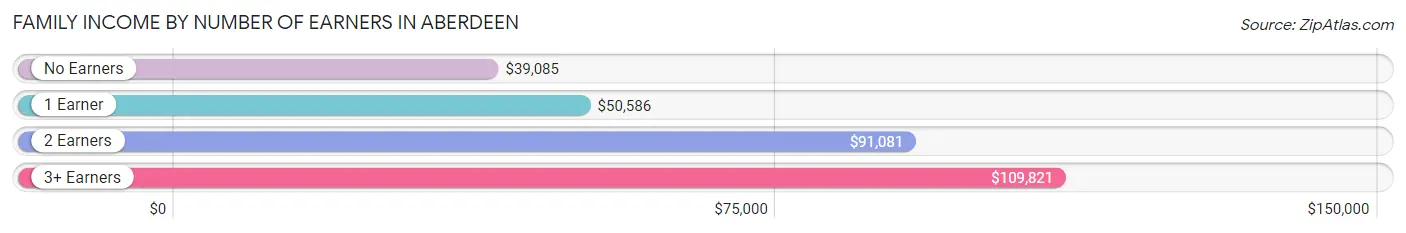
| Number of Earners | # Families | Median Income |
| No Earners | 722 (19.8%) | $39,085 |
| 1 Earner | 1,398 (38.3%) | $50,586 |
| 2 Earners | 1,035 (28.4%) | $91,081 |
| 3+ Earners | 491 (13.5%) | $109,821 |
| Total | 3,646 (100.0%) | $63,563 |
Household Income in Aberdeen
Household Income Brackets in Aberdeen
With 1,359 households falling in the category, the $50,000 to $74,999 income range is the most frequent in Aberdeen, accounting for 21.1% of all households. In contrast, only 290 households (4.5%) fall into the $200,000+ income bracket, making it the least populous group.
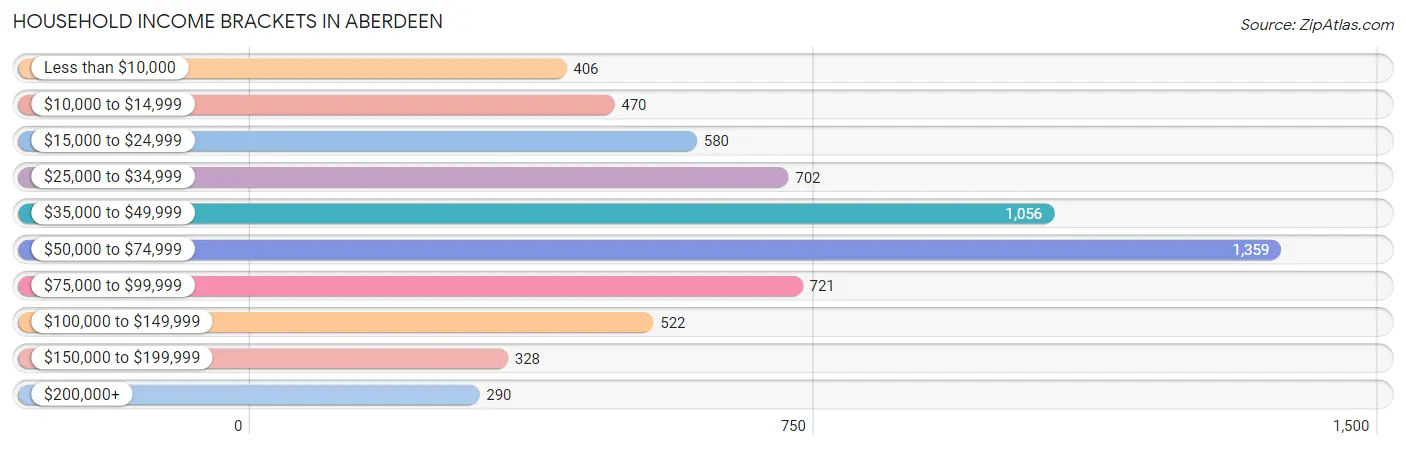
| Income Bracket | # Households | % Households |
| Less than $10,000 | 406 | 6.3% |
| $10,000 to $14,999 | 470 | 7.3% |
| $15,000 to $24,999 | 580 | 9.0% |
| $25,000 to $34,999 | 702 | 10.9% |
| $35,000 to $49,999 | 1,056 | 16.4% |
| $50,000 to $74,999 | 1,359 | 21.1% |
| $75,000 to $99,999 | 721 | 11.2% |
| $100,000 to $149,999 | 522 | 8.1% |
| $150,000 to $199,999 | 328 | 5.1% |
| $200,000+ | 290 | 4.5% |
Household Income by Householder Age in Aberdeen
The median household income in Aberdeen is $50,008, with the highest median household income of $56,957 found in the 25 to 44 years age bracket for the primary householder. A total of 2,246 households (34.9%) fall into this category. Meanwhile, the 65+ years age bracket for the primary householder has the lowest median household income of $38,865, with 1,962 households (30.5%) in this group.
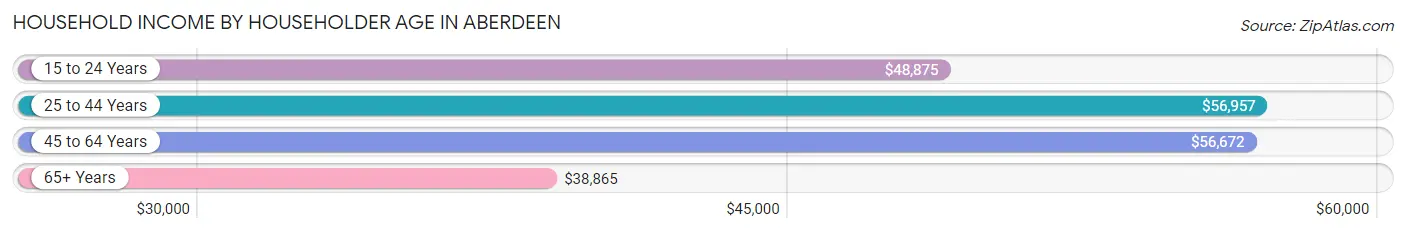
| Income Bracket | # Households | Median Income |
| 15 to 24 Years | 250 (3.9%) | $48,875 |
| 25 to 44 Years | 2,246 (34.9%) | $56,957 |
| 45 to 64 Years | 1,983 (30.8%) | $56,672 |
| 65+ Years | 1,962 (30.5%) | $38,865 |
| Total | 6,441 (100.0%) | $50,008 |
Poverty in Aberdeen
Income Below Poverty by Sex and Age in Aberdeen
With 20.3% poverty level for males and 21.6% for females among the residents of Aberdeen, 16 and 17 year old males and 15 year old females are the most vulnerable to poverty, with 197 males (66.5%) and 122 females (72.2%) in their respective age groups living below the poverty level.
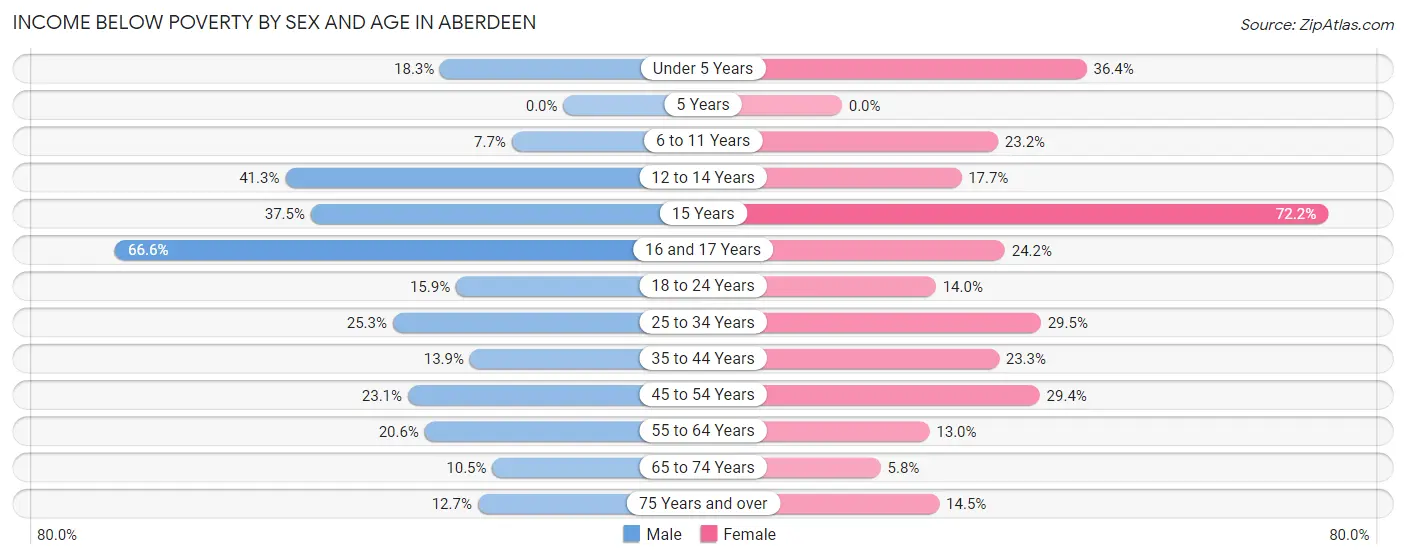
| Age Bracket | Male | Female |
| Under 5 Years | 69 (18.3%) | 229 (36.3%) |
| 5 Years | 0 (0.0%) | 0 (0.0%) |
| 6 to 11 Years | 56 (7.7%) | 162 (23.2%) |
| 12 to 14 Years | 197 (41.3%) | 53 (17.7%) |
| 15 Years | 66 (37.5%) | 122 (72.2%) |
| 16 and 17 Years | 197 (66.5%) | 69 (24.2%) |
| 18 to 24 Years | 120 (15.9%) | 96 (14.0%) |
| 25 to 34 Years | 268 (25.3%) | 252 (29.5%) |
| 35 to 44 Years | 198 (13.9%) | 287 (23.3%) |
| 45 to 54 Years | 215 (23.1%) | 245 (29.4%) |
| 55 to 64 Years | 180 (20.6%) | 114 (13.0%) |
| 65 to 74 Years | 76 (10.5%) | 54 (5.8%) |
| 75 Years and over | 60 (12.7%) | 108 (14.5%) |
| Total | 1,702 (20.3%) | 1,791 (21.6%) |
Income Above Poverty by Sex and Age in Aberdeen
According to the poverty statistics in Aberdeen, males aged 5 years and females aged 5 years are the age groups that are most secure financially, with 100.0% of males and 100.0% of females in these age groups living above the poverty line.
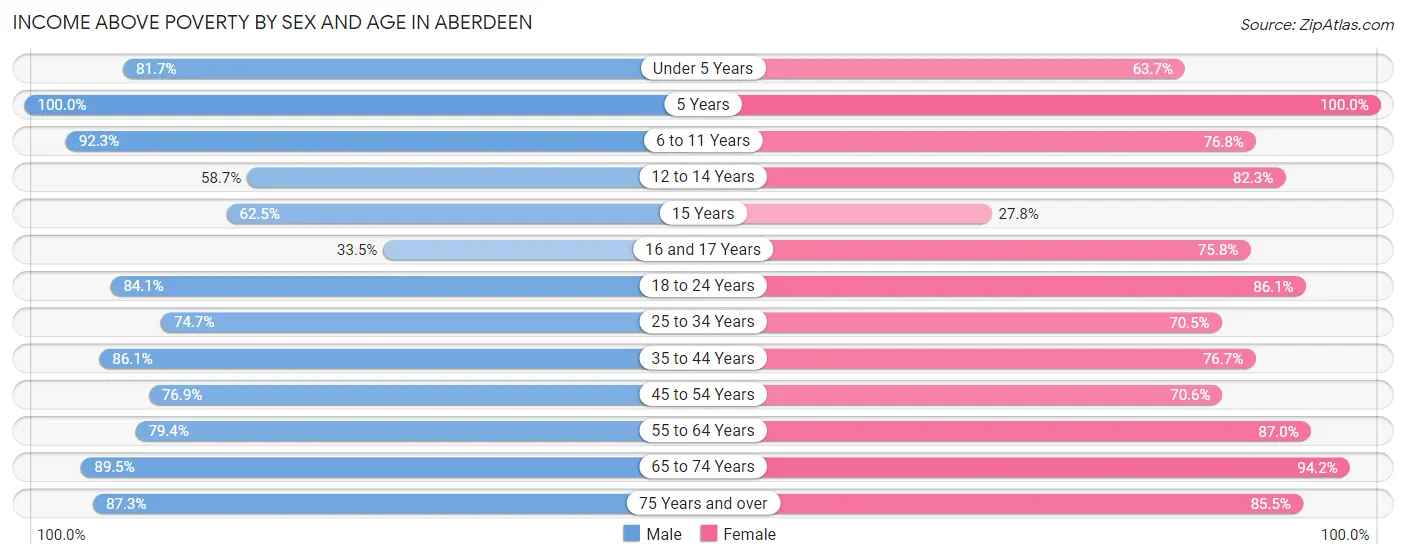
| Age Bracket | Male | Female |
| Under 5 Years | 308 (81.7%) | 401 (63.6%) |
| 5 Years | 87 (100.0%) | 37 (100.0%) |
| 6 to 11 Years | 674 (92.3%) | 537 (76.8%) |
| 12 to 14 Years | 280 (58.7%) | 246 (82.3%) |
| 15 Years | 110 (62.5%) | 47 (27.8%) |
| 16 and 17 Years | 99 (33.5%) | 216 (75.8%) |
| 18 to 24 Years | 633 (84.1%) | 592 (86.1%) |
| 25 to 34 Years | 790 (74.7%) | 601 (70.5%) |
| 35 to 44 Years | 1,227 (86.1%) | 944 (76.7%) |
| 45 to 54 Years | 716 (76.9%) | 589 (70.6%) |
| 55 to 64 Years | 694 (79.4%) | 763 (87.0%) |
| 65 to 74 Years | 645 (89.5%) | 884 (94.2%) |
| 75 Years and over | 412 (87.3%) | 639 (85.5%) |
| Total | 6,675 (79.7%) | 6,496 (78.4%) |
Income Below Poverty Among Married-Couple Families in Aberdeen
The poverty statistics for married-couple families in Aberdeen show that 6.7% or 153 of the total 2,302 families live below the poverty line. Families with 5 or more children have the highest poverty rate of 100.0%, comprising of 24 families. On the other hand, families with 3 or 4 children have the lowest poverty rate of 1.7%, which includes 6 families.
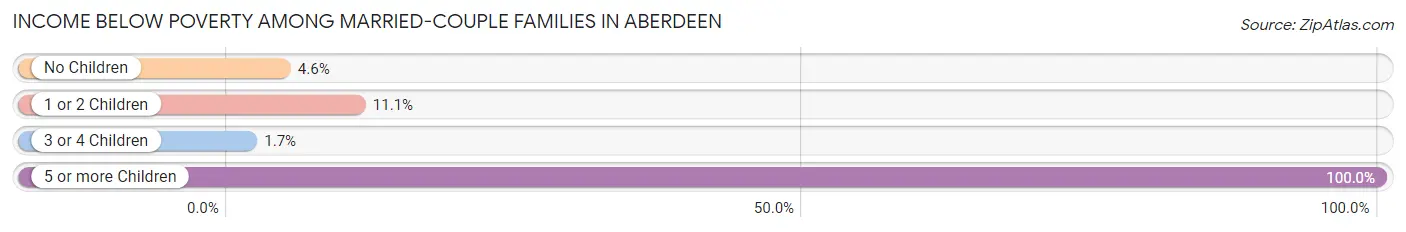
| Children | Above Poverty | Below Poverty |
| No Children | 1,327 (95.4%) | 64 (4.6%) |
| 1 or 2 Children | 471 (88.9%) | 59 (11.1%) |
| 3 or 4 Children | 351 (98.3%) | 6 (1.7%) |
| 5 or more Children | 0 (0.0%) | 24 (100.0%) |
| Total | 2,149 (93.3%) | 153 (6.7%) |
Income Below Poverty Among Single-Parent Households in Aberdeen
According to the poverty data in Aberdeen, 20.2% or 114 single-father households and 30.9% or 241 single-mother households are living below the poverty line. Among single-father households, those with 5 or more children have the highest poverty rate, with 19 households (100.0%) experiencing poverty. Likewise, among single-mother households, those with 3 or 4 children have the highest poverty rate, with 73 households (58.4%) falling below the poverty line.
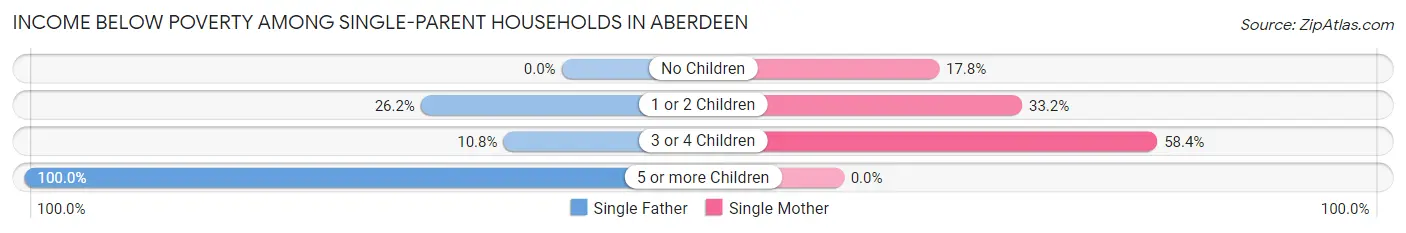
| Children | Single Father | Single Mother |
| No Children | 0 (0.0%) | 57 (17.8%) |
| 1 or 2 Children | 86 (26.2%) | 111 (33.2%) |
| 3 or 4 Children | 9 (10.8%) | 73 (58.4%) |
| 5 or more Children | 19 (100.0%) | 0 (0.0%) |
| Total | 114 (20.2%) | 241 (30.9%) |
Income Below Poverty Among Married-Couple vs Single-Parent Households in Aberdeen
The poverty data for Aberdeen shows that 153 of the married-couple family households (6.7%) and 355 of the single-parent households (26.4%) are living below the poverty level. Within the married-couple family households, those with 5 or more children have the highest poverty rate, with 24 households (100.0%) falling below the poverty line. Among the single-parent households, those with 5 or more children have the highest poverty rate, with 19 household (100.0%) living below poverty.
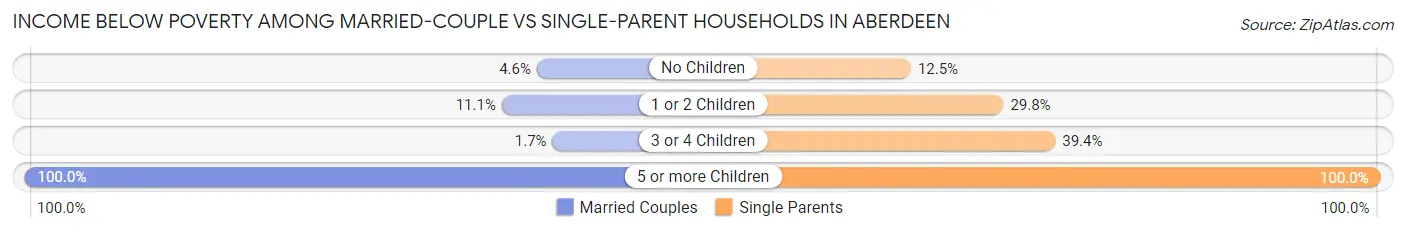
| Children | Married-Couple Families | Single-Parent Households |
| No Children | 64 (4.6%) | 57 (12.5%) |
| 1 or 2 Children | 59 (11.1%) | 197 (29.8%) |
| 3 or 4 Children | 6 (1.7%) | 82 (39.4%) |
| 5 or more Children | 24 (100.0%) | 19 (100.0%) |
| Total | 153 (6.7%) | 355 (26.4%) |
Race in Aberdeen
The most populous races in Aberdeen are White / Caucasian (13,119 | 77.3%), Hispanic or Latino (3,637 | 21.4%), and Two or more Races (2,084 | 12.3%).
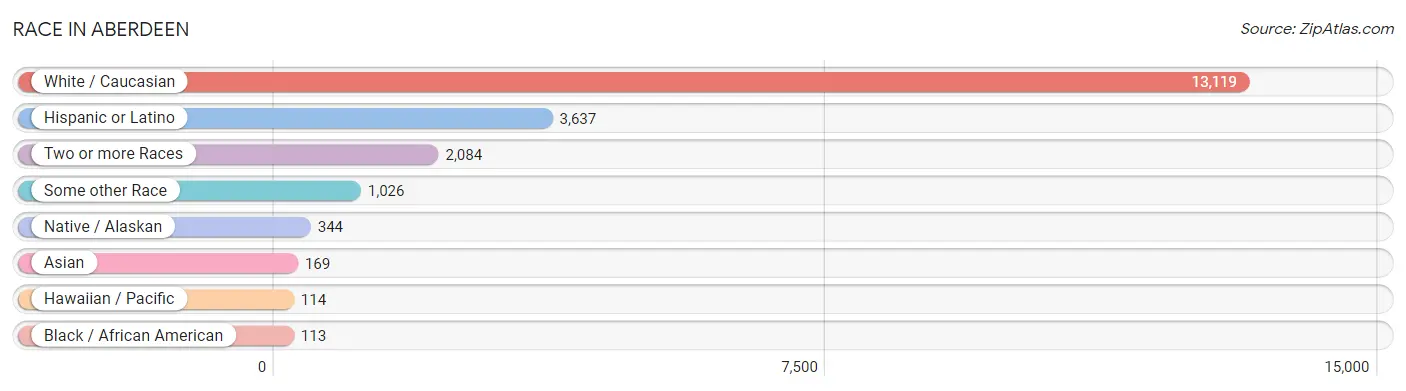
| Race | # Population | % Population |
| Asian | 169 | 1.0% |
| Black / African American | 113 | 0.7% |
| Hawaiian / Pacific | 114 | 0.7% |
| Hispanic or Latino | 3,637 | 21.4% |
| Native / Alaskan | 344 | 2.0% |
| White / Caucasian | 13,119 | 77.3% |
| Two or more Races | 2,084 | 12.3% |
| Some other Race | 1,026 | 6.0% |
| Total | 16,969 | 100.0% |
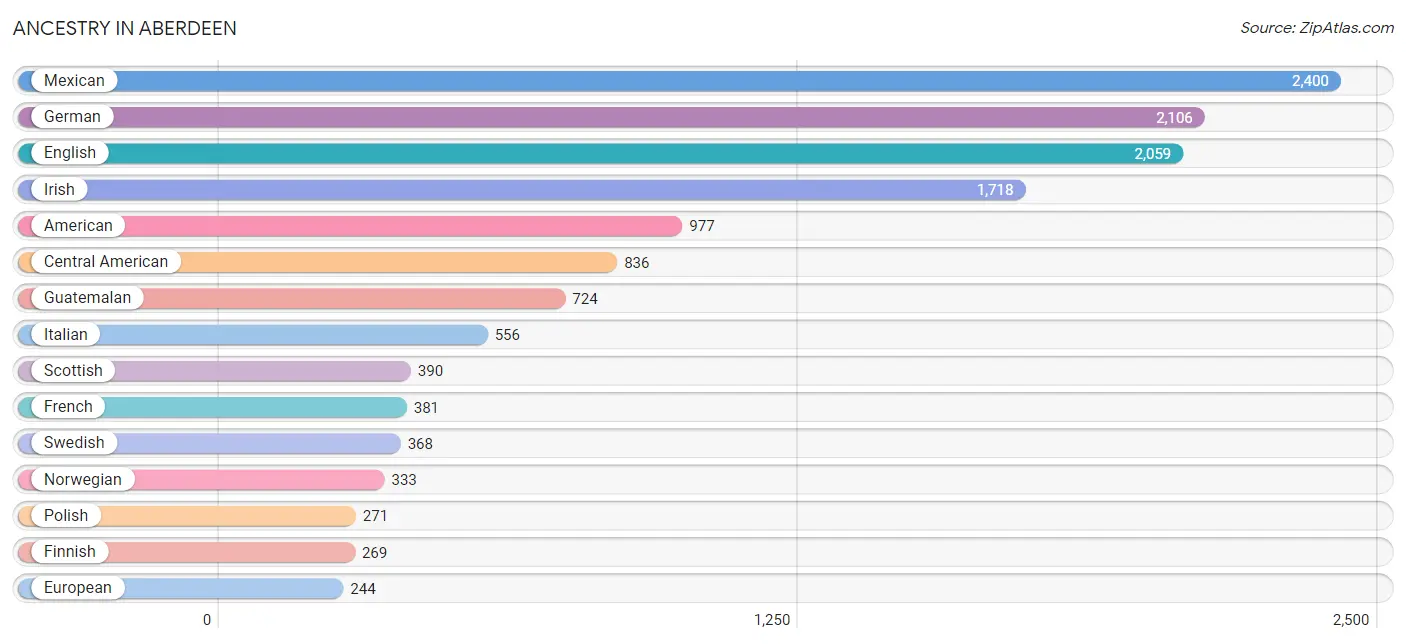
Ancestry in Aberdeen
The most populous ancestries reported in Aberdeen are Mexican (2,400 | 14.1%), German (2,106 | 12.4%), English (2,059 | 12.1%), Irish (1,718 | 10.1%), and American (977 | 5.8%), together accounting for 54.6% of all Aberdeen residents.
| Ancestry | # Population | % Population |
| Aleut | 9 | 0.1% |
| American | 977 | 5.8% |
| Arab | 31 | 0.2% |
| Austrian | 18 | 0.1% |
| Blackfeet | 24 | 0.1% |
| British | 148 | 0.9% |
| Burmese | 26 | 0.2% |
| Cambodian | 36 | 0.2% |
| Canadian | 21 | 0.1% |
| Central American | 836 | 4.9% |
| Cherokee | 90 | 0.5% |
| Choctaw | 26 | 0.2% |
| Croatian | 45 | 0.3% |
| Czech | 6 | 0.0% |
| Danish | 71 | 0.4% |
| Dutch | 112 | 0.7% |
| Eastern European | 65 | 0.4% |
| Ecuadorian | 7 | 0.0% |
| English | 2,059 | 12.1% |
| European | 244 | 1.4% |
| Finnish | 269 | 1.6% |
| French | 381 | 2.2% |
| French Canadian | 122 | 0.7% |
| German | 2,106 | 12.4% |
| Guamanian / Chamorro | 17 | 0.1% |
| Guatemalan | 724 | 4.3% |
| Hungarian | 20 | 0.1% |
| Indian (Asian) | 7 | 0.0% |
| Inupiat | 19 | 0.1% |
| Iraqi | 31 | 0.2% |
| Irish | 1,718 | 10.1% |
| Italian | 556 | 3.3% |
| Japanese | 51 | 0.3% |
| Korean | 100 | 0.6% |
| Malaysian | 19 | 0.1% |
| Mexican | 2,400 | 14.1% |
| Mexican American Indian | 32 | 0.2% |
| Native Hawaiian | 66 | 0.4% |
| Nicaraguan | 9 | 0.1% |
| Northern European | 9 | 0.1% |
| Norwegian | 333 | 2.0% |
| Pakistani | 100 | 0.6% |
| Pennsylvania German | 8 | 0.1% |
| Polish | 271 | 1.6% |
| Portuguese | 3 | 0.0% |
| Puerto Rican | 35 | 0.2% |
| Puget Sound Salish | 7 | 0.0% |
| Russian | 36 | 0.2% |
| Salvadoran | 103 | 0.6% |
| Samoan | 43 | 0.3% |
| Scandinavian | 121 | 0.7% |
| Scotch-Irish | 231 | 1.4% |
| Scottish | 390 | 2.3% |
| Serbian | 6 | 0.0% |
| Sioux | 58 | 0.3% |
| Slavic | 8 | 0.1% |
| South American | 7 | 0.0% |
| Spaniard | 19 | 0.1% |
| Spanish | 26 | 0.2% |
| Sri Lankan | 113 | 0.7% |
| Swedish | 368 | 2.2% |
| Swiss | 19 | 0.1% |
| Thai | 31 | 0.2% |
| Tlingit-Haida | 9 | 0.1% |
| Tongan | 42 | 0.3% |
| Welsh | 78 | 0.5% |
| Yakama | 26 | 0.2% | View All 67 Rows |
Immigrants in Aberdeen
The most numerous immigrant groups reported in Aberdeen came from Central America (1,104 | 6.5%), Latin America (1,104 | 6.5%), Mexico (736 | 4.3%), Guatemala (330 | 1.9%), and Asia (203 | 1.2%), together accounting for 20.5% of all Aberdeen residents.
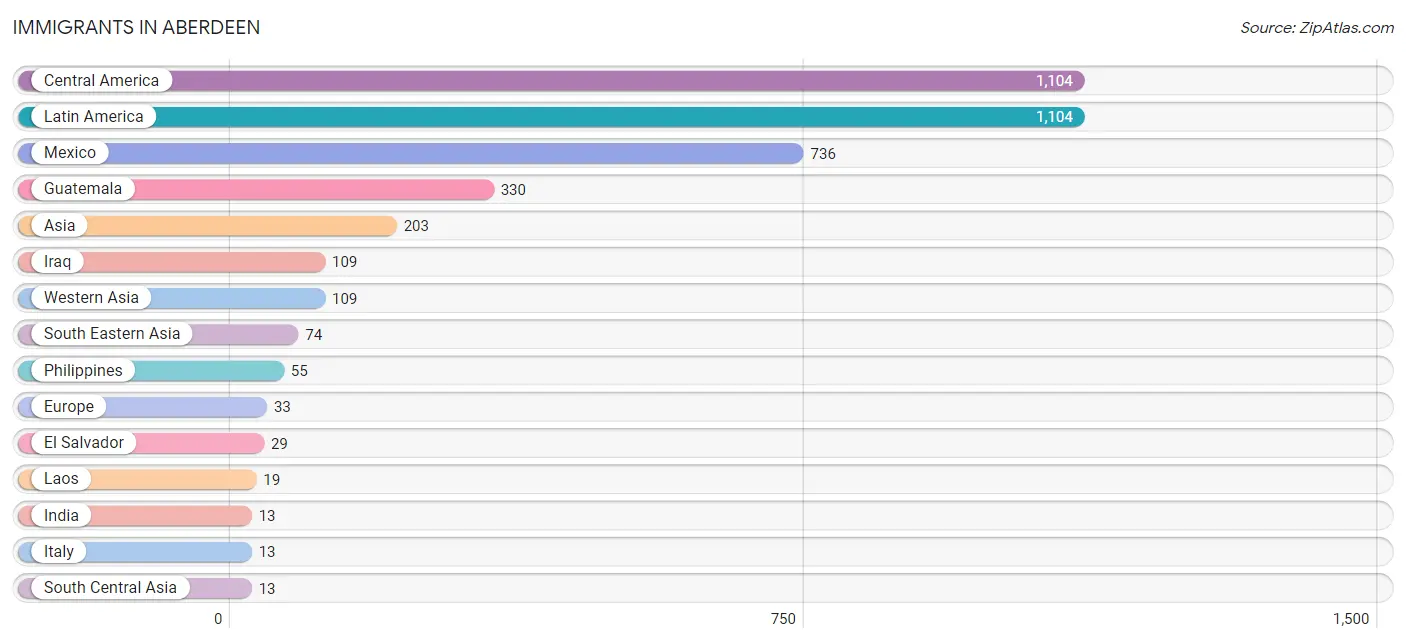
| Immigration Origin | # Population | % Population |
| Asia | 203 | 1.2% |
| Canada | 8 | 0.1% |
| Central America | 1,104 | 6.5% |
| China | 7 | 0.0% |
| Eastern Asia | 7 | 0.0% |
| Eastern Europe | 11 | 0.1% |
| El Salvador | 29 | 0.2% |
| Europe | 33 | 0.2% |
| Guatemala | 330 | 1.9% |
| Hungary | 11 | 0.1% |
| India | 13 | 0.1% |
| Iraq | 109 | 0.6% |
| Italy | 13 | 0.1% |
| Laos | 19 | 0.1% |
| Latin America | 1,104 | 6.5% |
| Mexico | 736 | 4.3% |
| Nicaragua | 9 | 0.1% |
| Northern Europe | 9 | 0.1% |
| Philippines | 55 | 0.3% |
| South Central Asia | 13 | 0.1% |
| South Eastern Asia | 74 | 0.4% |
| Southern Europe | 13 | 0.1% |
| Western Asia | 109 | 0.6% | View All 23 Rows |
Sex and Age in Aberdeen
Sex and Age in Aberdeen
The most populous age groups in Aberdeen are 10 to 14 Years (832 | 9.8%) for men and 15 to 19 Years (830 | 9.8%) for women.
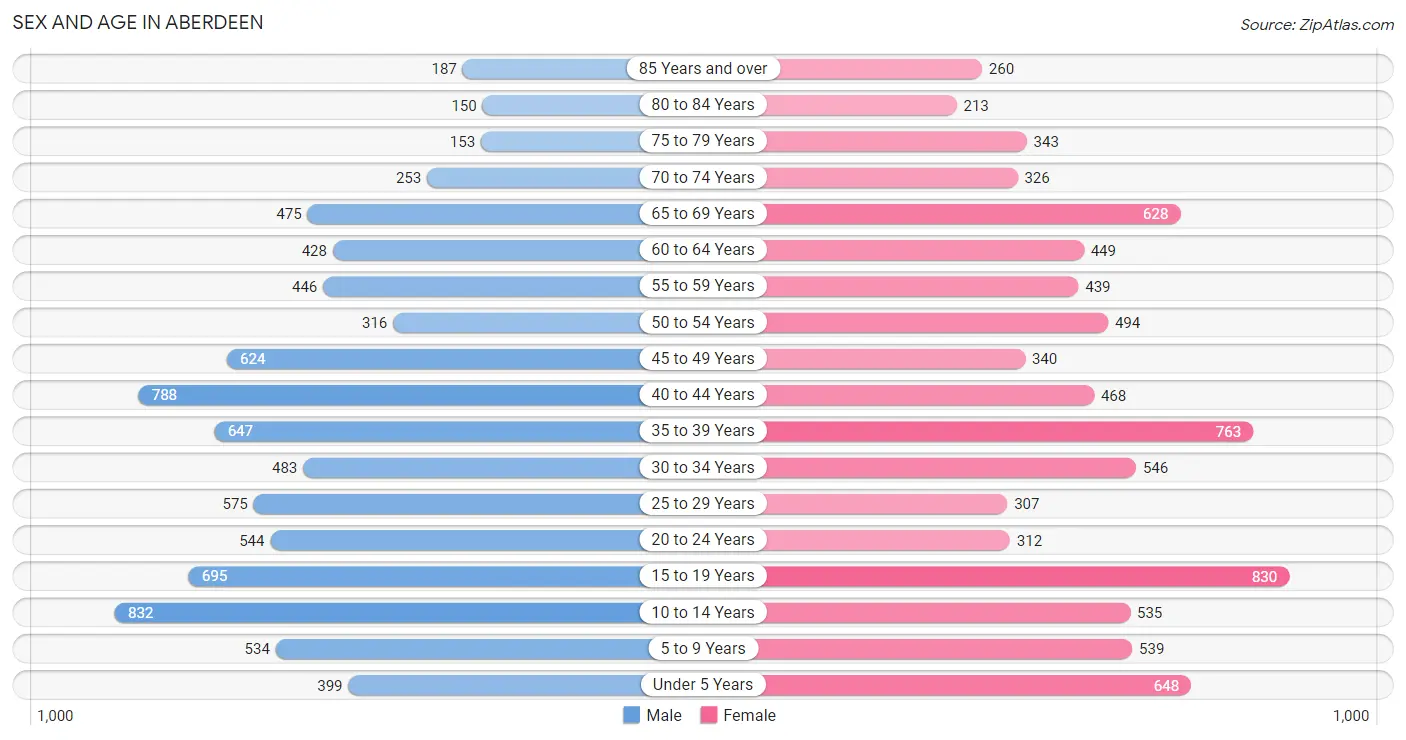
| Age Bracket | Male | Female |
| Under 5 Years | 399 (4.7%) | 648 (7.7%) |
| 5 to 9 Years | 534 (6.3%) | 539 (6.4%) |
| 10 to 14 Years | 832 (9.8%) | 535 (6.3%) |
| 15 to 19 Years | 695 (8.2%) | 830 (9.8%) |
| 20 to 24 Years | 544 (6.4%) | 312 (3.7%) |
| 25 to 29 Years | 575 (6.7%) | 307 (3.6%) |
| 30 to 34 Years | 483 (5.7%) | 546 (6.5%) |
| 35 to 39 Years | 647 (7.6%) | 763 (9.0%) |
| 40 to 44 Years | 788 (9.2%) | 468 (5.6%) |
| 45 to 49 Years | 624 (7.3%) | 340 (4.0%) |
| 50 to 54 Years | 316 (3.7%) | 494 (5.9%) |
| 55 to 59 Years | 446 (5.2%) | 439 (5.2%) |
| 60 to 64 Years | 428 (5.0%) | 449 (5.3%) |
| 65 to 69 Years | 475 (5.6%) | 628 (7.4%) |
| 70 to 74 Years | 253 (3.0%) | 326 (3.9%) |
| 75 to 79 Years | 153 (1.8%) | 343 (4.1%) |
| 80 to 84 Years | 150 (1.8%) | 213 (2.5%) |
| 85 Years and over | 187 (2.2%) | 260 (3.1%) |
| Total | 8,529 (100.0%) | 8,440 (100.0%) |
Families and Households in Aberdeen
Median Family Size in Aberdeen
The median family size in Aberdeen is 3.37 persons per family, with married-couple families (2,302 | 63.1%) accounting for the largest median family size of 3.5 persons per family. On the other hand, single male/father families (564 | 15.5%) represent the smallest median family size with 3.03 persons per family.
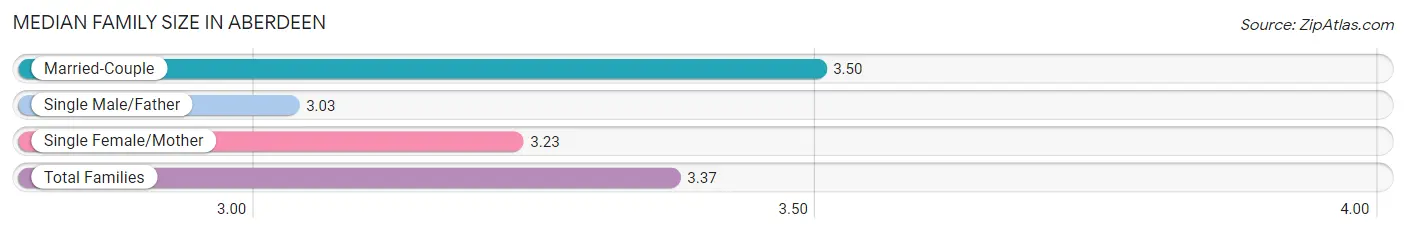
| Family Type | # Families | Family Size |
| Married-Couple | 2,302 (63.1%) | 3.50 |
| Single Male/Father | 564 (15.5%) | 3.03 |
| Single Female/Mother | 780 (21.4%) | 3.23 |
| Total Families | 3,646 (100.0%) | 3.37 |
Median Household Size in Aberdeen
The median household size in Aberdeen is 2.59 persons per household, with single male/father households (564 | 8.8%) accounting for the largest median household size of 3.66 persons per household. non-family households (2,795 | 43.4%) represent the smallest median household size with 1.28 persons per household.
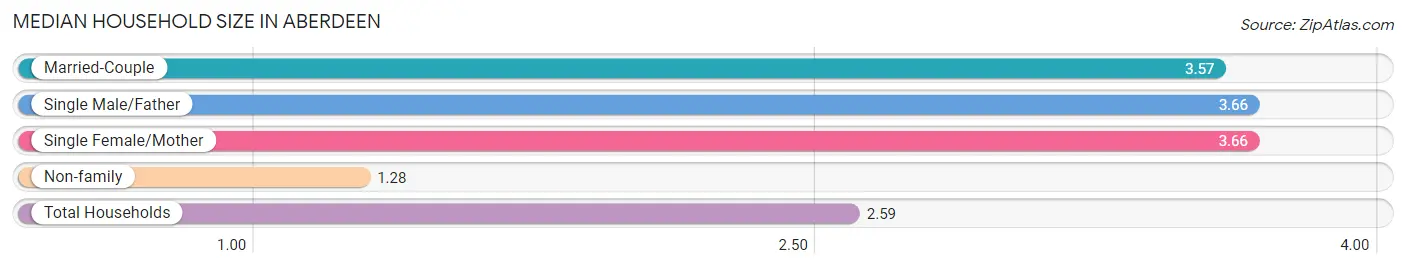
| Household Type | # Households | Household Size |
| Married-Couple | 2,302 (35.7%) | 3.57 |
| Single Male/Father | 564 (8.8%) | 3.66 |
| Single Female/Mother | 780 (12.1%) | 3.66 |
| Non-family | 2,795 (43.4%) | 1.28 |
| Total Households | 6,441 (100.0%) | 2.59 |
Household Size by Marriage Status in Aberdeen
Out of a total of 6,441 households in Aberdeen, 3,646 (56.6%) are family households, while 2,795 (43.4%) are nonfamily households. The most numerous type of family households are 2-person households, comprising 1,384, and the most common type of nonfamily households are 1-person households, comprising 2,214.
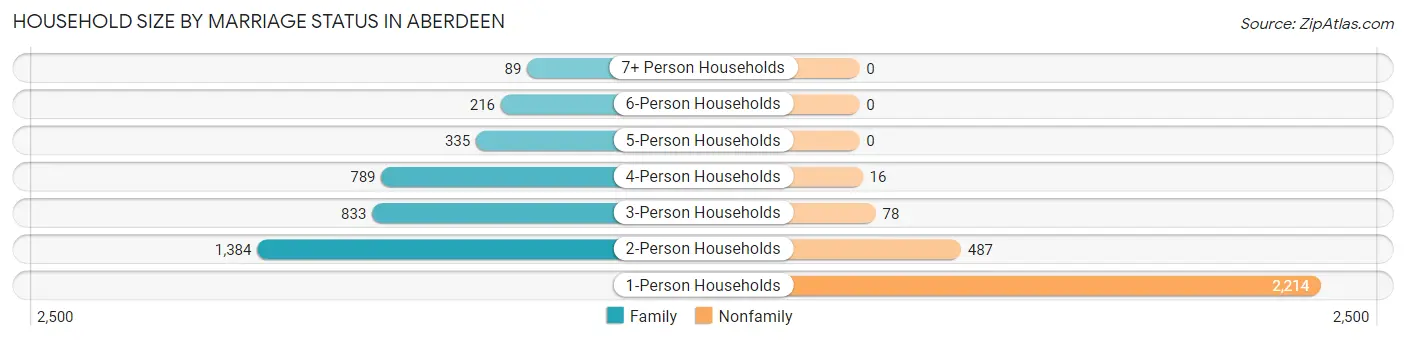
| Household Size | Family Households | Nonfamily Households |
| 1-Person Households | - | 2,214 (34.4%) |
| 2-Person Households | 1,384 (21.5%) | 487 (7.6%) |
| 3-Person Households | 833 (12.9%) | 78 (1.2%) |
| 4-Person Households | 789 (12.2%) | 16 (0.3%) |
| 5-Person Households | 335 (5.2%) | 0 (0.0%) |
| 6-Person Households | 216 (3.4%) | 0 (0.0%) |
| 7+ Person Households | 89 (1.4%) | 0 (0.0%) |
| Total | 3,646 (56.6%) | 2,795 (43.4%) |
Female Fertility in Aberdeen
Fertility by Age in Aberdeen
Average fertility rate in Aberdeen is 59.0 births per 1,000 women. Women in the age bracket of 20 to 34 years have the highest fertility rate with 151.0 births per 1,000 women. Women in the age bracket of 20 to 34 years acount for 80.7% of all women with births.
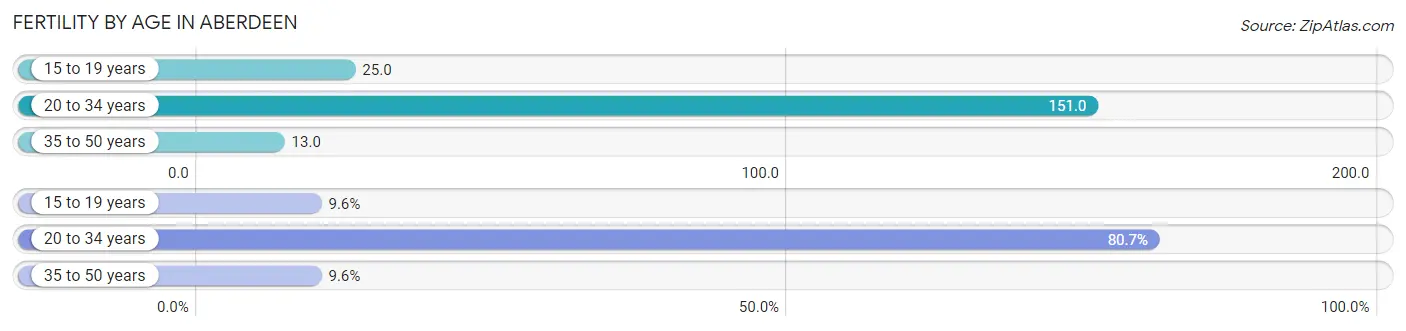
| Age Bracket | Women with Births | Births / 1,000 Women |
| 15 to 19 years | 21 (9.6%) | 25.0 |
| 20 to 34 years | 176 (80.7%) | 151.0 |
| 35 to 50 years | 21 (9.6%) | 13.0 |
| Total | 218 (100.0%) | 59.0 |
Fertility by Age by Marriage Status in Aberdeen
32.6% of women with births (218) in Aberdeen are married. The highest percentage of unmarried women with births falls into 15 to 19 years age bracket with 100.0% of them unmarried at the time of birth, while the lowest percentage of unmarried women with births belong to 35 to 50 years age bracket with 0.0% of them unmarried.
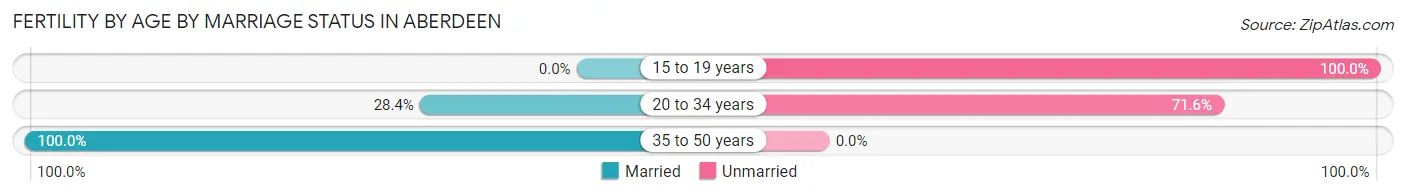
| Age Bracket | Married | Unmarried |
| 15 to 19 years | 0 (0.0%) | 21 (100.0%) |
| 20 to 34 years | 50 (28.4%) | 126 (71.6%) |
| 35 to 50 years | 21 (100.0%) | 0 (0.0%) |
| Total | 71 (32.6%) | 147 (67.4%) |
Fertility by Education in Aberdeen
Average fertility rate in Aberdeen is 59.0 births per 1,000 women. Women with the education attainment of graduate degree have the highest fertility rate of 196.0 births per 1,000 women, while women with the education attainment of less than high school have the lowest fertility at 37.0 births per 1,000 women. Women with the education attainment of high school diploma represent 29.8% of all women with births.
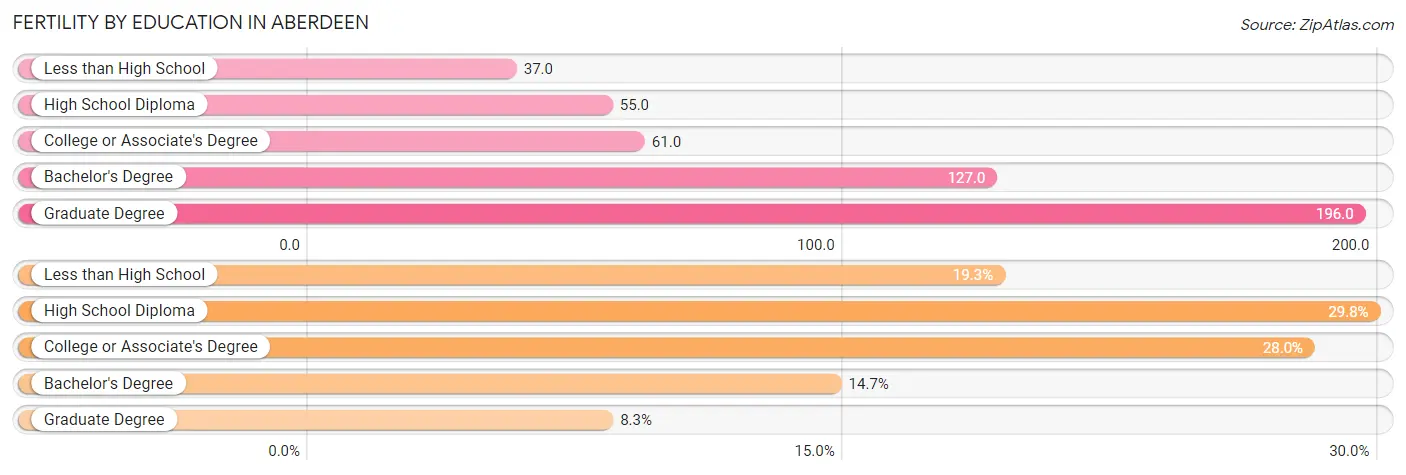
| Educational Attainment | Women with Births | Births / 1,000 Women |
| Less than High School | 42 (19.3%) | 37.0 |
| High School Diploma | 65 (29.8%) | 55.0 |
| College or Associate's Degree | 61 (28.0%) | 61.0 |
| Bachelor's Degree | 32 (14.7%) | 127.0 |
| Graduate Degree | 18 (8.3%) | 196.0 |
| Total | 218 (100.0%) | 59.0 |
Fertility by Education by Marriage Status in Aberdeen
67.4% of women with births in Aberdeen are unmarried. Women with the educational attainment of bachelor's degree are most likely to be married with 100.0% of them married at childbirth, while women with the educational attainment of high school diploma are least likely to be married with 100.0% of them unmarried at childbirth.
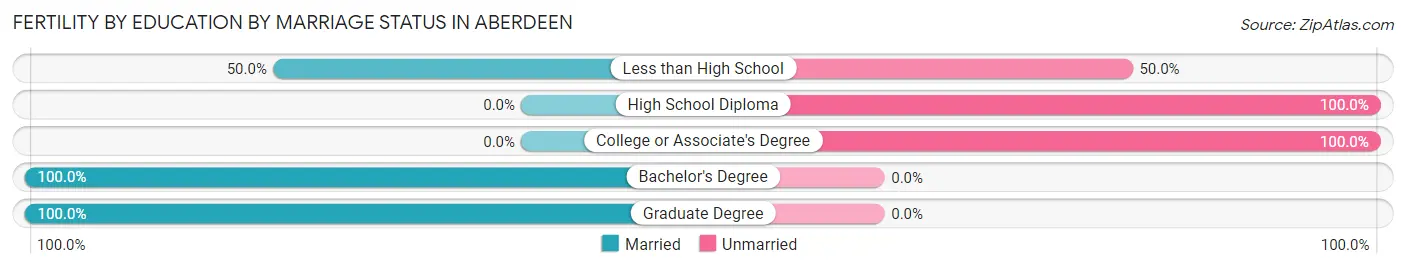
| Educational Attainment | Married | Unmarried |
| Less than High School | 21 (50.0%) | 21 (50.0%) |
| High School Diploma | 0 (0.0%) | 65 (100.0%) |
| College or Associate's Degree | 0 (0.0%) | 61 (100.0%) |
| Bachelor's Degree | 32 (100.0%) | 0 (0.0%) |
| Graduate Degree | 18 (100.0%) | 0 (0.0%) |
| Total | 71 (32.6%) | 147 (67.4%) |
Employment Characteristics in Aberdeen
Employment by Class of Employer in Aberdeen
Among the 6,525 employed individuals in Aberdeen, private company employees (4,307 | 66.0%), local government employees (568 | 8.7%), and not-for-profit organizations (529 | 8.1%) make up the most common classes of employment.
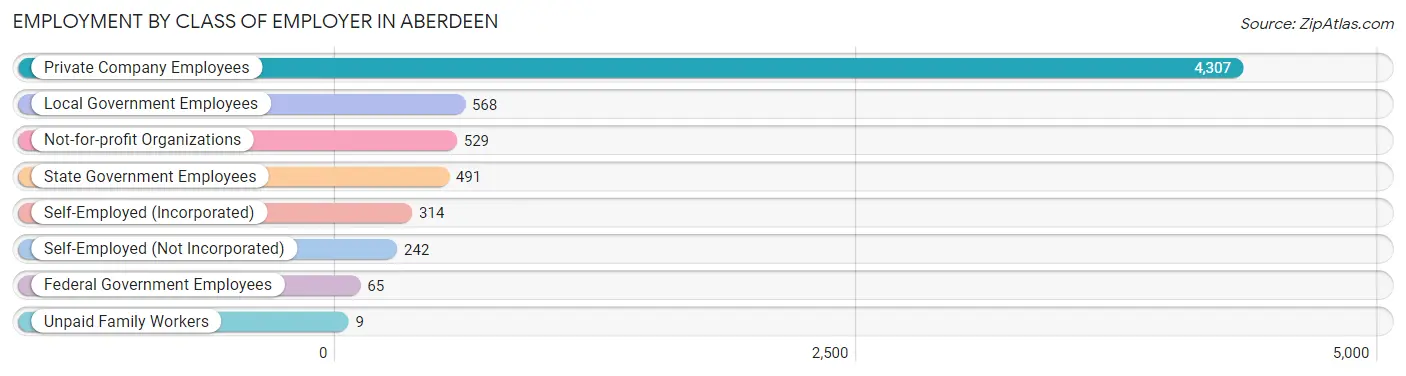
| Employer Class | # Employees | % Employees |
| Private Company Employees | 4,307 | 66.0% |
| Self-Employed (Incorporated) | 314 | 4.8% |
| Self-Employed (Not Incorporated) | 242 | 3.7% |
| Not-for-profit Organizations | 529 | 8.1% |
| Local Government Employees | 568 | 8.7% |
| State Government Employees | 491 | 7.5% |
| Federal Government Employees | 65 | 1.0% |
| Unpaid Family Workers | 9 | 0.1% |
| Total | 6,525 | 100.0% |
Employment Status by Age in Aberdeen
According to the labor force statistics for Aberdeen, out of the total population over 16 years of age (13,136), 54.8% or 7,199 individuals are in the labor force, with 6.3% or 454 of them unemployed. The age group with the highest labor force participation rate is 20 to 24 years, with 92.2% or 789 individuals in the labor force. Within the labor force, the 16 to 19 years age range has the highest percentage of unemployed individuals, with 17.3% or 78 of them being unemployed.
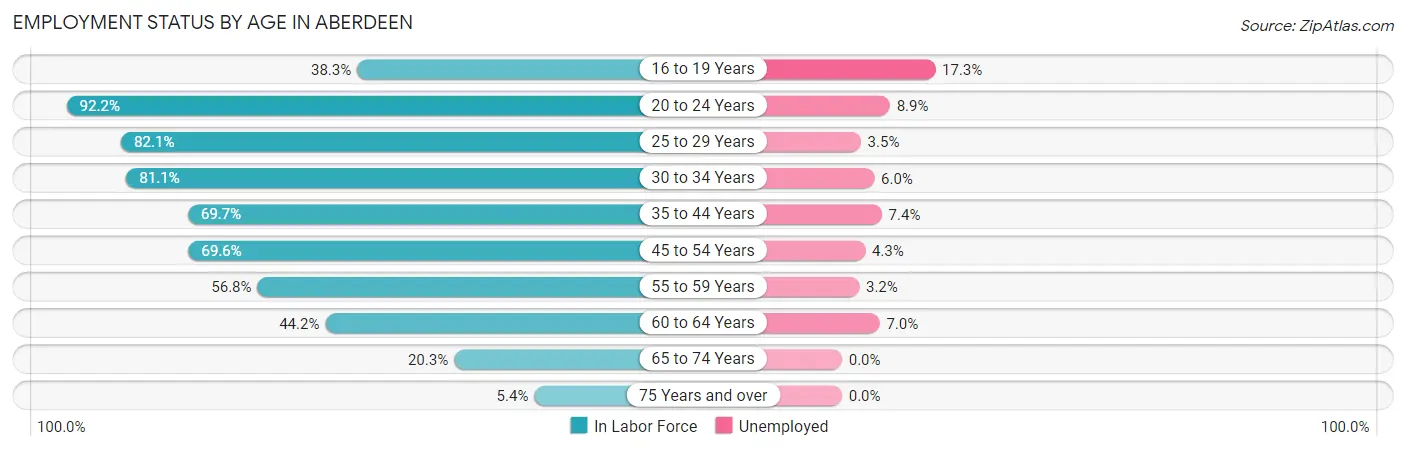
| Age Bracket | In Labor Force | Unemployed |
| 16 to 19 Years | 452 (38.3%) | 78 (17.3%) |
| 20 to 24 Years | 789 (92.2%) | 70 (8.9%) |
| 25 to 29 Years | 724 (82.1%) | 25 (3.5%) |
| 30 to 34 Years | 835 (81.1%) | 50 (6.0%) |
| 35 to 44 Years | 1,858 (69.7%) | 137 (7.4%) |
| 45 to 54 Years | 1,235 (69.6%) | 53 (4.3%) |
| 55 to 59 Years | 503 (56.8%) | 16 (3.2%) |
| 60 to 64 Years | 388 (44.2%) | 27 (7.0%) |
| 65 to 74 Years | 341 (20.3%) | 0 (0.0%) |
| 75 Years and over | 71 (5.4%) | 0 (0.0%) |
| Total | 7,199 (54.8%) | 454 (6.3%) |
Employment Status by Educational Attainment in Aberdeen
According to labor force statistics for Aberdeen, 68.3% of individuals (5,541) out of the total population between 25 and 64 years of age (8,113) are in the labor force, with 5.6% or 310 of them being unemployed. The group with the highest labor force participation rate are those with the educational attainment of bachelor's degree or higher, with 76.6% or 925 individuals in the labor force. Within the labor force, individuals with less than high school education have the highest percentage of unemployment, with 12.3% or 118 of them being unemployed.
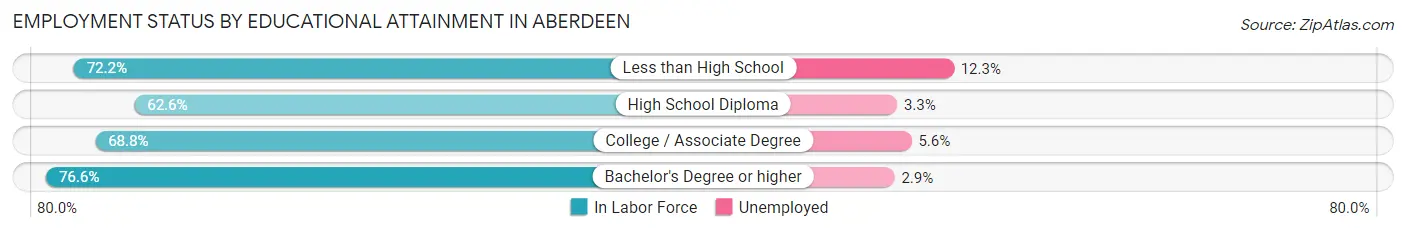
| Educational Attainment | In Labor Force | Unemployed |
| Less than High School | 960 (72.2%) | 163 (12.3%) |
| High School Diploma | 1,809 (62.6%) | 95 (3.3%) |
| College / Associate Degree | 1,849 (68.8%) | 151 (5.6%) |
| Bachelor's Degree or higher | 925 (76.6%) | 35 (2.9%) |
| Total | 5,541 (68.3%) | 454 (5.6%) |
Employment Occupations by Sex in Aberdeen
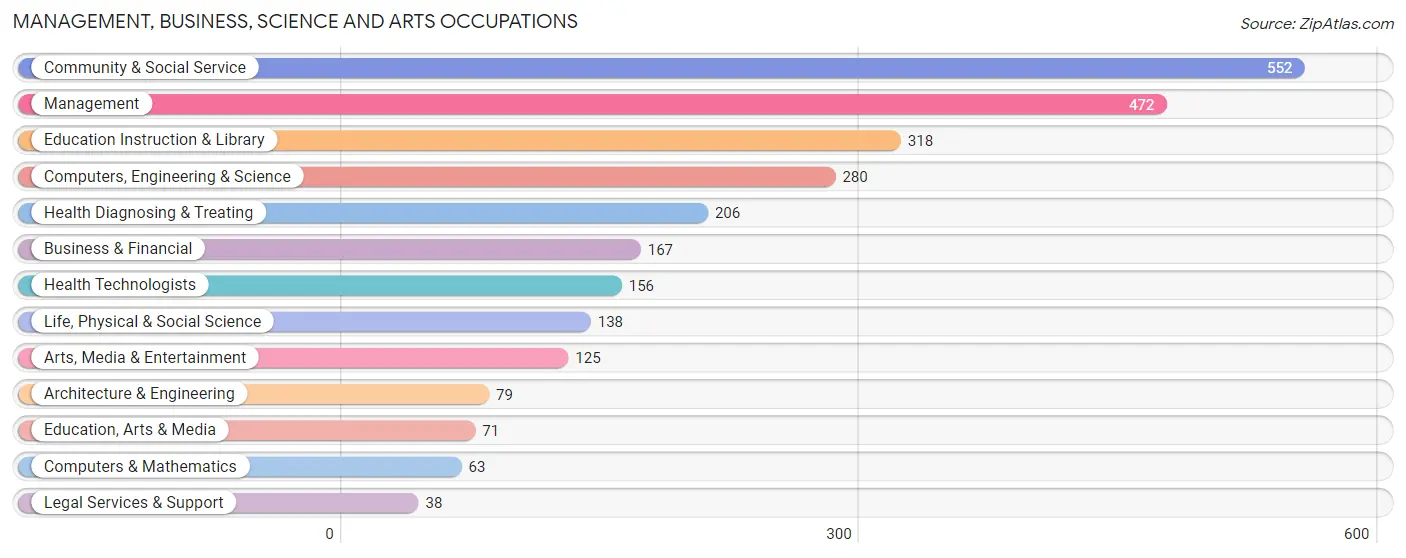
Management, Business, Science and Arts Occupations
The most common Management, Business, Science and Arts occupations in Aberdeen are Community & Social Service (552 | 8.2%), Management (472 | 7.0%), Education Instruction & Library (318 | 4.7%), Computers, Engineering & Science (280 | 4.2%), and Health Diagnosing & Treating (206 | 3.1%).
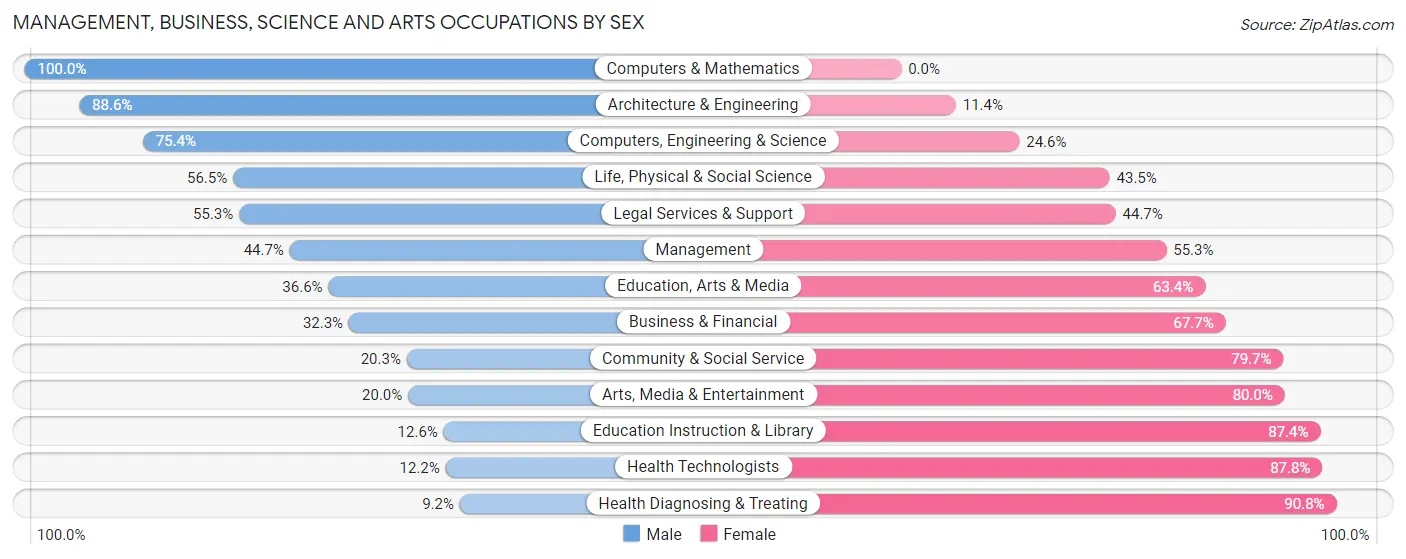
Management, Business, Science and Arts Occupations by Sex
Within the Management, Business, Science and Arts occupations in Aberdeen, the most male-oriented occupations are Computers & Mathematics (100.0%), Architecture & Engineering (88.6%), and Computers, Engineering & Science (75.4%), while the most female-oriented occupations are Health Diagnosing & Treating (90.8%), Health Technologists (87.8%), and Education Instruction & Library (87.4%).
| Occupation | Male | Female |
| Management | 211 (44.7%) | 261 (55.3%) |
| Business & Financial | 54 (32.3%) | 113 (67.7%) |
| Computers, Engineering & Science | 211 (75.4%) | 69 (24.6%) |
| Computers & Mathematics | 63 (100.0%) | 0 (0.0%) |
| Architecture & Engineering | 70 (88.6%) | 9 (11.4%) |
| Life, Physical & Social Science | 78 (56.5%) | 60 (43.5%) |
| Community & Social Service | 112 (20.3%) | 440 (79.7%) |
| Education, Arts & Media | 26 (36.6%) | 45 (63.4%) |
| Legal Services & Support | 21 (55.3%) | 17 (44.7%) |
| Education Instruction & Library | 40 (12.6%) | 278 (87.4%) |
| Arts, Media & Entertainment | 25 (20.0%) | 100 (80.0%) |
| Health Diagnosing & Treating | 19 (9.2%) | 187 (90.8%) |
| Health Technologists | 19 (12.2%) | 137 (87.8%) |
| Total (Category) | 607 (36.2%) | 1,070 (63.8%) |
| Total (Overall) | 3,474 (51.7%) | 3,244 (48.3%) |
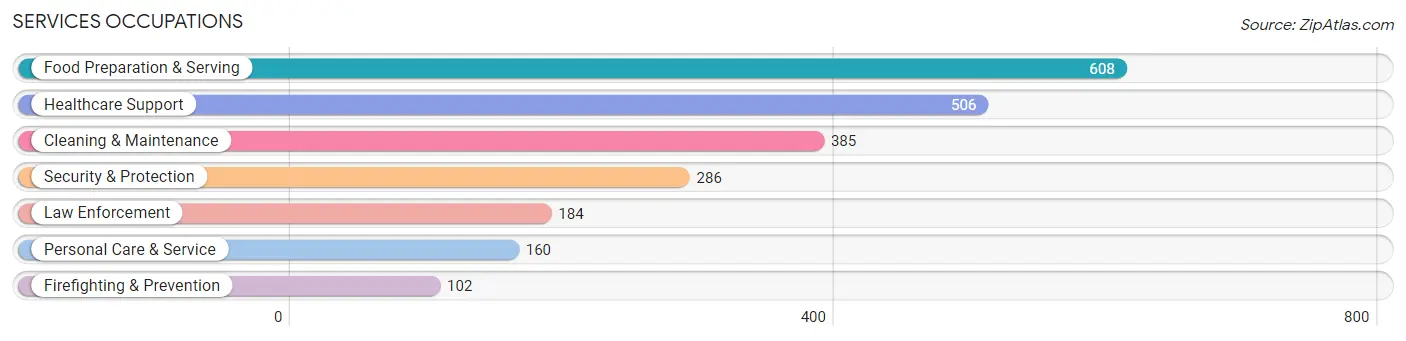
Services Occupations
The most common Services occupations in Aberdeen are Food Preparation & Serving (608 | 9.0%), Healthcare Support (506 | 7.5%), Cleaning & Maintenance (385 | 5.7%), Security & Protection (286 | 4.3%), and Law Enforcement (184 | 2.7%).
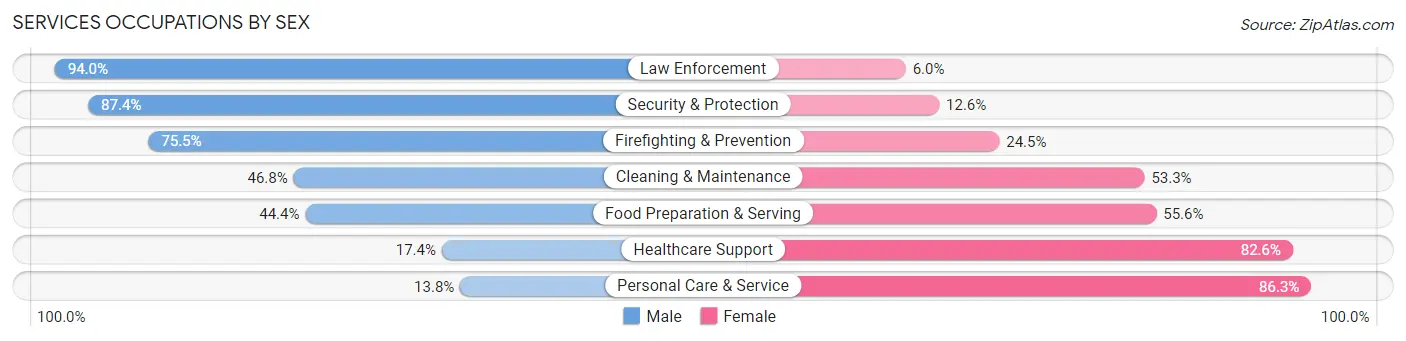
Services Occupations by Sex
Within the Services occupations in Aberdeen, the most male-oriented occupations are Law Enforcement (94.0%), Security & Protection (87.4%), and Firefighting & Prevention (75.5%), while the most female-oriented occupations are Personal Care & Service (86.3%), Healthcare Support (82.6%), and Food Preparation & Serving (55.6%).
| Occupation | Male | Female |
| Healthcare Support | 88 (17.4%) | 418 (82.6%) |
| Security & Protection | 250 (87.4%) | 36 (12.6%) |
| Firefighting & Prevention | 77 (75.5%) | 25 (24.5%) |
| Law Enforcement | 173 (94.0%) | 11 (6.0%) |
| Food Preparation & Serving | 270 (44.4%) | 338 (55.6%) |
| Cleaning & Maintenance | 180 (46.8%) | 205 (53.2%) |
| Personal Care & Service | 22 (13.8%) | 138 (86.3%) |
| Total (Category) | 810 (41.6%) | 1,135 (58.4%) |
| Total (Overall) | 3,474 (51.7%) | 3,244 (48.3%) |
Sales and Office Occupations
The most common Sales and Office occupations in Aberdeen are Office & Administration (850 | 12.7%), and Sales & Related (517 | 7.7%).
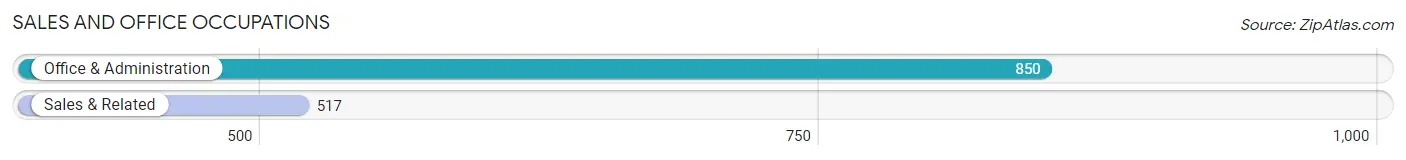
Sales and Office Occupations by Sex
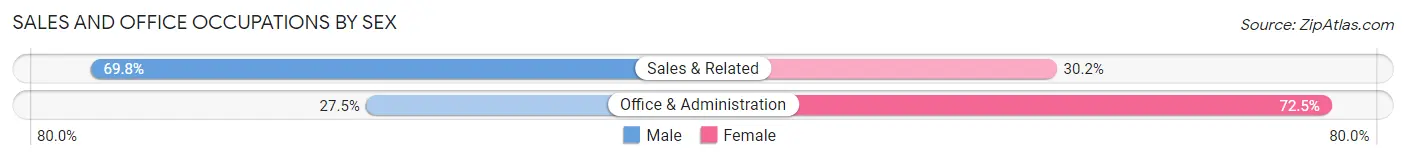
| Occupation | Male | Female |
| Sales & Related | 361 (69.8%) | 156 (30.2%) |
| Office & Administration | 234 (27.5%) | 616 (72.5%) |
| Total (Category) | 595 (43.5%) | 772 (56.5%) |
| Total (Overall) | 3,474 (51.7%) | 3,244 (48.3%) |
Natural Resources, Construction and Maintenance Occupations
The most common Natural Resources, Construction and Maintenance occupations in Aberdeen are Construction & Extraction (332 | 4.9%), Farming, Fishing & Forestry (196 | 2.9%), and Installation, Maintenance & Repair (170 | 2.5%).
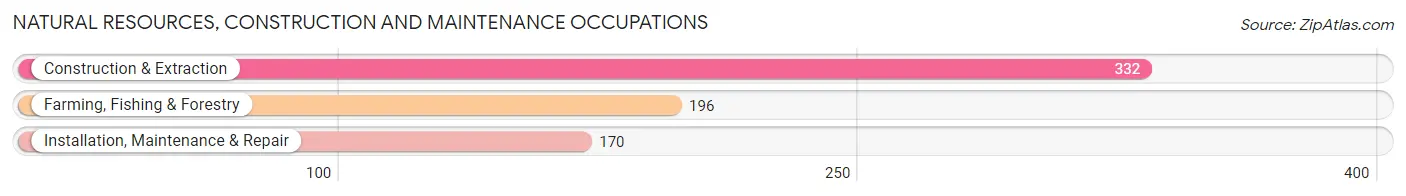
Natural Resources, Construction and Maintenance Occupations by Sex
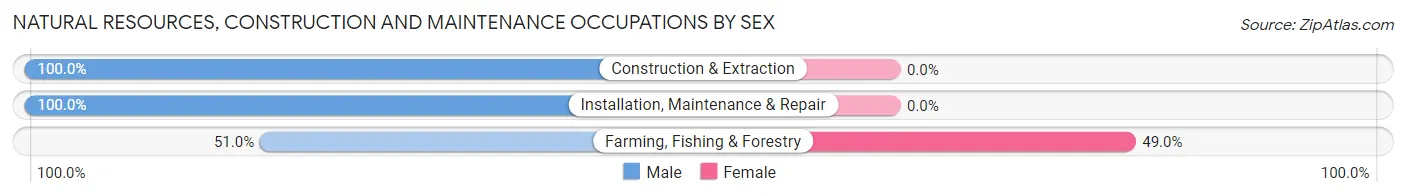
| Occupation | Male | Female |
| Farming, Fishing & Forestry | 100 (51.0%) | 96 (49.0%) |
| Construction & Extraction | 332 (100.0%) | 0 (0.0%) |
| Installation, Maintenance & Repair | 170 (100.0%) | 0 (0.0%) |
| Total (Category) | 602 (86.3%) | 96 (13.8%) |
| Total (Overall) | 3,474 (51.7%) | 3,244 (48.3%) |
Production, Transportation and Moving Occupations
The most common Production, Transportation and Moving occupations in Aberdeen are Material Moving (451 | 6.7%), Production (349 | 5.2%), and Transportation (231 | 3.4%).
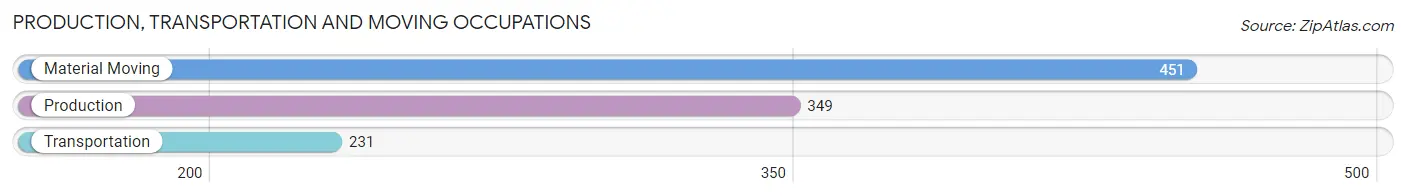
Production, Transportation and Moving Occupations by Sex
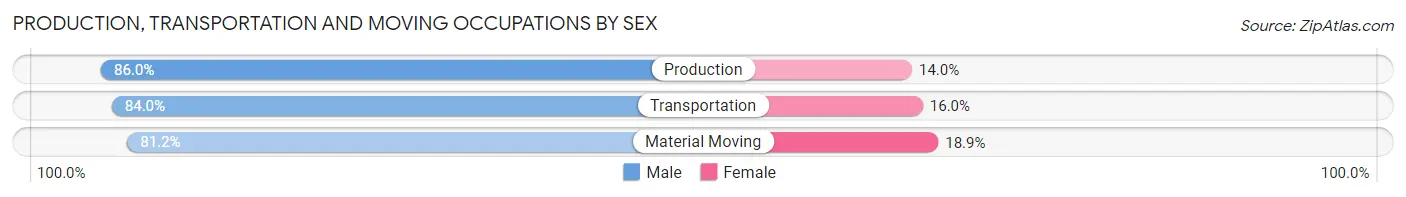
| Occupation | Male | Female |
| Production | 300 (86.0%) | 49 (14.0%) |
| Transportation | 194 (84.0%) | 37 (16.0%) |
| Material Moving | 366 (81.1%) | 85 (18.9%) |
| Total (Category) | 860 (83.4%) | 171 (16.6%) |
| Total (Overall) | 3,474 (51.7%) | 3,244 (48.3%) |
Employment Industries by Sex in Aberdeen
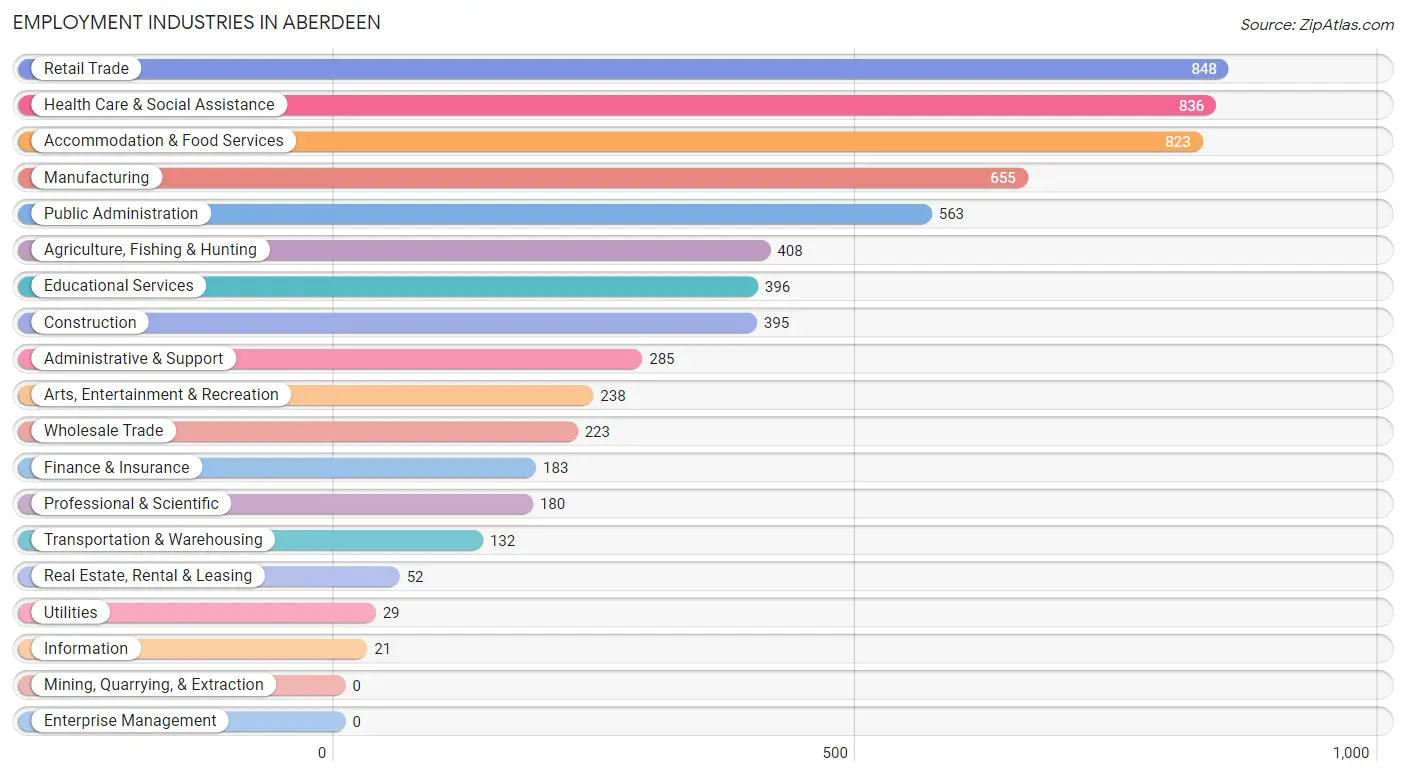
Employment Industries in Aberdeen
The major employment industries in Aberdeen include Retail Trade (848 | 12.6%), Health Care & Social Assistance (836 | 12.4%), Accommodation & Food Services (823 | 12.2%), Manufacturing (655 | 9.8%), and Public Administration (563 | 8.4%).
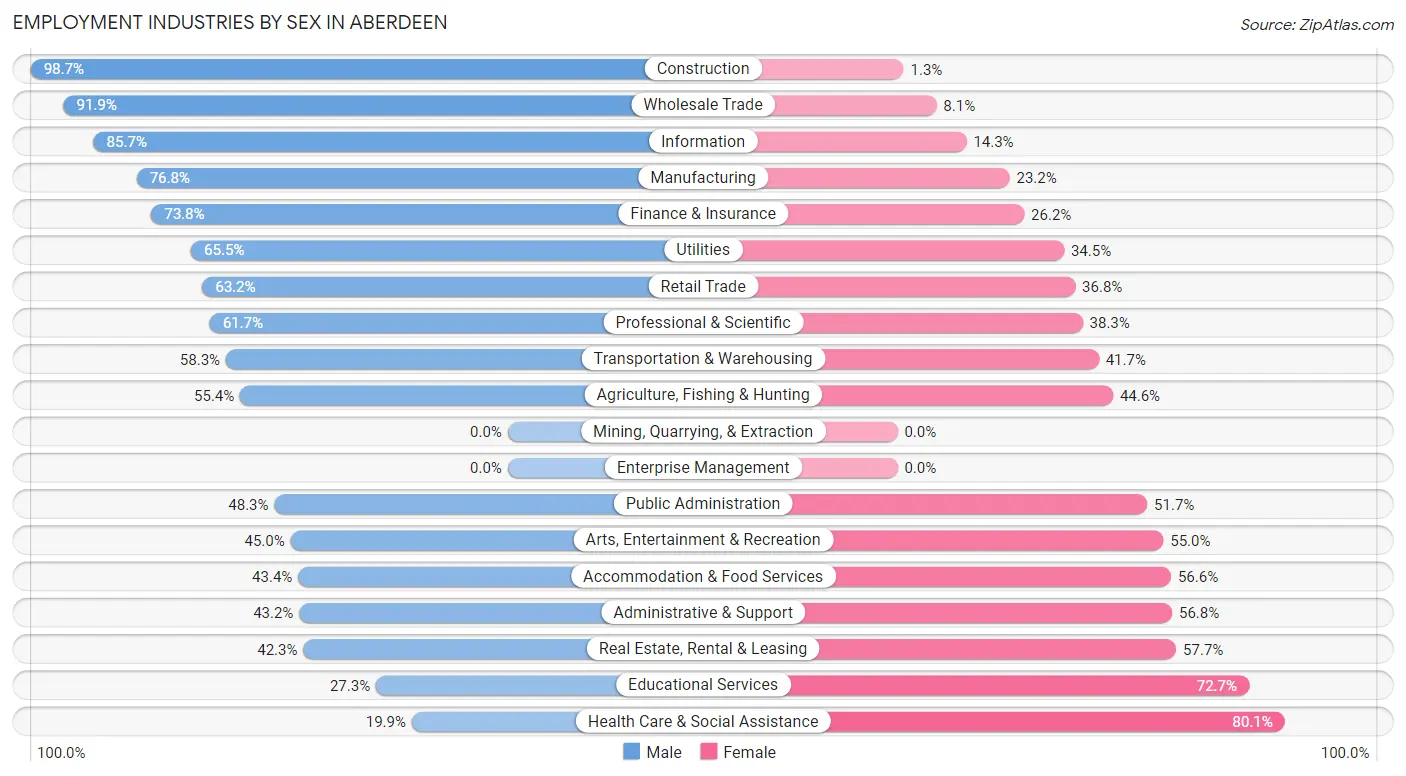
Employment Industries by Sex in Aberdeen
The Aberdeen industries that see more men than women are Construction (98.7%), Wholesale Trade (91.9%), and Information (85.7%), whereas the industries that tend to have a higher number of women are Health Care & Social Assistance (80.1%), Educational Services (72.7%), and Real Estate, Rental & Leasing (57.7%).
| Industry | Male | Female |
| Agriculture, Fishing & Hunting | 226 (55.4%) | 182 (44.6%) |
| Mining, Quarrying, & Extraction | 0 (0.0%) | 0 (0.0%) |
| Construction | 390 (98.7%) | 5 (1.3%) |
| Manufacturing | 503 (76.8%) | 152 (23.2%) |
| Wholesale Trade | 205 (91.9%) | 18 (8.1%) |
| Retail Trade | 536 (63.2%) | 312 (36.8%) |
| Transportation & Warehousing | 77 (58.3%) | 55 (41.7%) |
| Utilities | 19 (65.5%) | 10 (34.5%) |
| Information | 18 (85.7%) | 3 (14.3%) |
| Finance & Insurance | 135 (73.8%) | 48 (26.2%) |
| Real Estate, Rental & Leasing | 22 (42.3%) | 30 (57.7%) |
| Professional & Scientific | 111 (61.7%) | 69 (38.3%) |
| Enterprise Management | 0 (0.0%) | 0 (0.0%) |
| Administrative & Support | 123 (43.2%) | 162 (56.8%) |
| Educational Services | 108 (27.3%) | 288 (72.7%) |
| Health Care & Social Assistance | 166 (19.9%) | 670 (80.1%) |
| Arts, Entertainment & Recreation | 107 (45.0%) | 131 (55.0%) |
| Accommodation & Food Services | 357 (43.4%) | 466 (56.6%) |
| Public Administration | 272 (48.3%) | 291 (51.7%) |
| Total | 3,474 (51.7%) | 3,244 (48.3%) |
Education in Aberdeen
School Enrollment in Aberdeen
The most common levels of schooling among the 4,201 students in Aberdeen are middle school (1,188 | 28.3%), high school (1,118 | 26.6%), and elementary school (890 | 21.2%).
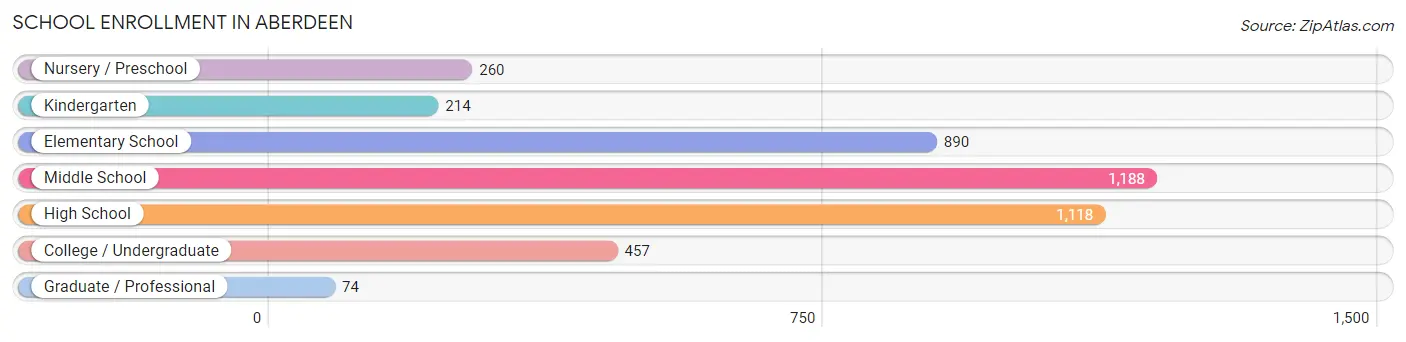
| School Level | # Students | % Students |
| Nursery / Preschool | 260 | 6.2% |
| Kindergarten | 214 | 5.1% |
| Elementary School | 890 | 21.2% |
| Middle School | 1,188 | 28.3% |
| High School | 1,118 | 26.6% |
| College / Undergraduate | 457 | 10.9% |
| Graduate / Professional | 74 | 1.8% |
| Total | 4,201 | 100.0% |
School Enrollment by Age by Funding Source in Aberdeen
Out of a total of 4,201 students who are enrolled in schools in Aberdeen, 302 (7.2%) attend a private institution, while the remaining 3,899 (92.8%) are enrolled in public schools. The age group of 3 to 4 year olds has the highest likelihood of being enrolled in private schools, with 63 (26.0% in the age bracket) enrolled. Conversely, the age group of 18 to 19 year olds has the lowest likelihood of being enrolled in a private school, with 334 (100.0% in the age bracket) attending a public institution.
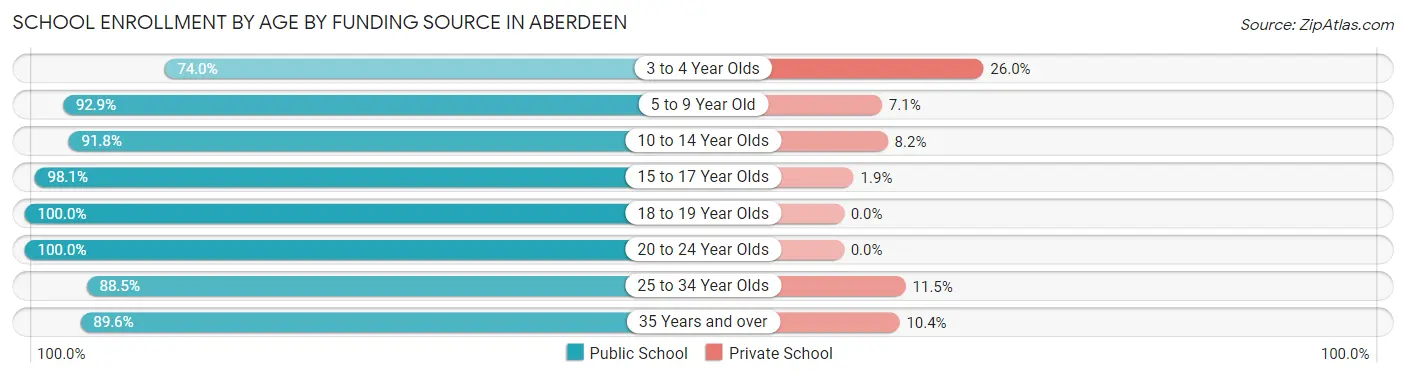
| Age Bracket | Public School | Private School |
| 3 to 4 Year Olds | 179 (74.0%) | 63 (26.0%) |
| 5 to 9 Year Old | 978 (92.9%) | 75 (7.1%) |
| 10 to 14 Year Olds | 1,255 (91.8%) | 112 (8.2%) |
| 15 to 17 Year Olds | 738 (98.1%) | 14 (1.9%) |
| 18 to 19 Year Olds | 334 (100.0%) | 0 (0.0%) |
| 20 to 24 Year Olds | 117 (100.0%) | 0 (0.0%) |
| 25 to 34 Year Olds | 161 (88.5%) | 21 (11.5%) |
| 35 Years and over | 138 (89.6%) | 16 (10.4%) |
| Total | 3,899 (92.8%) | 302 (7.2%) |
Educational Attainment by Field of Study in Aberdeen
Education (423 | 20.9%), business (314 | 15.5%), science & technology (270 | 13.3%), bio, nature & agricultural (254 | 12.5%), and social sciences (110 | 5.4%) are the most common fields of study among 2,026 individuals in Aberdeen who have obtained a bachelor's degree or higher.
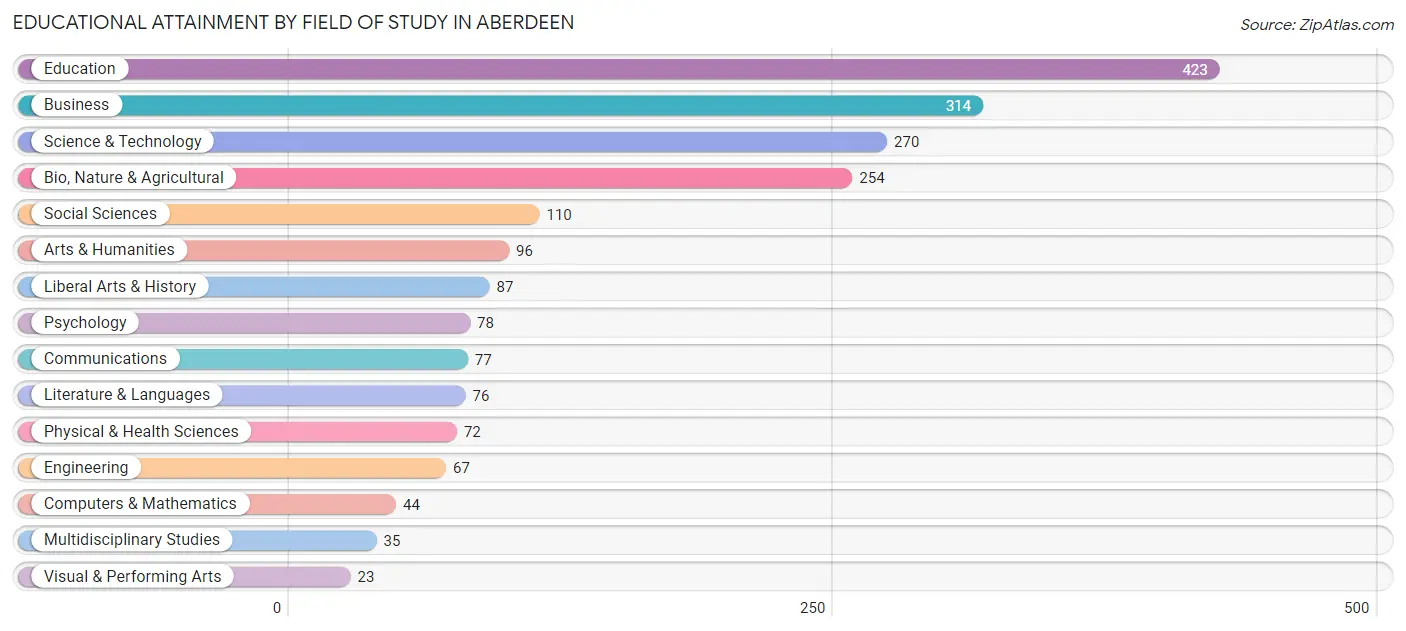
| Field of Study | # Graduates | % Graduates |
| Computers & Mathematics | 44 | 2.2% |
| Bio, Nature & Agricultural | 254 | 12.5% |
| Physical & Health Sciences | 72 | 3.5% |
| Psychology | 78 | 3.8% |
| Social Sciences | 110 | 5.4% |
| Engineering | 67 | 3.3% |
| Multidisciplinary Studies | 35 | 1.7% |
| Science & Technology | 270 | 13.3% |
| Business | 314 | 15.5% |
| Education | 423 | 20.9% |
| Literature & Languages | 76 | 3.7% |
| Liberal Arts & History | 87 | 4.3% |
| Visual & Performing Arts | 23 | 1.1% |
| Communications | 77 | 3.8% |
| Arts & Humanities | 96 | 4.7% |
| Total | 2,026 | 100.0% |
Transportation & Commute in Aberdeen
Vehicle Availability by Sex in Aberdeen
The most prevalent vehicle ownership categories in Aberdeen are males with 2 vehicles (1,243, accounting for 36.9%) and females with 2 vehicles (983, making up 39.6%).
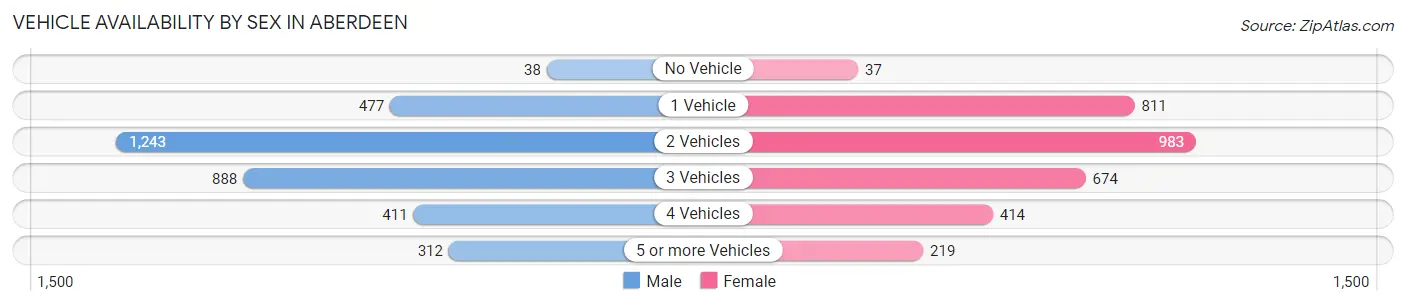
| Vehicles Available | Male | Female |
| No Vehicle | 38 (1.1%) | 37 (1.2%) |
| 1 Vehicle | 477 (14.2%) | 811 (25.8%) |
| 2 Vehicles | 1,243 (36.9%) | 983 (31.3%) |
| 3 Vehicles | 888 (26.4%) | 674 (21.5%) |
| 4 Vehicles | 411 (12.2%) | 414 (13.2%) |
| 5 or more Vehicles | 312 (9.3%) | 219 (7.0%) |
| Total | 3,369 (100.0%) | 3,138 (100.0%) |
Commute Time in Aberdeen
The most frequently occuring commute durations in Aberdeen are 5 to 9 minutes (1,851 commuters, 30.2%), 10 to 14 minutes (1,217 commuters, 19.8%), and 15 to 19 minutes (821 commuters, 13.4%).
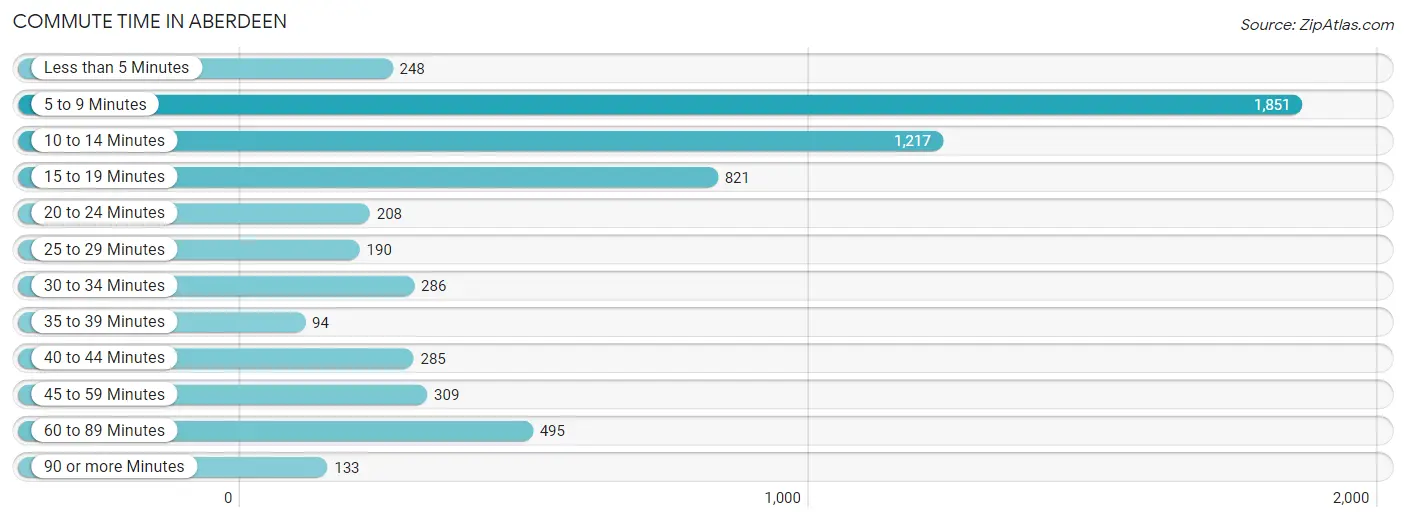
| Commute Time | # Commuters | % Commuters |
| Less than 5 Minutes | 248 | 4.0% |
| 5 to 9 Minutes | 1,851 | 30.2% |
| 10 to 14 Minutes | 1,217 | 19.8% |
| 15 to 19 Minutes | 821 | 13.4% |
| 20 to 24 Minutes | 208 | 3.4% |
| 25 to 29 Minutes | 190 | 3.1% |
| 30 to 34 Minutes | 286 | 4.7% |
| 35 to 39 Minutes | 94 | 1.5% |
| 40 to 44 Minutes | 285 | 4.6% |
| 45 to 59 Minutes | 309 | 5.0% |
| 60 to 89 Minutes | 495 | 8.1% |
| 90 or more Minutes | 133 | 2.2% |
Commute Time by Sex in Aberdeen
The most common commute times in Aberdeen are 10 to 14 minutes (753 commuters, 23.1%) for males and 5 to 9 minutes (1,112 commuters, 38.7%) for females.
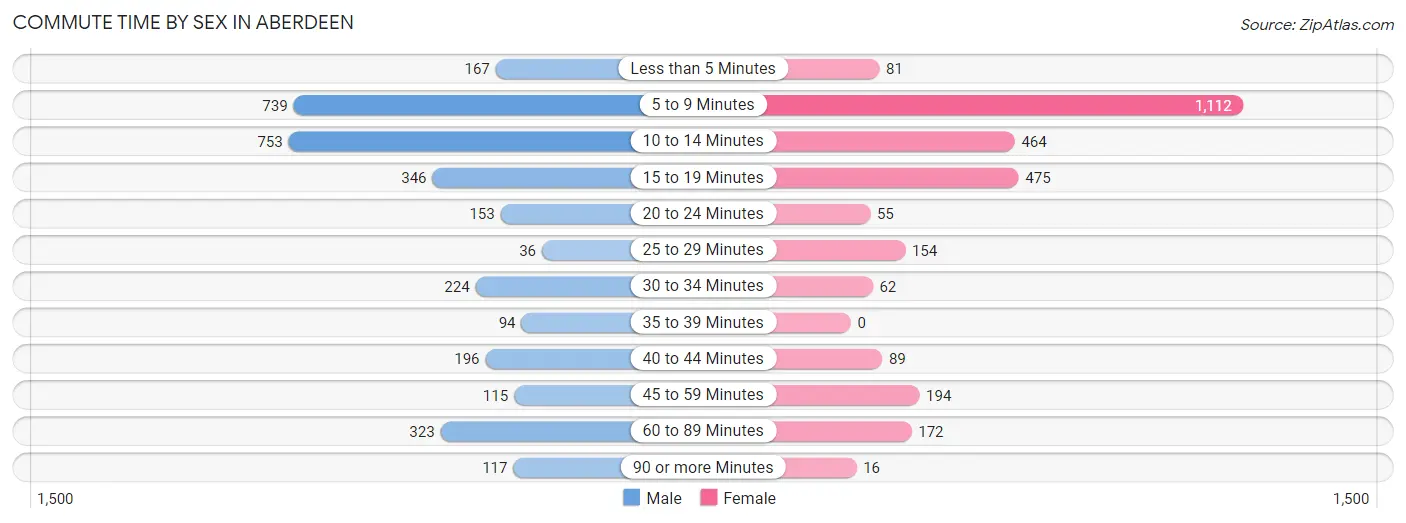
| Commute Time | Male | Female |
| Less than 5 Minutes | 167 (5.1%) | 81 (2.8%) |
| 5 to 9 Minutes | 739 (22.7%) | 1,112 (38.7%) |
| 10 to 14 Minutes | 753 (23.1%) | 464 (16.1%) |
| 15 to 19 Minutes | 346 (10.6%) | 475 (16.5%) |
| 20 to 24 Minutes | 153 (4.7%) | 55 (1.9%) |
| 25 to 29 Minutes | 36 (1.1%) | 154 (5.4%) |
| 30 to 34 Minutes | 224 (6.9%) | 62 (2.2%) |
| 35 to 39 Minutes | 94 (2.9%) | 0 (0.0%) |
| 40 to 44 Minutes | 196 (6.0%) | 89 (3.1%) |
| 45 to 59 Minutes | 115 (3.5%) | 194 (6.8%) |
| 60 to 89 Minutes | 323 (9.9%) | 172 (6.0%) |
| 90 or more Minutes | 117 (3.6%) | 16 (0.6%) |
Time of Departure to Work by Sex in Aberdeen
The most frequent times of departure to work in Aberdeen are 7:00 AM to 7:29 AM (507, 15.5%) for males and 7:30 AM to 7:59 AM (504, 17.5%) for females.
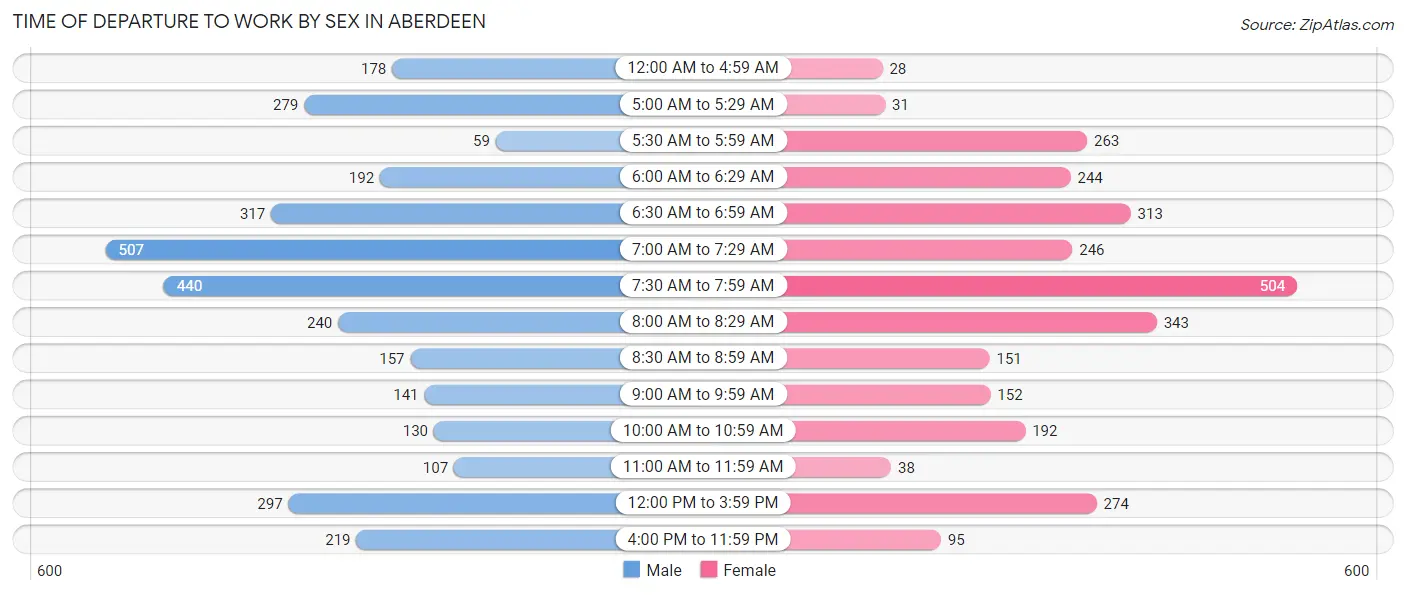
| Time of Departure | Male | Female |
| 12:00 AM to 4:59 AM | 178 (5.5%) | 28 (1.0%) |
| 5:00 AM to 5:29 AM | 279 (8.6%) | 31 (1.1%) |
| 5:30 AM to 5:59 AM | 59 (1.8%) | 263 (9.1%) |
| 6:00 AM to 6:29 AM | 192 (5.9%) | 244 (8.5%) |
| 6:30 AM to 6:59 AM | 317 (9.7%) | 313 (10.9%) |
| 7:00 AM to 7:29 AM | 507 (15.5%) | 246 (8.6%) |
| 7:30 AM to 7:59 AM | 440 (13.5%) | 504 (17.5%) |
| 8:00 AM to 8:29 AM | 240 (7.4%) | 343 (11.9%) |
| 8:30 AM to 8:59 AM | 157 (4.8%) | 151 (5.2%) |
| 9:00 AM to 9:59 AM | 141 (4.3%) | 152 (5.3%) |
| 10:00 AM to 10:59 AM | 130 (4.0%) | 192 (6.7%) |
| 11:00 AM to 11:59 AM | 107 (3.3%) | 38 (1.3%) |
| 12:00 PM to 3:59 PM | 297 (9.1%) | 274 (9.5%) |
| 4:00 PM to 11:59 PM | 219 (6.7%) | 95 (3.3%) |
| Total | 3,263 (100.0%) | 2,874 (100.0%) |
Housing Occupancy in Aberdeen
Occupancy by Ownership in Aberdeen
Of the total 6,441 dwellings in Aberdeen, owner-occupied units account for 3,581 (55.6%), while renter-occupied units make up 2,860 (44.4%).
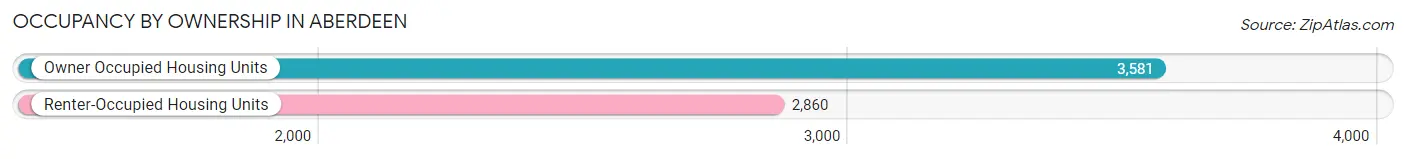
| Occupancy | # Housing Units | % Housing Units |
| Owner Occupied Housing Units | 3,581 | 55.6% |
| Renter-Occupied Housing Units | 2,860 | 44.4% |
| Total Occupied Housing Units | 6,441 | 100.0% |
Occupancy by Household Size in Aberdeen
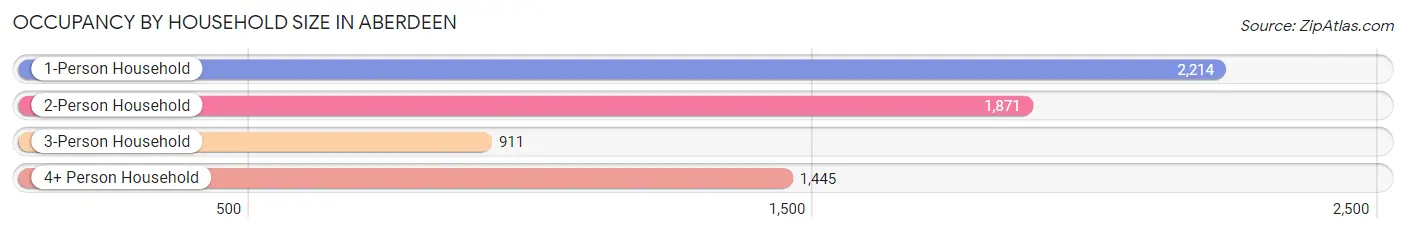
| Household Size | # Housing Units | % Housing Units |
| 1-Person Household | 2,214 | 34.4% |
| 2-Person Household | 1,871 | 29.0% |
| 3-Person Household | 911 | 14.1% |
| 4+ Person Household | 1,445 | 22.4% |
| Total Housing Units | 6,441 | 100.0% |
Occupancy by Ownership by Household Size in Aberdeen
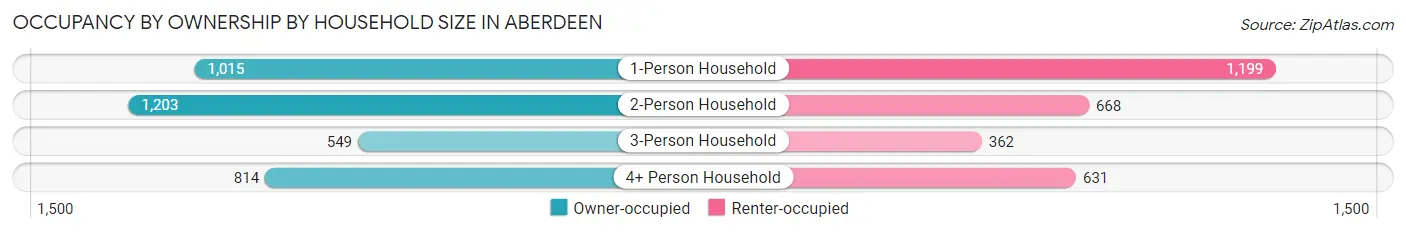
| Household Size | Owner-occupied | Renter-occupied |
| 1-Person Household | 1,015 (45.8%) | 1,199 (54.2%) |
| 2-Person Household | 1,203 (64.3%) | 668 (35.7%) |
| 3-Person Household | 549 (60.3%) | 362 (39.7%) |
| 4+ Person Household | 814 (56.3%) | 631 (43.7%) |
| Total Housing Units | 3,581 (55.6%) | 2,860 (44.4%) |
Occupancy by Educational Attainment in Aberdeen
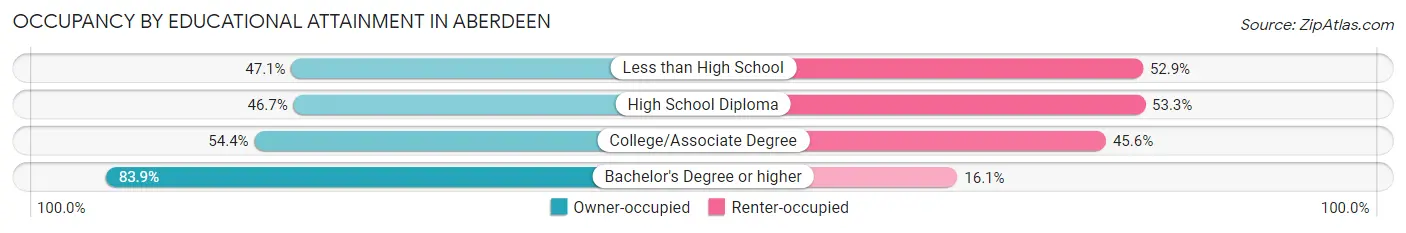
| Household Size | Owner-occupied | Renter-occupied |
| Less than High School | 424 (47.1%) | 476 (52.9%) |
| High School Diploma | 1,027 (46.7%) | 1,173 (53.3%) |
| College/Associate Degree | 1,244 (54.4%) | 1,041 (45.6%) |
| Bachelor's Degree or higher | 886 (83.9%) | 170 (16.1%) |
Occupancy by Age of Householder in Aberdeen
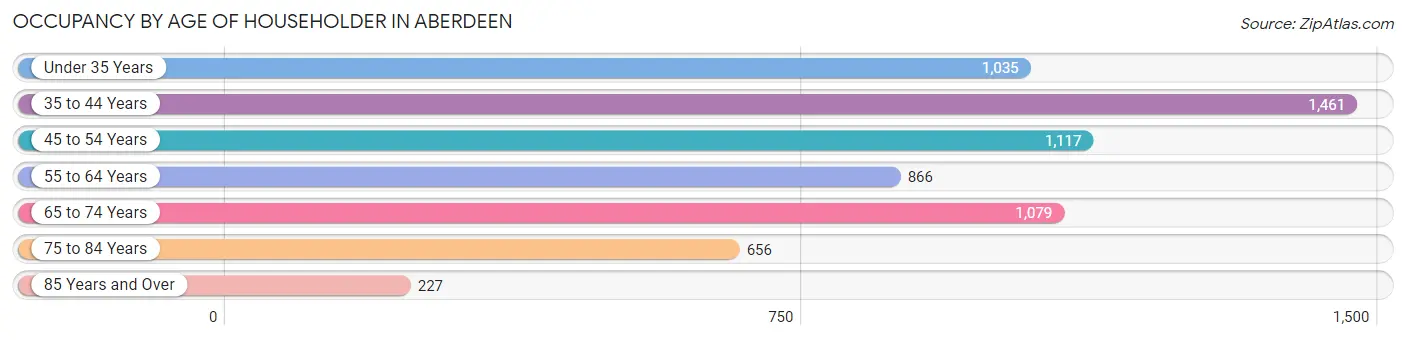
| Age Bracket | # Households | % Households |
| Under 35 Years | 1,035 | 16.1% |
| 35 to 44 Years | 1,461 | 22.7% |
| 45 to 54 Years | 1,117 | 17.3% |
| 55 to 64 Years | 866 | 13.5% |
| 65 to 74 Years | 1,079 | 16.8% |
| 75 to 84 Years | 656 | 10.2% |
| 85 Years and Over | 227 | 3.5% |
| Total | 6,441 | 100.0% |
Housing Finances in Aberdeen
Median Income by Occupancy in Aberdeen
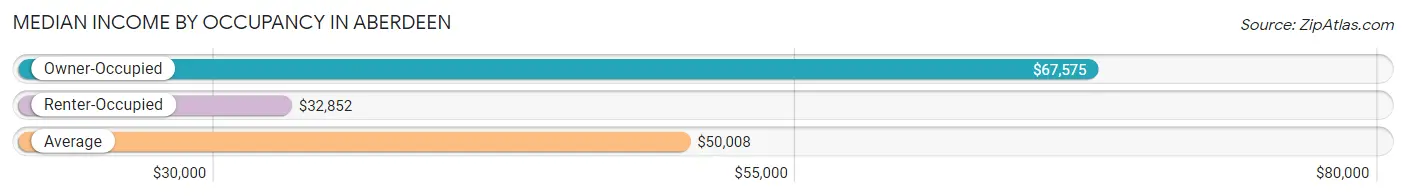
| Occupancy Type | # Households | Median Income |
| Owner-Occupied | 3,581 (55.6%) | $67,575 |
| Renter-Occupied | 2,860 (44.4%) | $32,852 |
| Average | 6,441 (100.0%) | $50,008 |
Occupancy by Householder Income Bracket in Aberdeen
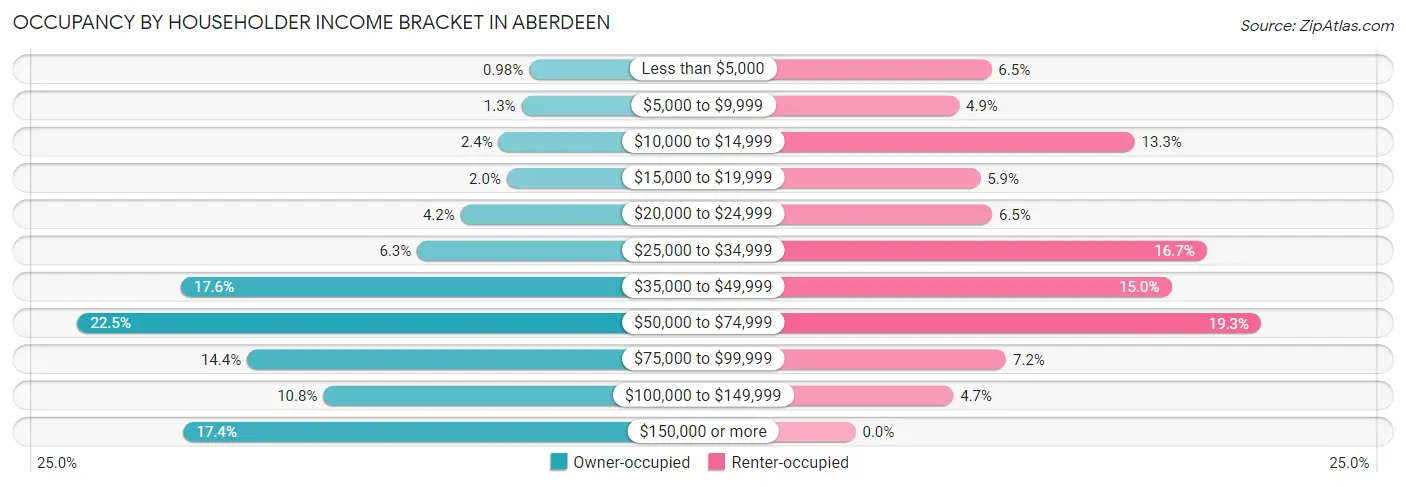
| Income Bracket | Owner-occupied | Renter-occupied |
| Less than $5,000 | 35 (1.0%) | 185 (6.5%) |
| $5,000 to $9,999 | 48 (1.3%) | 141 (4.9%) |
| $10,000 to $14,999 | 87 (2.4%) | 380 (13.3%) |
| $15,000 to $19,999 | 73 (2.0%) | 170 (5.9%) |
| $20,000 to $24,999 | 152 (4.2%) | 186 (6.5%) |
| $25,000 to $34,999 | 226 (6.3%) | 478 (16.7%) |
| $35,000 to $49,999 | 629 (17.6%) | 430 (15.0%) |
| $50,000 to $74,999 | 805 (22.5%) | 552 (19.3%) |
| $75,000 to $99,999 | 516 (14.4%) | 205 (7.2%) |
| $100,000 to $149,999 | 386 (10.8%) | 133 (4.6%) |
| $150,000 or more | 624 (17.4%) | 0 (0.0%) |
| Total | 3,581 (100.0%) | 2,860 (100.0%) |
Monthly Housing Cost Tiers in Aberdeen
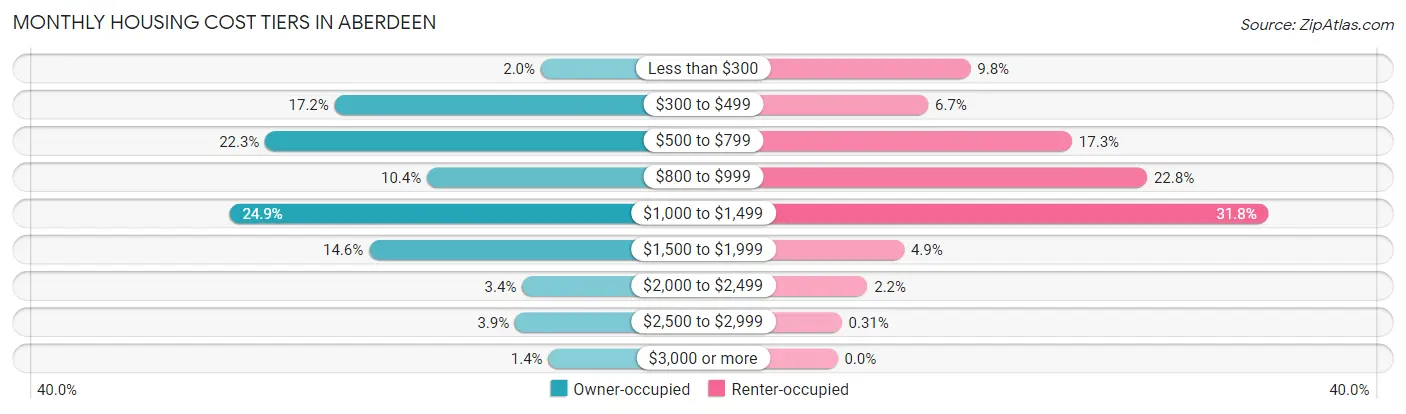
| Monthly Cost | Owner-occupied | Renter-occupied |
| Less than $300 | 71 (2.0%) | 280 (9.8%) |
| $300 to $499 | 615 (17.2%) | 191 (6.7%) |
| $500 to $799 | 798 (22.3%) | 494 (17.3%) |
| $800 to $999 | 371 (10.4%) | 652 (22.8%) |
| $1,000 to $1,499 | 892 (24.9%) | 908 (31.8%) |
| $1,500 to $1,999 | 524 (14.6%) | 140 (4.9%) |
| $2,000 to $2,499 | 120 (3.4%) | 63 (2.2%) |
| $2,500 to $2,999 | 139 (3.9%) | 9 (0.3%) |
| $3,000 or more | 51 (1.4%) | 0 (0.0%) |
| Total | 3,581 (100.0%) | 2,860 (100.0%) |
Physical Housing Characteristics in Aberdeen
Housing Structures in Aberdeen
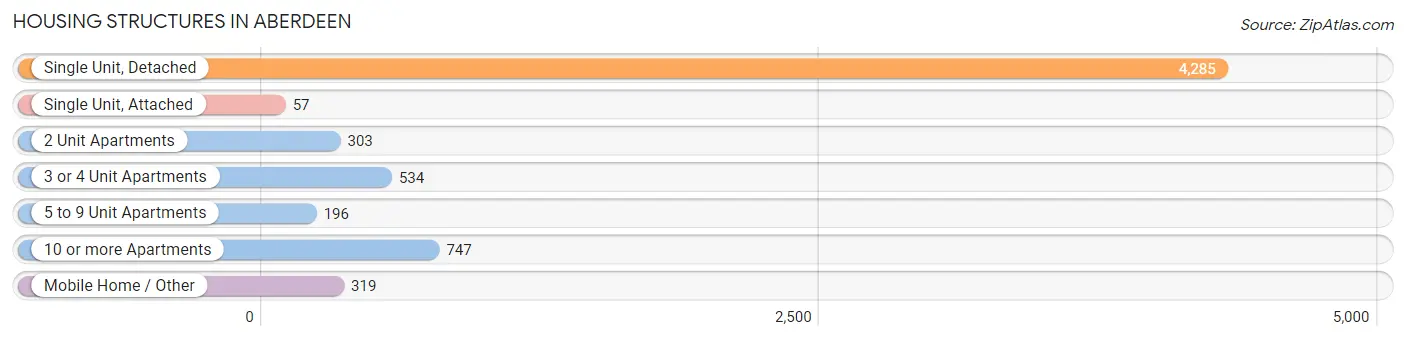
| Structure Type | # Housing Units | % Housing Units |
| Single Unit, Detached | 4,285 | 66.5% |
| Single Unit, Attached | 57 | 0.9% |
| 2 Unit Apartments | 303 | 4.7% |
| 3 or 4 Unit Apartments | 534 | 8.3% |
| 5 to 9 Unit Apartments | 196 | 3.0% |
| 10 or more Apartments | 747 | 11.6% |
| Mobile Home / Other | 319 | 5.0% |
| Total | 6,441 | 100.0% |
Housing Structures by Occupancy in Aberdeen
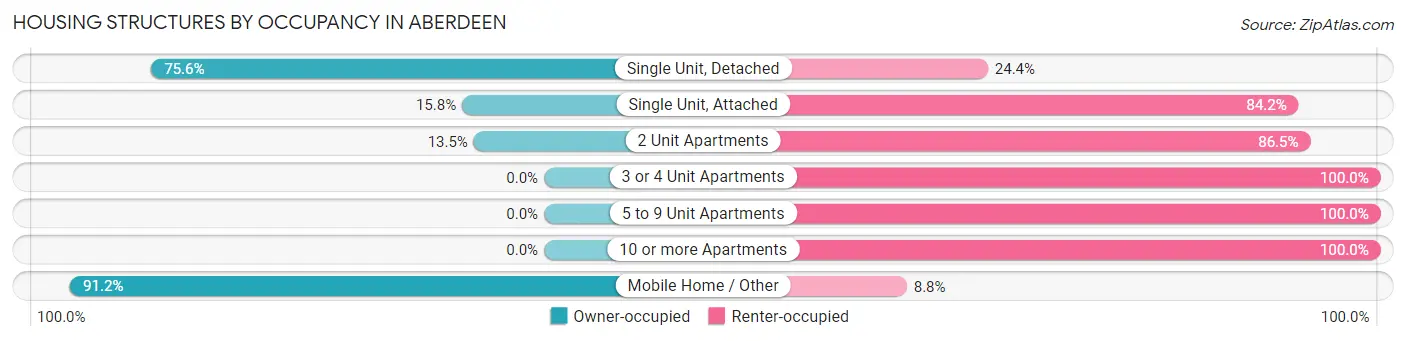
| Structure Type | Owner-occupied | Renter-occupied |
| Single Unit, Detached | 3,240 (75.6%) | 1,045 (24.4%) |
| Single Unit, Attached | 9 (15.8%) | 48 (84.2%) |
| 2 Unit Apartments | 41 (13.5%) | 262 (86.5%) |
| 3 or 4 Unit Apartments | 0 (0.0%) | 534 (100.0%) |
| 5 to 9 Unit Apartments | 0 (0.0%) | 196 (100.0%) |
| 10 or more Apartments | 0 (0.0%) | 747 (100.0%) |
| Mobile Home / Other | 291 (91.2%) | 28 (8.8%) |
| Total | 3,581 (55.6%) | 2,860 (44.4%) |
Housing Structures by Number of Rooms in Aberdeen
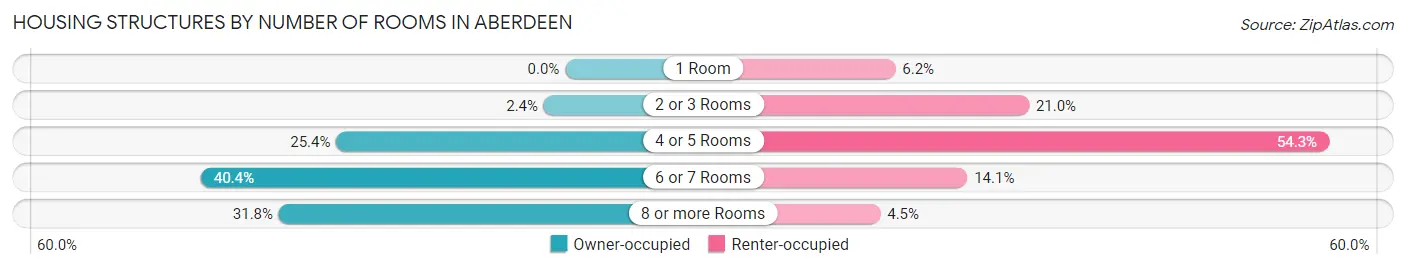
| Number of Rooms | Owner-occupied | Renter-occupied |
| 1 Room | 0 (0.0%) | 176 (6.1%) |
| 2 or 3 Rooms | 85 (2.4%) | 600 (21.0%) |
| 4 or 5 Rooms | 910 (25.4%) | 1,552 (54.3%) |
| 6 or 7 Rooms | 1,448 (40.4%) | 404 (14.1%) |
| 8 or more Rooms | 1,138 (31.8%) | 128 (4.5%) |
| Total | 3,581 (100.0%) | 2,860 (100.0%) |
Housing Structure by Heating Type in Aberdeen
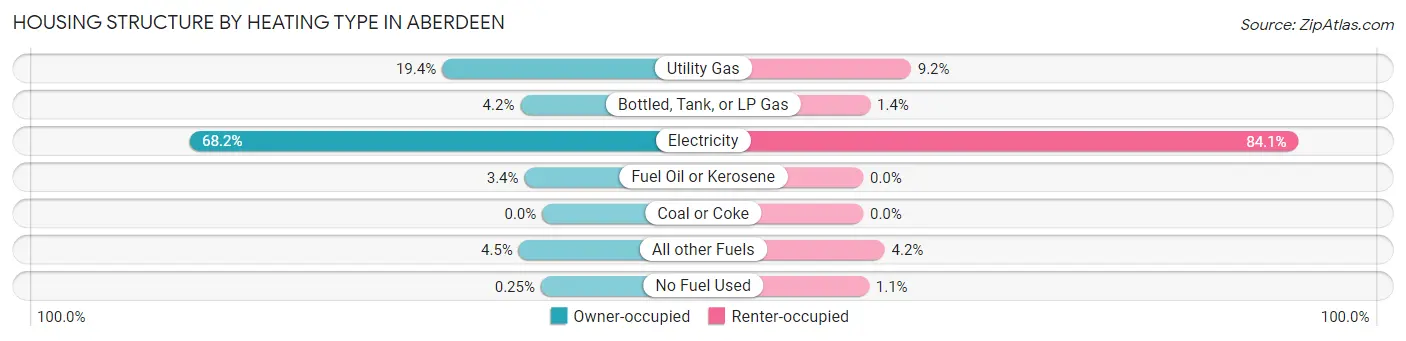
| Heating Type | Owner-occupied | Renter-occupied |
| Utility Gas | 693 (19.4%) | 264 (9.2%) |
| Bottled, Tank, or LP Gas | 151 (4.2%) | 39 (1.4%) |
| Electricity | 2,443 (68.2%) | 2,406 (84.1%) |
| Fuel Oil or Kerosene | 123 (3.4%) | 0 (0.0%) |
| Coal or Coke | 0 (0.0%) | 0 (0.0%) |
| All other Fuels | 162 (4.5%) | 119 (4.2%) |
| No Fuel Used | 9 (0.3%) | 32 (1.1%) |
| Total | 3,581 (100.0%) | 2,860 (100.0%) |
Household Vehicle Usage in Aberdeen
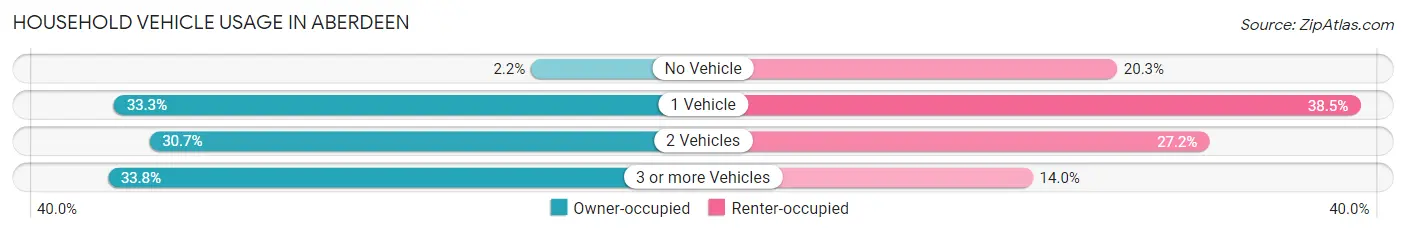
| Vehicles per Household | Owner-occupied | Renter-occupied |
| No Vehicle | 78 (2.2%) | 581 (20.3%) |
| 1 Vehicle | 1,194 (33.3%) | 1,100 (38.5%) |
| 2 Vehicles | 1,099 (30.7%) | 778 (27.2%) |
| 3 or more Vehicles | 1,210 (33.8%) | 401 (14.0%) |
| Total | 3,581 (100.0%) | 2,860 (100.0%) |
Real Estate & Mortgages in Aberdeen
Real Estate and Mortgage Overview in Aberdeen
| Characteristic | Without Mortgage | With Mortgage |
| Housing Units | 1,553 | 2,028 |
| Median Property Value | $172,500 | $226,900 |
| Median Household Income | $55,619 | $476 |
| Monthly Housing Costs | $528 | $51 |
| Real Estate Taxes | $1,701 | $159 |
Property Value by Mortgage Status in Aberdeen
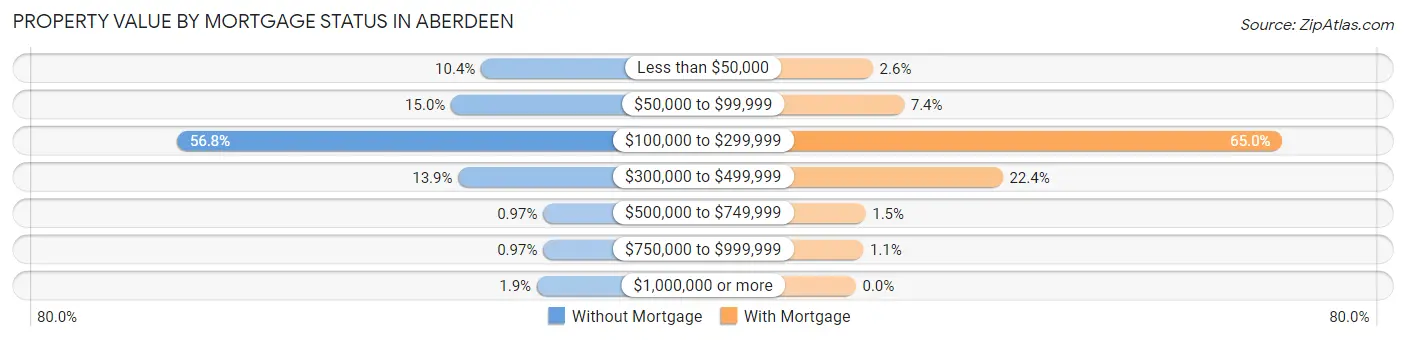
| Property Value | Without Mortgage | With Mortgage |
| Less than $50,000 | 162 (10.4%) | 53 (2.6%) |
| $50,000 to $99,999 | 233 (15.0%) | 149 (7.3%) |
| $100,000 to $299,999 | 882 (56.8%) | 1,319 (65.0%) |
| $300,000 to $499,999 | 216 (13.9%) | 454 (22.4%) |
| $500,000 to $749,999 | 15 (1.0%) | 30 (1.5%) |
| $750,000 to $999,999 | 15 (1.0%) | 23 (1.1%) |
| $1,000,000 or more | 30 (1.9%) | 0 (0.0%) |
| Total | 1,553 (100.0%) | 2,028 (100.0%) |
Household Income by Mortgage Status in Aberdeen
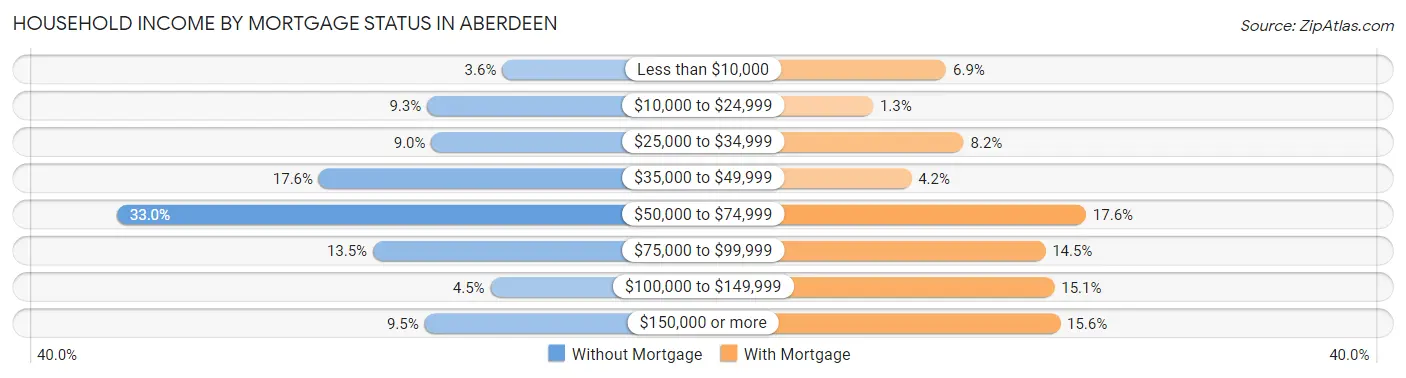
| Household Income | Without Mortgage | With Mortgage |
| Less than $10,000 | 56 (3.6%) | 140 (6.9%) |
| $10,000 to $24,999 | 145 (9.3%) | 27 (1.3%) |
| $25,000 to $34,999 | 140 (9.0%) | 167 (8.2%) |
| $35,000 to $49,999 | 273 (17.6%) | 86 (4.2%) |
| $50,000 to $74,999 | 512 (33.0%) | 356 (17.5%) |
| $75,000 to $99,999 | 209 (13.5%) | 293 (14.4%) |
| $100,000 to $149,999 | 70 (4.5%) | 307 (15.1%) |
| $150,000 or more | 148 (9.5%) | 316 (15.6%) |
| Total | 1,553 (100.0%) | 2,028 (100.0%) |
Property Value to Household Income Ratio in Aberdeen
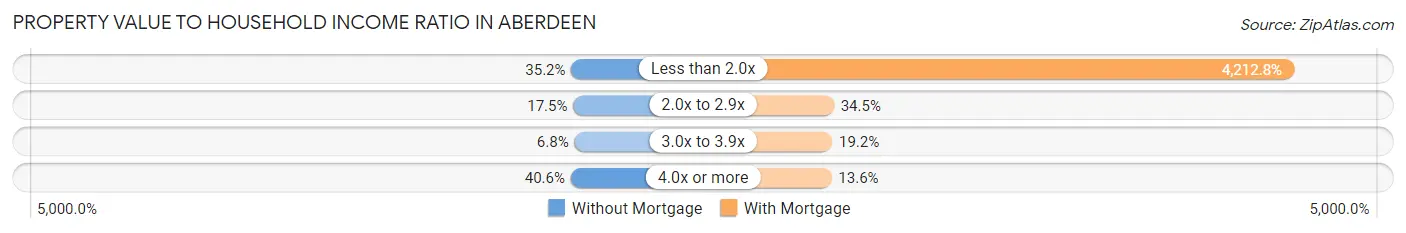
| Value-to-Income Ratio | Without Mortgage | With Mortgage |
| Less than 2.0x | 546 (35.2%) | 85,435 (4,212.8%) |
| 2.0x to 2.9x | 271 (17.4%) | 700 (34.5%) |
| 3.0x to 3.9x | 106 (6.8%) | 389 (19.2%) |
| 4.0x or more | 630 (40.6%) | 275 (13.6%) |
| Total | 1,553 (100.0%) | 2,028 (100.0%) |
Real Estate Taxes by Mortgage Status in Aberdeen
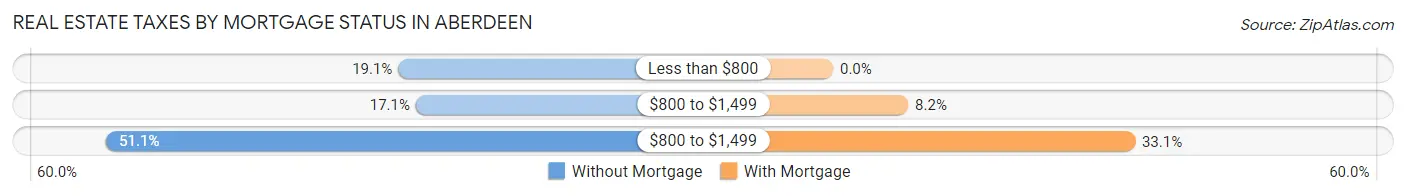
| Property Taxes | Without Mortgage | With Mortgage |
| Less than $800 | 296 (19.1%) | 0 (0.0%) |
| $800 to $1,499 | 266 (17.1%) | 167 (8.2%) |
| $800 to $1,499 | 793 (51.1%) | 671 (33.1%) |
| Total | 1,553 (100.0%) | 2,028 (100.0%) |
Health & Disability in Aberdeen
Health Insurance Coverage by Age in Aberdeen
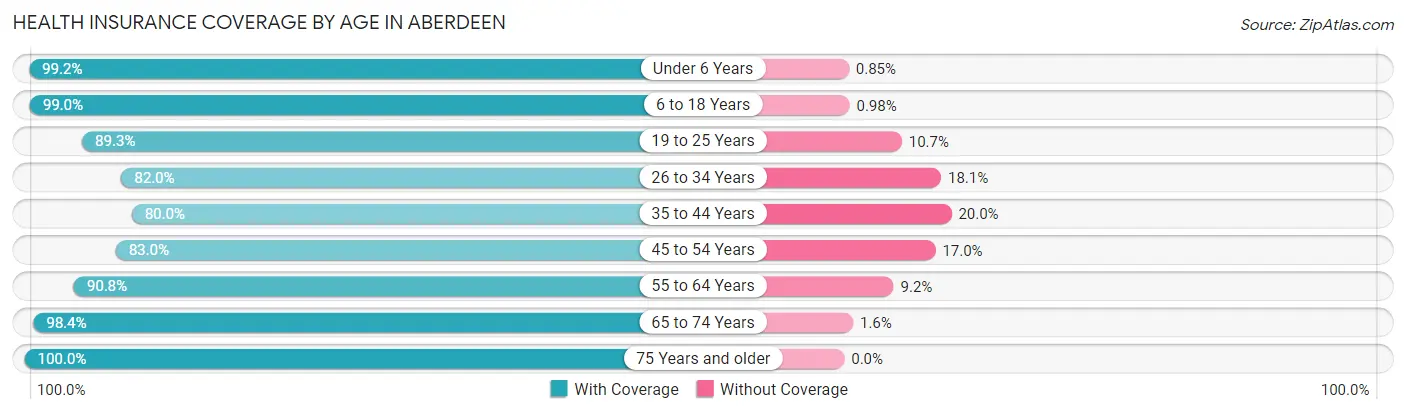
| Age Bracket | With Coverage | Without Coverage |
| Under 6 Years | 1,161 (99.2%) | 10 (0.9%) |
| 6 to 18 Years | 3,437 (99.0%) | 34 (1.0%) |
| 19 to 25 Years | 1,266 (89.3%) | 152 (10.7%) |
| 26 to 34 Years | 1,394 (82.0%) | 307 (18.0%) |
| 35 to 44 Years | 2,107 (80.0%) | 526 (20.0%) |
| 45 to 54 Years | 1,465 (83.0%) | 300 (17.0%) |
| 55 to 64 Years | 1,590 (90.8%) | 161 (9.2%) |
| 65 to 74 Years | 1,632 (98.4%) | 27 (1.6%) |
| 75 Years and older | 1,219 (100.0%) | 0 (0.0%) |
| Total | 15,271 (91.0%) | 1,517 (9.0%) |
Health Insurance Coverage by Citizenship Status in Aberdeen
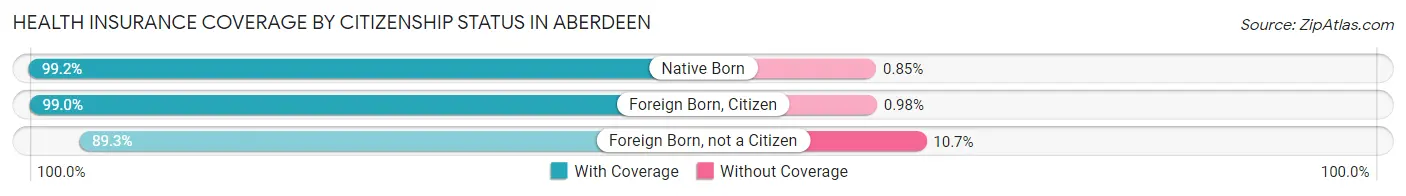
| Citizenship Status | With Coverage | Without Coverage |
| Native Born | 1,161 (99.2%) | 10 (0.9%) |
| Foreign Born, Citizen | 3,437 (99.0%) | 34 (1.0%) |
| Foreign Born, not a Citizen | 1,266 (89.3%) | 152 (10.7%) |
Health Insurance Coverage by Household Income in Aberdeen
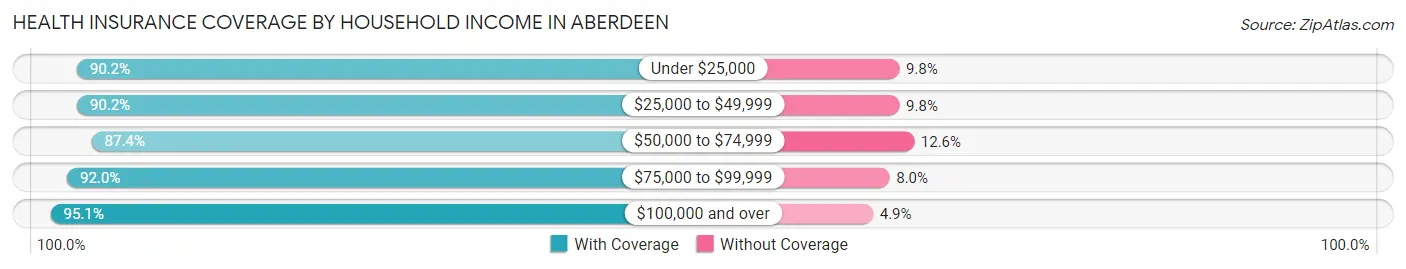
| Household Income | With Coverage | Without Coverage |
| Under $25,000 | 2,030 (90.2%) | 220 (9.8%) |
| $25,000 to $49,999 | 3,420 (90.2%) | 372 (9.8%) |
| $50,000 to $74,999 | 3,864 (87.4%) | 555 (12.6%) |
| $75,000 to $99,999 | 2,001 (92.0%) | 173 (8.0%) |
| $100,000 and over | 3,850 (95.1%) | 197 (4.9%) |
Public vs Private Health Insurance Coverage by Age in Aberdeen
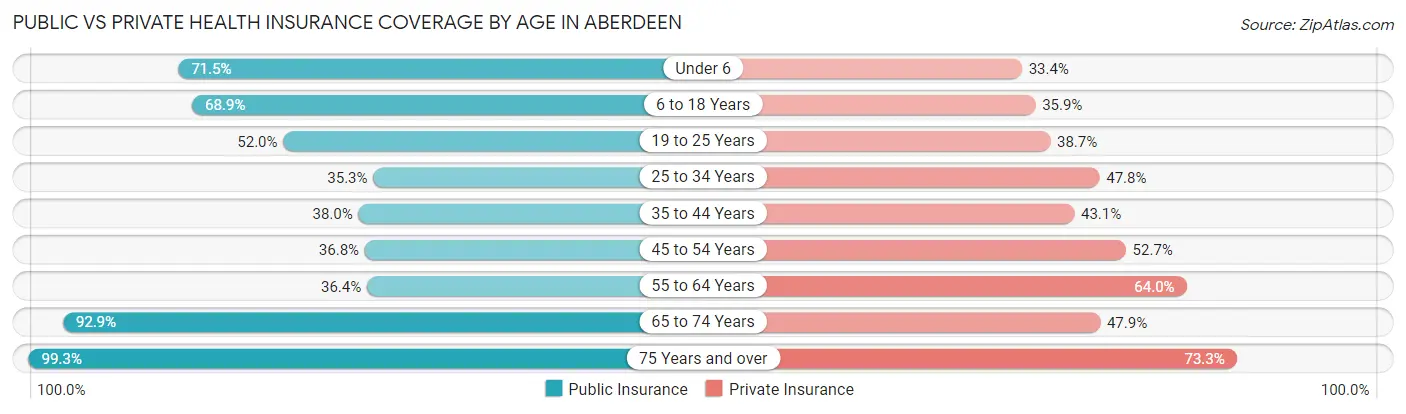
| Age Bracket | Public Insurance | Private Insurance |
| Under 6 | 837 (71.5%) | 391 (33.4%) |
| 6 to 18 Years | 2,392 (68.9%) | 1,246 (35.9%) |
| 19 to 25 Years | 737 (52.0%) | 548 (38.7%) |
| 25 to 34 Years | 600 (35.3%) | 813 (47.8%) |
| 35 to 44 Years | 1,001 (38.0%) | 1,135 (43.1%) |
| 45 to 54 Years | 650 (36.8%) | 930 (52.7%) |
| 55 to 64 Years | 638 (36.4%) | 1,120 (64.0%) |
| 65 to 74 Years | 1,541 (92.9%) | 795 (47.9%) |
| 75 Years and over | 1,210 (99.3%) | 893 (73.3%) |
| Total | 9,606 (57.2%) | 7,871 (46.9%) |
Disability Status by Sex by Age in Aberdeen
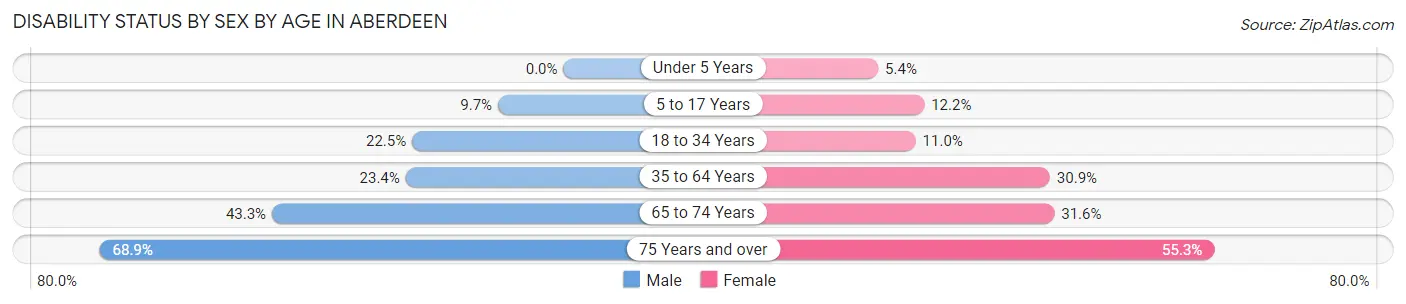
| Age Bracket | Male | Female |
| Under 5 Years | 0 (0.0%) | 35 (5.4%) |
| 5 to 17 Years | 178 (9.7%) | 187 (12.2%) |
| 18 to 34 Years | 407 (22.5%) | 169 (11.0%) |
| 35 to 64 Years | 751 (23.4%) | 909 (30.9%) |
| 65 to 74 Years | 312 (43.3%) | 296 (31.6%) |
| 75 Years and over | 325 (68.9%) | 413 (55.3%) |
Disability Class by Sex by Age in Aberdeen
Disability Class: Hearing Difficulty
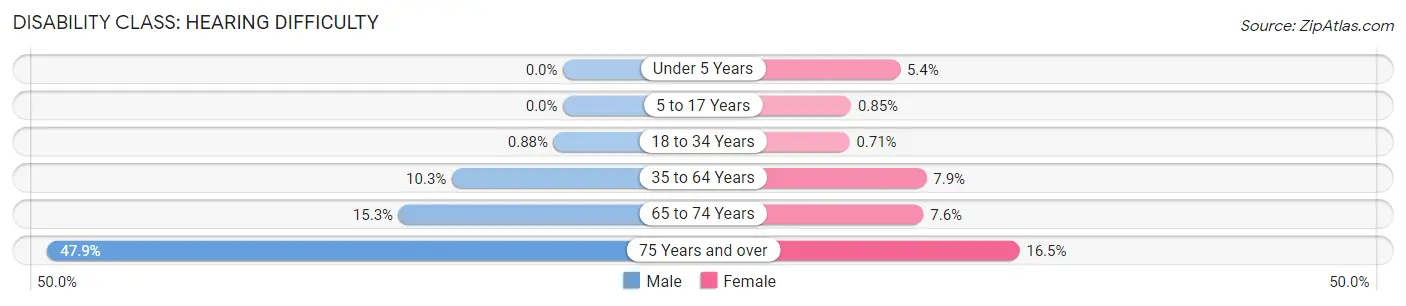
| Age Bracket | Male | Female |
| Under 5 Years | 0 (0.0%) | 35 (5.4%) |
| 5 to 17 Years | 0 (0.0%) | 13 (0.9%) |
| 18 to 34 Years | 16 (0.9%) | 11 (0.7%) |
| 35 to 64 Years | 331 (10.3%) | 231 (7.9%) |
| 65 to 74 Years | 110 (15.3%) | 71 (7.6%) |
| 75 Years and over | 226 (47.9%) | 123 (16.5%) |
Disability Class: Vision Difficulty
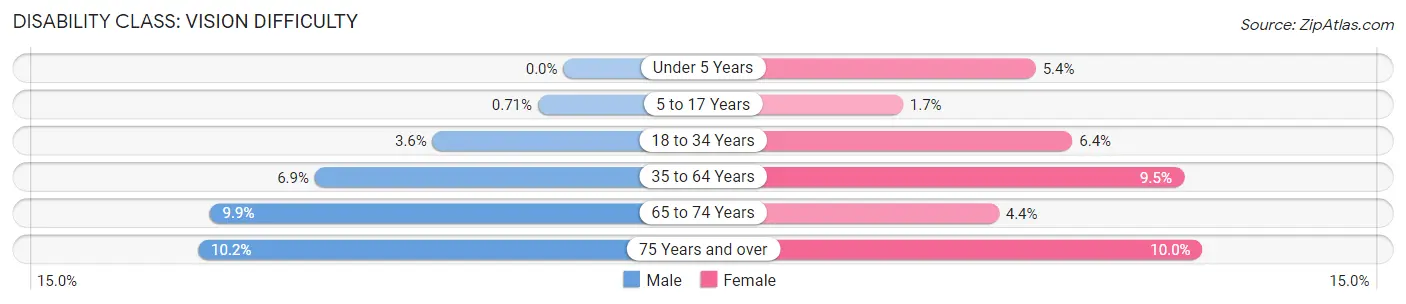
| Age Bracket | Male | Female |
| Under 5 Years | 0 (0.0%) | 35 (5.4%) |
| 5 to 17 Years | 13 (0.7%) | 26 (1.7%) |
| 18 to 34 Years | 66 (3.6%) | 99 (6.4%) |
| 35 to 64 Years | 222 (6.9%) | 280 (9.5%) |
| 65 to 74 Years | 71 (9.9%) | 41 (4.4%) |
| 75 Years and over | 48 (10.2%) | 75 (10.0%) |
Disability Class: Cognitive Difficulty
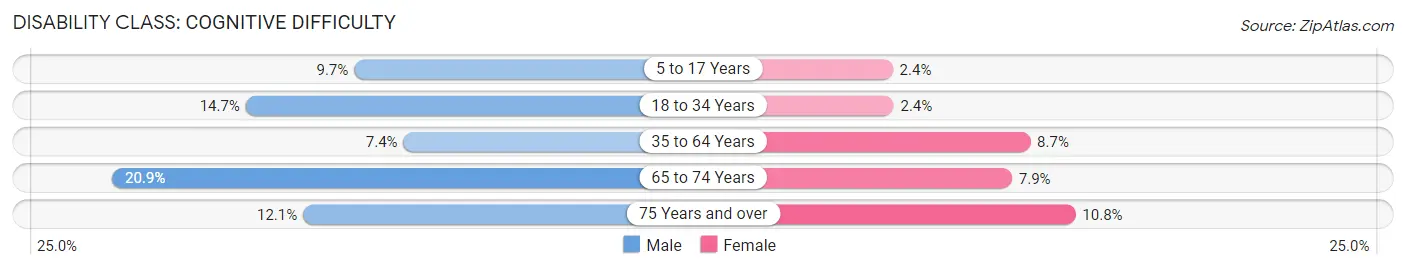
| Age Bracket | Male | Female |
| 5 to 17 Years | 178 (9.7%) | 36 (2.4%) |
| 18 to 34 Years | 267 (14.7%) | 37 (2.4%) |
| 35 to 64 Years | 238 (7.4%) | 257 (8.7%) |
| 65 to 74 Years | 151 (20.9%) | 74 (7.9%) |
| 75 Years and over | 57 (12.1%) | 81 (10.8%) |
Disability Class: Ambulatory Difficulty
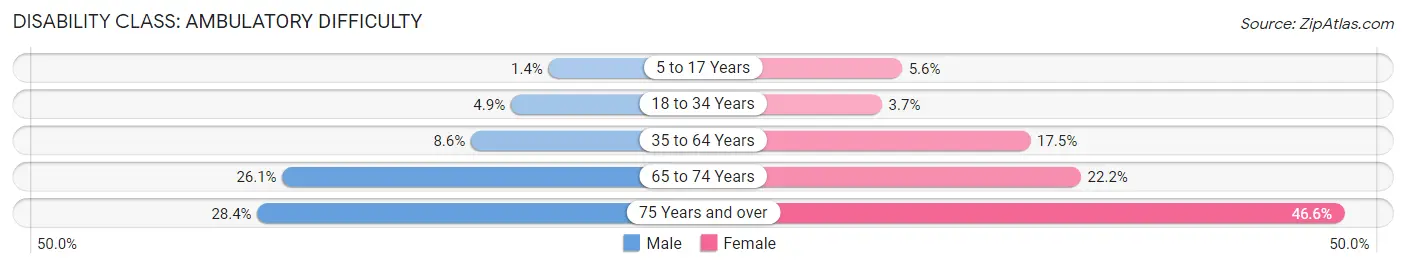
| Age Bracket | Male | Female |
| 5 to 17 Years | 25 (1.4%) | 85 (5.6%) |
| 18 to 34 Years | 88 (4.9%) | 57 (3.7%) |
| 35 to 64 Years | 275 (8.6%) | 514 (17.5%) |
| 65 to 74 Years | 188 (26.1%) | 208 (22.2%) |
| 75 Years and over | 134 (28.4%) | 348 (46.6%) |
Disability Class: Self-Care Difficulty
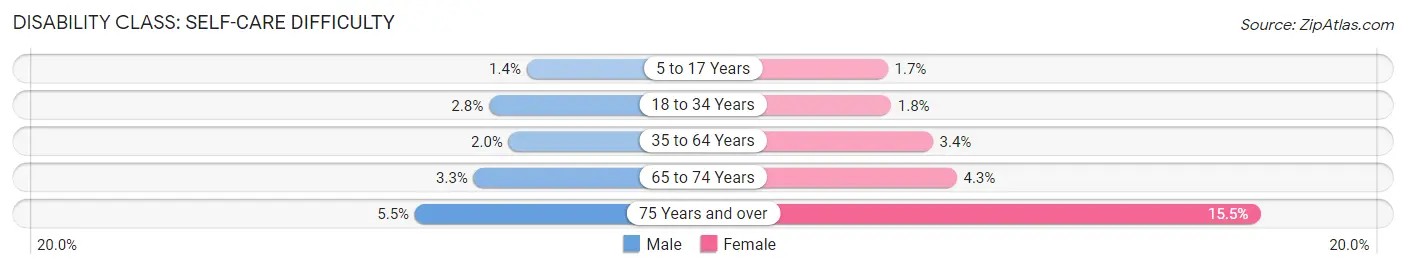
| Age Bracket | Male | Female |
| 5 to 17 Years | 25 (1.4%) | 26 (1.7%) |
| 18 to 34 Years | 50 (2.8%) | 28 (1.8%) |
| 35 to 64 Years | 65 (2.0%) | 99 (3.4%) |
| 65 to 74 Years | 24 (3.3%) | 40 (4.3%) |
| 75 Years and over | 26 (5.5%) | 116 (15.5%) |
Technology Access in Aberdeen
Computing Device Access in Aberdeen
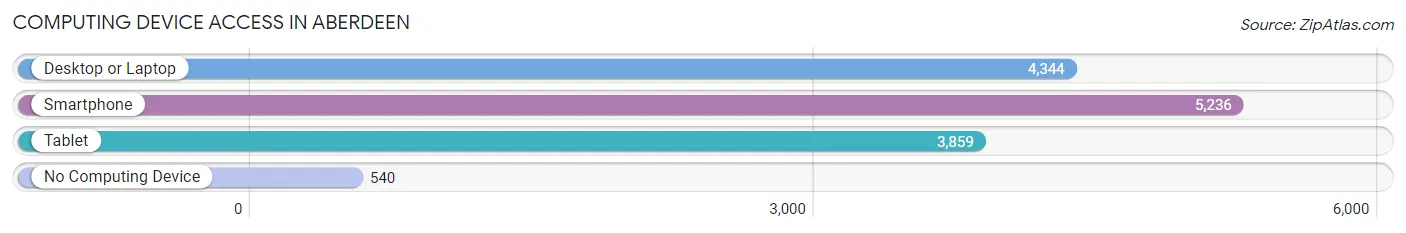
| Device Type | # Households | % Households |
| Desktop or Laptop | 4,344 | 67.4% |
| Smartphone | 5,236 | 81.3% |
| Tablet | 3,859 | 59.9% |
| No Computing Device | 540 | 8.4% |
| Total | 6,441 | 100.0% |
Internet Access in Aberdeen
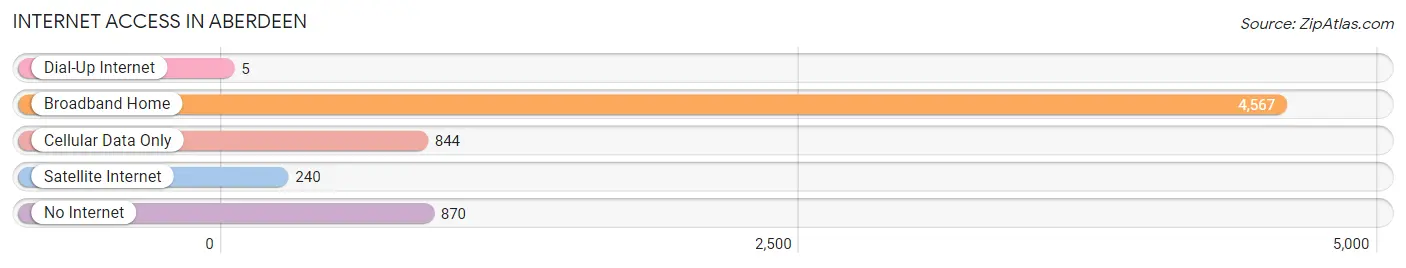
| Internet Type | # Households | % Households |
| Dial-Up Internet | 5 | 0.1% |
| Broadband Home | 4,567 | 70.9% |
| Cellular Data Only | 844 | 13.1% |
| Satellite Internet | 240 | 3.7% |
| No Internet | 870 | 13.5% |
| Total | 6,441 | 100.0% |
Aberdeen Summary
Aberdeen, Washington is a city located in Grays Harbor County, Washington, United States. It is the county seat of Grays Harbor County and is located on the Chehalis River, approximately 25 miles from the Pacific Ocean. The city has a population of 16,737 as of the 2010 census, making it the largest city in Grays Harbor County.
History
The area that is now Aberdeen was first inhabited by the Chehalis people, a Native American tribe of the Salishan language family. The first European settlers arrived in the area in the late 1850s, and the city was officially incorporated in 1890. The city was named after Aberdeen, Scotland, by a Scottish settler, Samuel Benn.
The city quickly grew in the late 19th century, becoming a major port and logging center. The city was also home to a large shipbuilding industry, which produced many of the ships used in World War I and World War II.
Geography
Aberdeen is located in Grays Harbor County, Washington, at the mouth of the Chehalis River. The city is located on the western edge of the Olympic Peninsula, approximately 25 miles from the Pacific Ocean. The city has a total area of 8.3 square miles, of which 8.2 square miles is land and 0.1 square miles is water.
The city is located in a temperate rainforest climate, with mild temperatures and abundant rainfall. The average annual precipitation is approximately 50 inches, with most of the precipitation occurring in the winter months.
Economy
Aberdeen is the economic center of Grays Harbor County, and is home to a variety of industries. The city is home to a large port, which is used for shipping timber, seafood, and other goods. The city is also home to a large paper mill, which produces paper products for the local and regional markets.
The city is also home to a large tourism industry, with many visitors coming to the city to enjoy the nearby beaches, forests, and other attractions. The city is also home to a large fishing industry, with many of the local seafood products being shipped to markets around the world.
Demographics
As of the 2010 census, the city had a population of 16,737. The racial makeup of the city was 84.3% White, 2.2% African American, 1.2% Native American, 1.7% Asian, 0.2% Pacific Islander, 8.2% from other races, and 2.4% from two or more races. Hispanic or Latino of any race were 15.2% of the population.
The median income for a household in the city was $35,945, and the median income for a family was $41,945. The per capita income for the city was $17,845. About 16.2% of families and 19.3% of the population were below the poverty line, including 28.2% of those under age 18 and 8.2% of those age 65 or over.
Common Questions
What is Per Capita Income in Aberdeen?
Per Capita income in Aberdeen is $28,210.
What is the Median Family Income in Aberdeen?
Median Family Income in Aberdeen is $63,563.
What is the Median Household income in Aberdeen?
Median Household Income in Aberdeen is $50,008.
What is Income or Wage Gap in Aberdeen?
Income or Wage Gap in Aberdeen is 24.3%.
Women in Aberdeen earn 75.7 cents for every dollar earned by a man.
What is Family Income Deficit in Aberdeen?
Family Income Deficit in Aberdeen is $11,400.
Families that are below poverty line in Aberdeen earn $11,400 less on average than the poverty threshold level.
What is Inequality or Gini Index in Aberdeen?
Inequality or Gini Index in Aberdeen is 0.48.
What is the Total Population of Aberdeen?
Total Population of Aberdeen is 16,969.
What is the Total Male Population of Aberdeen?
Total Male Population of Aberdeen is 8,529.
What is the Total Female Population of Aberdeen?
Total Female Population of Aberdeen is 8,440.
What is the Ratio of Males per 100 Females in Aberdeen?
There are 101.05 Males per 100 Females in Aberdeen.
What is the Ratio of Females per 100 Males in Aberdeen?
There are 98.96 Females per 100 Males in Aberdeen.
What is the Median Population Age in Aberdeen?
Median Population Age in Aberdeen is 37.1 Years.
What is the Average Family Size in Aberdeen
Average Family Size in Aberdeen is 3.4 People.
What is the Average Household Size in Aberdeen
Average Household Size in Aberdeen is 2.6 People.
How Large is the Labor Force in Aberdeen?
There are 7,199 People in the Labor Forcein in Aberdeen.
What is the Percentage of People in the Labor Force in Aberdeen?
54.8% of People are in the Labor Force in Aberdeen.
What is the Unemployment Rate in Aberdeen?
Unemployment Rate in Aberdeen is 6.3%.