Cities with the Most Immigrants from Malaysia in Washington
RELATED REPORTS & OPTIONS
Malaysia
Washington
Compare Cities
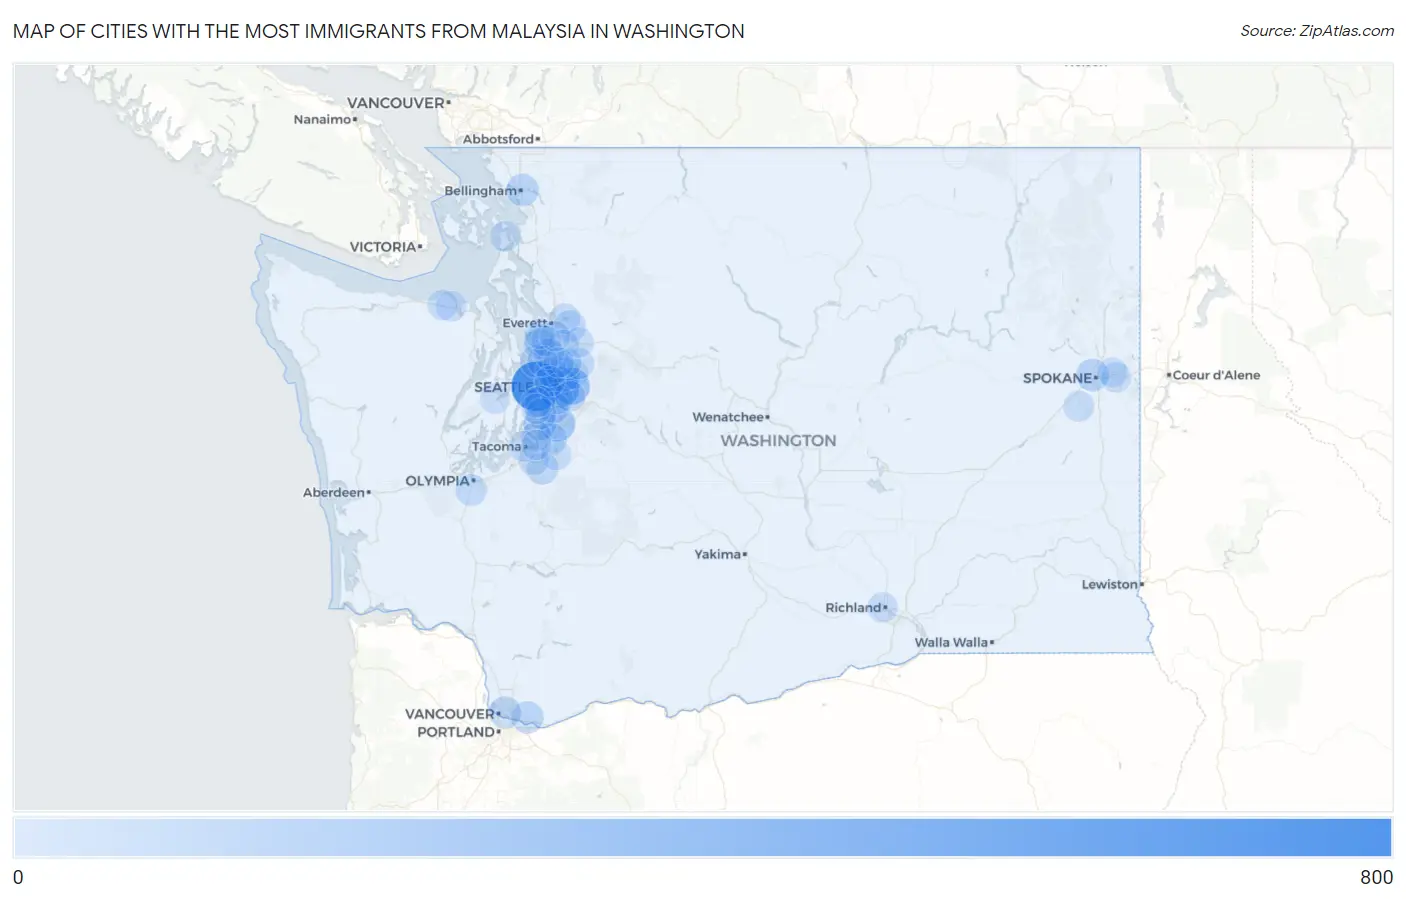
Map of Cities with the Most Immigrants from Malaysia in Washington
0
800
Cities with the Most Immigrants from Malaysia in Washington
| City | Malaysia | vs State | vs National | |
| 1. | Seattle | 636 | 2,941(21.63%)#1 | 82,574(0.77%)#12 |
| 2. | Bellevue | 340 | 2,941(11.56%)#2 | 82,574(0.41%)#28 |
| 3. | Sammamish | 220 | 2,941(7.48%)#3 | 82,574(0.27%)#45 |
| 4. | Kent | 173 | 2,941(5.88%)#4 | 82,574(0.21%)#69 |
| 5. | Redmond | 101 | 2,941(3.43%)#5 | 82,574(0.12%)#133 |
| 6. | Des Moines | 92 | 2,941(3.13%)#6 | 82,574(0.11%)#149 |
| 7. | Spokane | 80 | 2,941(2.72%)#7 | 82,574(0.10%)#174 |
| 8. | Shoreline | 78 | 2,941(2.65%)#8 | 82,574(0.09%)#178 |
| 9. | Bellingham | 70 | 2,941(2.38%)#9 | 82,574(0.08%)#201 |
| 10. | Camas | 66 | 2,941(2.24%)#10 | 82,574(0.08%)#214 |
| 11. | Vancouver | 65 | 2,941(2.21%)#11 | 82,574(0.08%)#216 |
| 12. | Fairwood Cdp King County | 55 | 2,941(1.87%)#12 | 82,574(0.07%)#269 |
| 13. | Everett | 54 | 2,941(1.84%)#13 | 82,574(0.07%)#270 |
| 14. | South Hill | 49 | 2,941(1.67%)#14 | 82,574(0.06%)#296 |
| 15. | Auburn | 46 | 2,941(1.56%)#15 | 82,574(0.06%)#317 |
| 16. | Tumwater | 43 | 2,941(1.46%)#16 | 82,574(0.05%)#332 |
| 17. | Picnic Point | 40 | 2,941(1.36%)#17 | 82,574(0.05%)#359 |
| 18. | Renton | 38 | 2,941(1.29%)#18 | 82,574(0.05%)#371 |
| 19. | Union Hill Novelty Hill | 35 | 2,941(1.19%)#19 | 82,574(0.04%)#404 |
| 20. | Bothell | 31 | 2,941(1.05%)#20 | 82,574(0.04%)#454 |
| 21. | Duvall | 29 | 2,941(0.99%)#21 | 82,574(0.04%)#474 |
| 22. | Newcastle | 28 | 2,941(0.95%)#22 | 82,574(0.03%)#490 |
| 23. | Kirkland | 23 | 2,941(0.78%)#23 | 82,574(0.03%)#547 |
| 24. | Boulevard Park | 19 | 2,941(0.65%)#24 | 82,574(0.02%)#629 |
| 25. | Meadowdale | 19 | 2,941(0.65%)#25 | 82,574(0.02%)#633 |
| 26. | Seatac | 18 | 2,941(0.61%)#26 | 82,574(0.02%)#642 |
| 27. | Lake Stevens | 17 | 2,941(0.58%)#27 | 82,574(0.02%)#665 |
| 28. | Cheney | 17 | 2,941(0.58%)#28 | 82,574(0.02%)#673 |
| 29. | Summit | 17 | 2,941(0.58%)#29 | 82,574(0.02%)#678 |
| 30. | Cathcart | 16 | 2,941(0.54%)#30 | 82,574(0.02%)#712 |
| 31. | Issaquah | 15 | 2,941(0.51%)#31 | 82,574(0.02%)#734 |
| 32. | Bothell West | 15 | 2,941(0.51%)#32 | 82,574(0.02%)#740 |
| 33. | Cottage Lake | 14 | 2,941(0.48%)#33 | 82,574(0.02%)#772 |
| 34. | Bonney Lake | 14 | 2,941(0.48%)#34 | 82,574(0.02%)#773 |
| 35. | Lake Forest Park | 14 | 2,941(0.48%)#35 | 82,574(0.02%)#783 |
| 36. | Federal Way | 13 | 2,941(0.44%)#36 | 82,574(0.02%)#798 |
| 37. | Lake Stickney | 13 | 2,941(0.44%)#37 | 82,574(0.02%)#816 |
| 38. | Clyde Hill | 13 | 2,941(0.44%)#38 | 82,574(0.02%)#826 |
| 39. | Richland | 12 | 2,941(0.41%)#39 | 82,574(0.01%)#835 |
| 40. | Monroe | 11 | 2,941(0.37%)#40 | 82,574(0.01%)#904 |
| 41. | Sequim | 11 | 2,941(0.37%)#41 | 82,574(0.01%)#915 |
| 42. | Spokane Valley | 10 | 2,941(0.34%)#42 | 82,574(0.01%)#923 |
| 43. | Bremerton | 9 | 2,941(0.31%)#43 | 82,574(0.01%)#977 |
| 44. | Anacortes | 9 | 2,941(0.31%)#44 | 82,574(0.01%)#995 |
| 45. | Carlsborg | 9 | 2,941(0.31%)#45 | 82,574(0.01%)#1,010 |
| 46. | Tacoma | 8 | 2,941(0.27%)#46 | 82,574(0.01%)#1,013 |
| 47. | Woodinville | 8 | 2,941(0.27%)#47 | 82,574(0.01%)#1,039 |
| 48. | Mukilteo | 6 | 2,941(0.20%)#48 | 82,574(0.01%)#1,111 |
| 49. | Fife Heights | 6 | 2,941(0.20%)#49 | 82,574(0.01%)#1,135 |
| 50. | Burien | 4 | 2,941(0.14%)#50 | 82,574(0.00%)#1,194 |
| 51. | Eastmont | 4 | 2,941(0.14%)#51 | 82,574(0.00%)#1,197 |
| 52. | White Center | 4 | 2,941(0.14%)#52 | 82,574(0.00%)#1,204 |
| 53. | Millwood | 3 | 2,941(0.10%)#53 | 82,574(0.00%)#1,237 |
Common Questions
What are the Top 10 Cities with the Most Immigrants from Malaysia in Washington?
Top 10 Cities with the Most Immigrants from Malaysia in Washington are:
#1
636
#2
340
#3
220
#4
173
#5
101
#6
92
#7
80
#8
78
#9
70
#10
66
What city has the Most Immigrants from Malaysia in Washington?
Seattle has the Most Immigrants from Malaysia in Washington with 636.
What is the Total Immigrants from Malaysia in the State of Washington?
Total Immigrants from Malaysia in Washington is 2,941.
What is the Total Immigrants from Malaysia in the United States?
Total Immigrants from Malaysia in the United States is 82,574.