Walla Walla, WA Map & Demographics
Walla Walla Map
Walla Walla Overview
$31,801
PER CAPITA INCOME
$82,032
AVG FAMILY INCOME
$58,179
AVG HOUSEHOLD INCOME
34.8%
WAGE / INCOME GAP [ % ]
65.2¢/ $1
WAGE / INCOME GAP [ $ ]
0.46
INEQUALITY / GINI INDEX
33,842
TOTAL POPULATION
17,468
MALE POPULATION
16,374
FEMALE POPULATION
106.68
MALES / 100 FEMALES
93.74
FEMALES / 100 MALES
37.2
MEDIAN AGE
3.1
AVG FAMILY SIZE
2.4
AVG HOUSEHOLD SIZE
16,057
LABOR FORCE [ PEOPLE ]
56.8%
PERCENT IN LABOR FORCE
6.1%
UNEMPLOYMENT RATE
Walla Walla Zip Codes
Walla Walla Area Codes
Income in Walla Walla
Income Overview in Walla Walla
Per Capita Income in Walla Walla is $31,801, while median incomes of families and households are $82,032 and $58,179 respectively.
| Characteristic | Number | Measure |
| Per Capita Income | 33,842 | $31,801 |
| Median Family Income | 7,155 | $82,032 |
| Mean Family Income | 7,155 | $104,472 |
| Median Household Income | 12,865 | $58,179 |
| Mean Household Income | 12,865 | $79,182 |
| Income Deficit | 7,155 | $0 |
| Wage / Income Gap (%) | 33,842 | 34.76% |
| Wage / Income Gap ($) | 33,842 | 65.24¢ per $1 |
| Gini / Inequality Index | 33,842 | 0.46 |
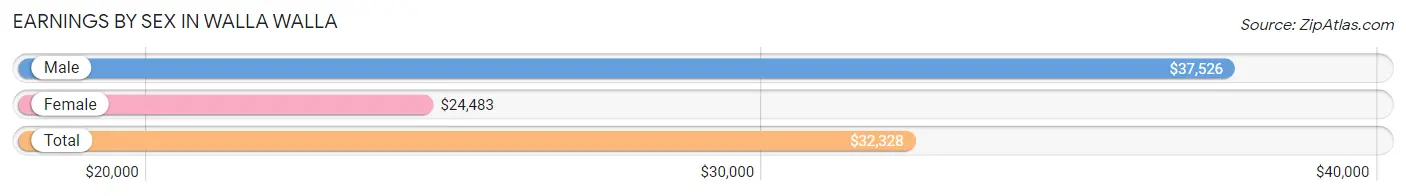
Earnings by Sex in Walla Walla
Average Earnings in Walla Walla are $32,328, $37,526 for men and $24,483 for women, a difference of 34.8%.
| Sex | Number | Average Earnings |
| Male | 9,045 (50.8%) | $37,526 |
| Female | 8,770 (49.2%) | $24,483 |
| Total | 17,815 (100.0%) | $32,328 |
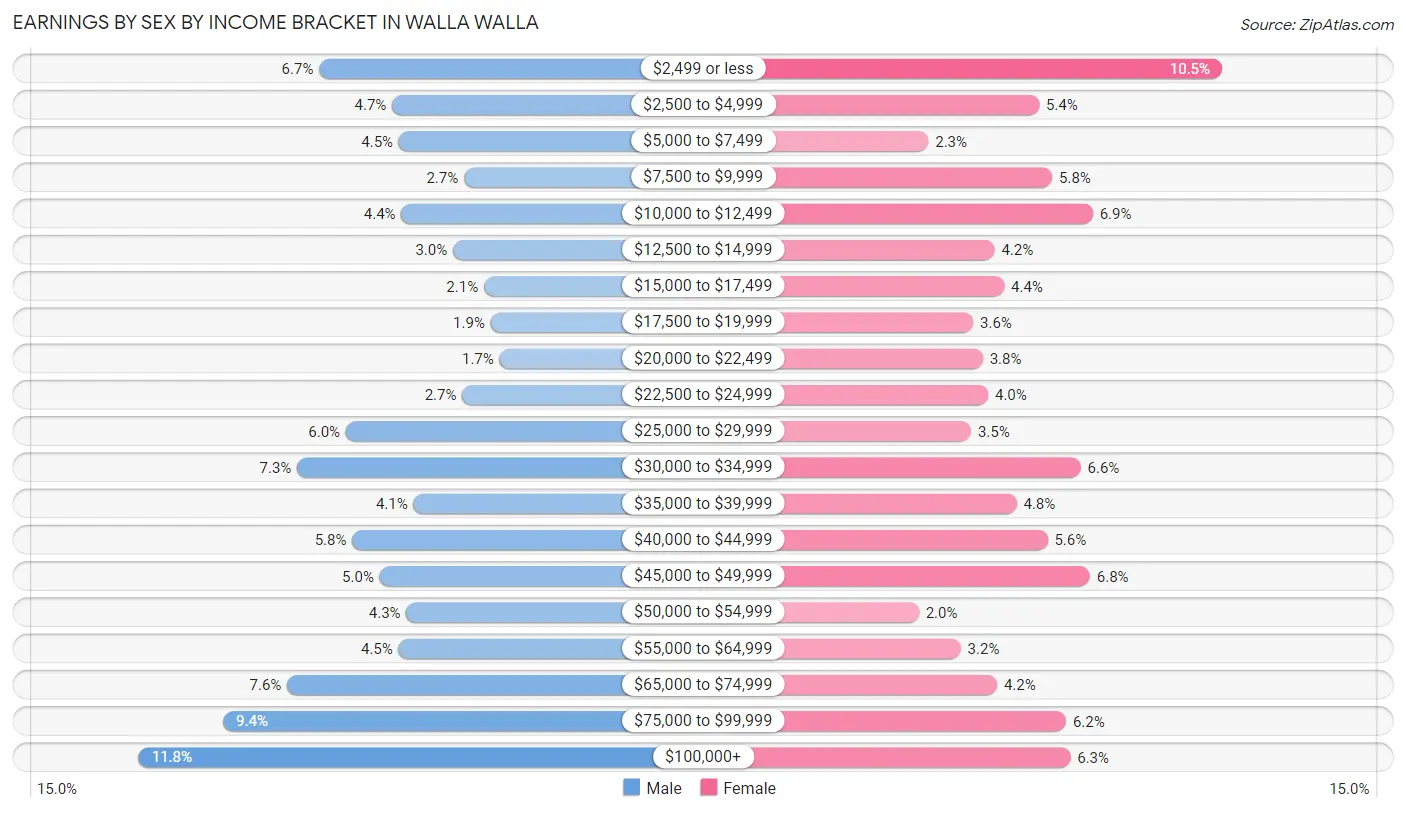
Earnings by Sex by Income Bracket in Walla Walla
The most common earnings brackets in Walla Walla are $100,000+ for men (1,066 | 11.8%) and $2,499 or less for women (924 | 10.5%).
| Income | Male | Female |
| $2,499 or less | 608 (6.7%) | 924 (10.5%) |
| $2,500 to $4,999 | 422 (4.7%) | 474 (5.4%) |
| $5,000 to $7,499 | 405 (4.5%) | 201 (2.3%) |
| $7,500 to $9,999 | 240 (2.6%) | 506 (5.8%) |
| $10,000 to $12,499 | 399 (4.4%) | 606 (6.9%) |
| $12,500 to $14,999 | 268 (3.0%) | 364 (4.2%) |
| $15,000 to $17,499 | 189 (2.1%) | 388 (4.4%) |
| $17,500 to $19,999 | 172 (1.9%) | 311 (3.5%) |
| $20,000 to $22,499 | 149 (1.7%) | 335 (3.8%) |
| $22,500 to $24,999 | 244 (2.7%) | 348 (4.0%) |
| $25,000 to $29,999 | 540 (6.0%) | 306 (3.5%) |
| $30,000 to $34,999 | 664 (7.3%) | 576 (6.6%) |
| $35,000 to $39,999 | 368 (4.1%) | 418 (4.8%) |
| $40,000 to $44,999 | 524 (5.8%) | 495 (5.6%) |
| $45,000 to $49,999 | 454 (5.0%) | 599 (6.8%) |
| $50,000 to $54,999 | 386 (4.3%) | 177 (2.0%) |
| $55,000 to $64,999 | 406 (4.5%) | 281 (3.2%) |
| $65,000 to $74,999 | 689 (7.6%) | 370 (4.2%) |
| $75,000 to $99,999 | 852 (9.4%) | 540 (6.2%) |
| $100,000+ | 1,066 (11.8%) | 551 (6.3%) |
| Total | 9,045 (100.0%) | 8,770 (100.0%) |
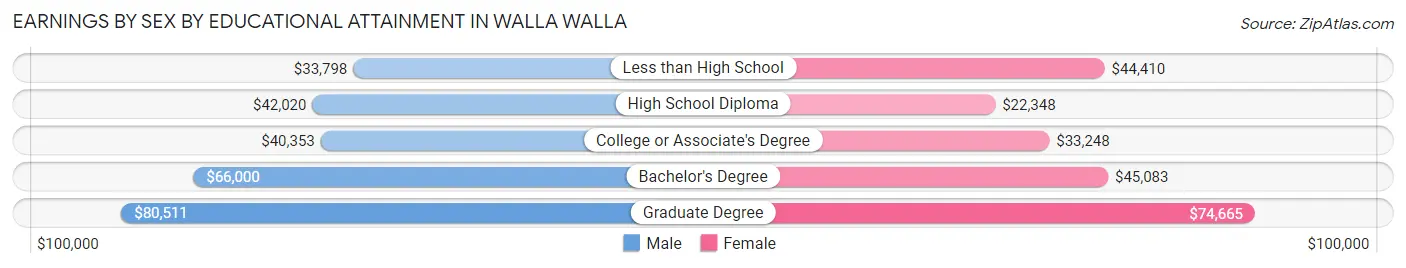
Earnings by Sex by Educational Attainment in Walla Walla
Average earnings in Walla Walla are $47,338 for men and $37,934 for women, a difference of 19.9%. Men with an educational attainment of graduate degree enjoy the highest average annual earnings of $80,511, while those with less than high school education earn the least with $33,798. Women with an educational attainment of graduate degree earn the most with the average annual earnings of $74,665, while those with high school diploma education have the smallest earnings of $22,348.
| Educational Attainment | Male Income | Female Income |
| Less than High School | $33,798 | $44,410 |
| High School Diploma | $42,020 | $22,348 |
| College or Associate's Degree | $40,353 | $33,248 |
| Bachelor's Degree | $66,000 | $45,083 |
| Graduate Degree | $80,511 | $74,665 |
| Total | $47,338 | $37,934 |
Family Income in Walla Walla
Family Income Brackets in Walla Walla
According to the Walla Walla family income data, there are 1,402 families falling into the $100,000 to $149,999 income range, which is the most common income bracket and makes up 19.6% of all families. Conversely, the less than $10,000 income bracket is the least frequent group with only 72 families (1.0%) belonging to this category.
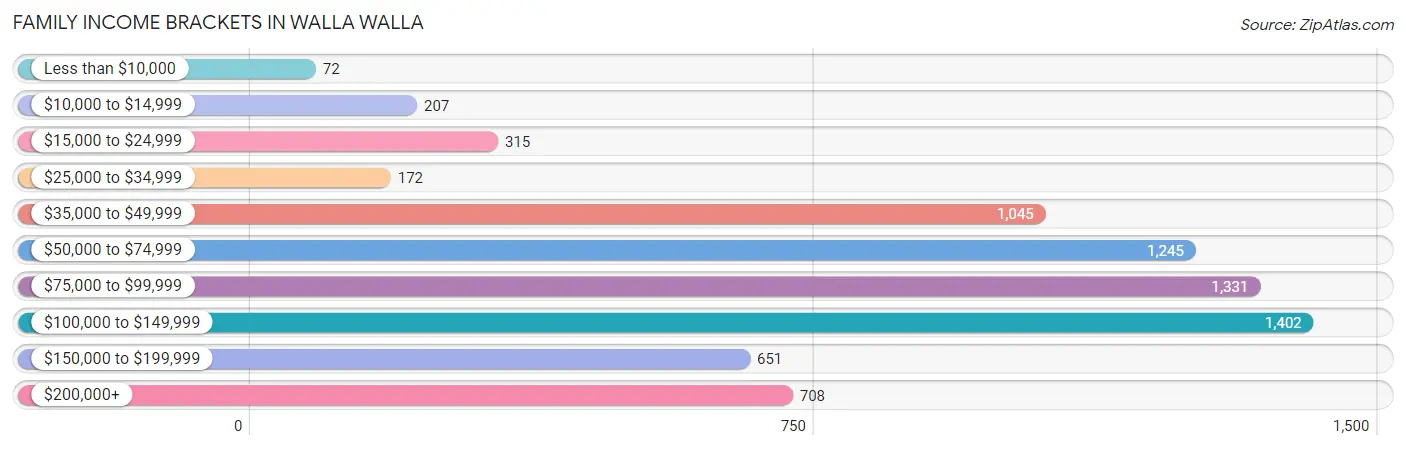
| Income Bracket | # Families | % Families |
| Less than $10,000 | 72 | 1.0% |
| $10,000 to $14,999 | 207 | 2.9% |
| $15,000 to $24,999 | 315 | 4.4% |
| $25,000 to $34,999 | 172 | 2.4% |
| $35,000 to $49,999 | 1,045 | 14.6% |
| $50,000 to $74,999 | 1,245 | 17.4% |
| $75,000 to $99,999 | 1,331 | 18.6% |
| $100,000 to $149,999 | 1,402 | 19.6% |
| $150,000 to $199,999 | 651 | 9.1% |
| $200,000+ | 708 | 9.9% |
Family Income by Famaliy Size in Walla Walla
4-person families (978 | 13.7%) account for the highest median family income in Walla Walla with $122,611 per family, while 2-person families (3,224 | 45.1%) have the highest median income of $38,594 per family member.
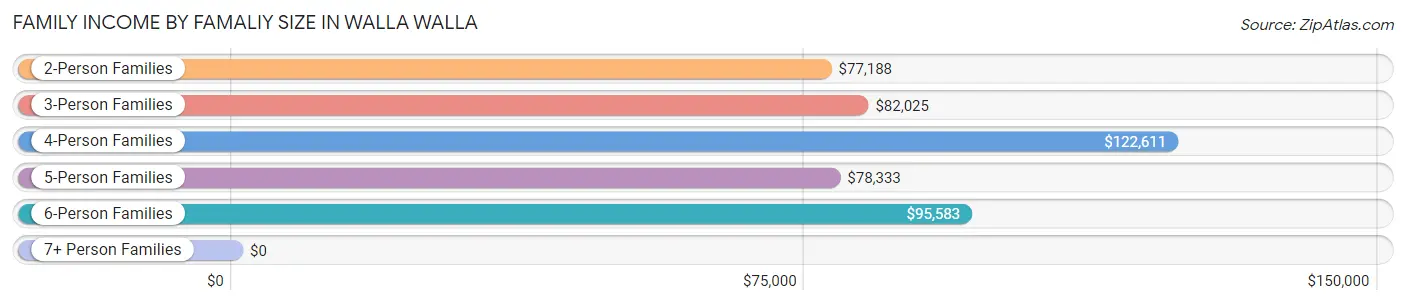
| Income Bracket | # Families | Median Income |
| 2-Person Families | 3,224 (45.1%) | $77,188 |
| 3-Person Families | 1,830 (25.6%) | $82,025 |
| 4-Person Families | 978 (13.7%) | $122,611 |
| 5-Person Families | 858 (12.0%) | $78,333 |
| 6-Person Families | 250 (3.5%) | $95,583 |
| 7+ Person Families | 15 (0.2%) | $0 |
| Total | 7,155 (100.0%) | $82,032 |
Family Income by Number of Earners in Walla Walla
The median family income in Walla Walla is $82,032, with families comprising 3+ earners (964) having the highest median family income of $105,278, while families with 1 earner (2,076) have the lowest median family income of $58,575, accounting for 13.5% and 29.0% of families, respectively.
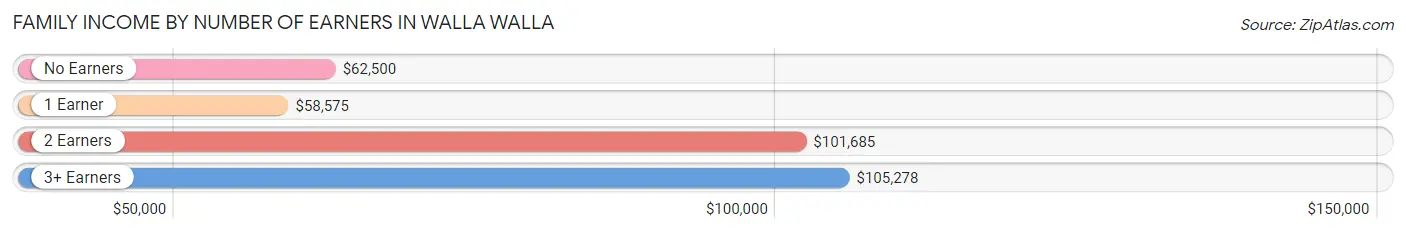
| Number of Earners | # Families | Median Income |
| No Earners | 1,102 (15.4%) | $62,500 |
| 1 Earner | 2,076 (29.0%) | $58,575 |
| 2 Earners | 3,013 (42.1%) | $101,685 |
| 3+ Earners | 964 (13.5%) | $105,278 |
| Total | 7,155 (100.0%) | $82,032 |
Household Income in Walla Walla
Household Income Brackets in Walla Walla
With 2,264 households falling in the category, the $50,000 to $74,999 income range is the most frequent in Walla Walla, accounting for 17.6% of all households. In contrast, only 708 households (5.5%) fall into the less than $10,000 income bracket, making it the least populous group.
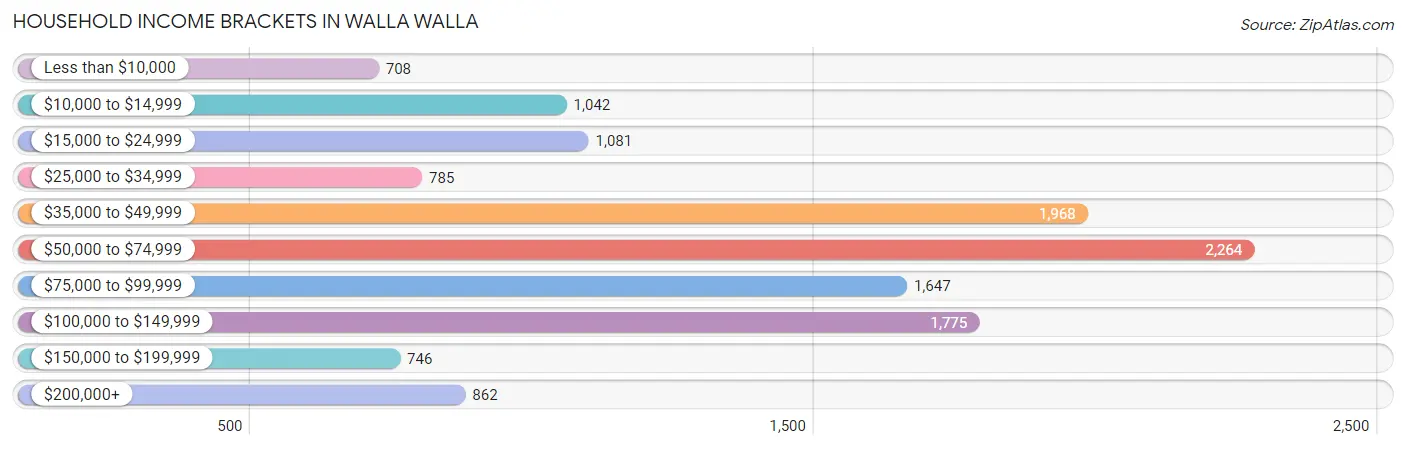
| Income Bracket | # Households | % Households |
| Less than $10,000 | 708 | 5.5% |
| $10,000 to $14,999 | 1,042 | 8.1% |
| $15,000 to $24,999 | 1,081 | 8.4% |
| $25,000 to $34,999 | 785 | 6.1% |
| $35,000 to $49,999 | 1,968 | 15.3% |
| $50,000 to $74,999 | 2,264 | 17.6% |
| $75,000 to $99,999 | 1,647 | 12.8% |
| $100,000 to $149,999 | 1,775 | 13.8% |
| $150,000 to $199,999 | 746 | 5.8% |
| $200,000+ | 862 | 6.7% |
Household Income by Householder Age in Walla Walla
The median household income in Walla Walla is $58,179, with the highest median household income of $71,924 found in the 25 to 44 years age bracket for the primary householder. A total of 3,747 households (29.1%) fall into this category. Meanwhile, the 15 to 24 years age bracket for the primary householder has the lowest median household income of $0, with 949 households (7.4%) in this group.
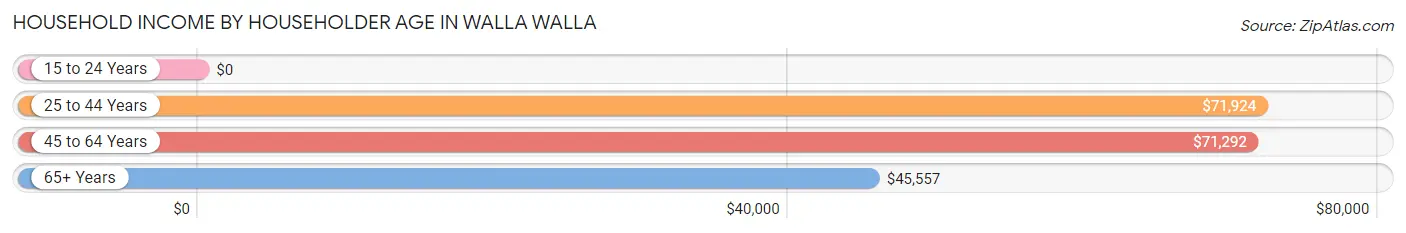
| Income Bracket | # Households | Median Income |
| 15 to 24 Years | 949 (7.4%) | $0 |
| 25 to 44 Years | 3,747 (29.1%) | $71,924 |
| 45 to 64 Years | 4,030 (31.3%) | $71,292 |
| 65+ Years | 4,139 (32.2%) | $45,557 |
| Total | 12,865 (100.0%) | $58,179 |
Poverty in Walla Walla
Income Below Poverty by Sex and Age in Walla Walla
With 11.3% poverty level for males and 15.7% for females among the residents of Walla Walla, 18 to 24 year old males and 5 year old females are the most vulnerable to poverty, with 488 males (25.9%) and 29 females (47.5%) in their respective age groups living below the poverty level.
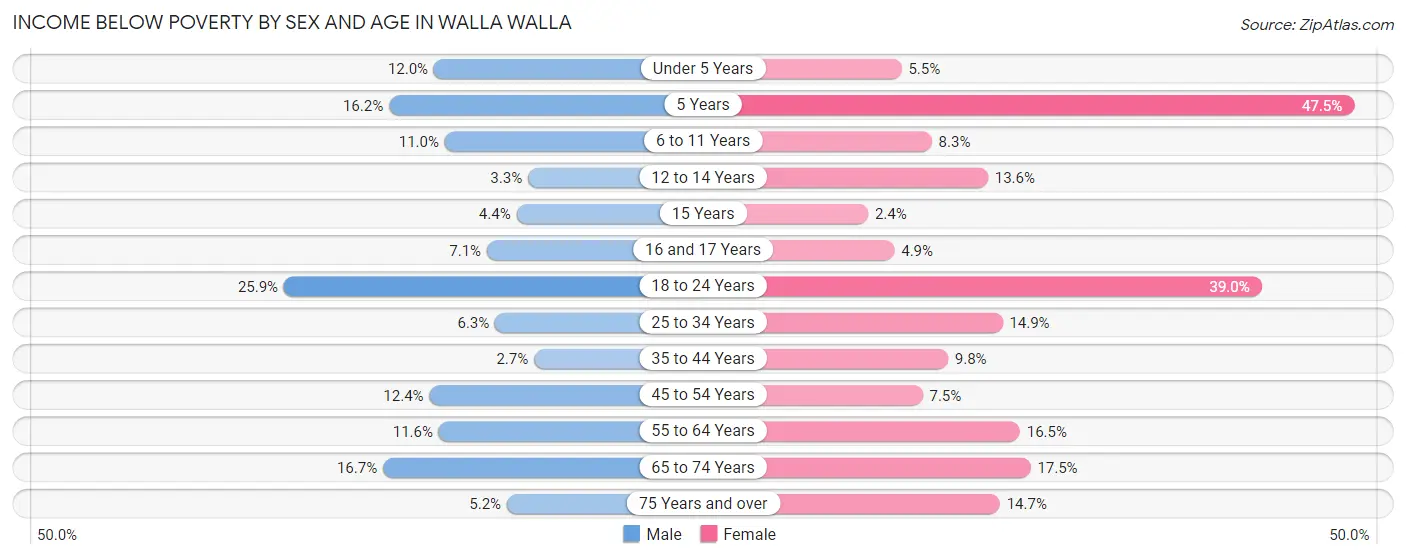
| Age Bracket | Male | Female |
| Under 5 Years | 76 (12.0%) | 38 (5.5%) |
| 5 Years | 11 (16.2%) | 29 (47.5%) |
| 6 to 11 Years | 124 (11.0%) | 92 (8.3%) |
| 12 to 14 Years | 22 (3.3%) | 95 (13.6%) |
| 15 Years | 11 (4.3%) | 6 (2.4%) |
| 16 and 17 Years | 38 (7.1%) | 15 (4.9%) |
| 18 to 24 Years | 488 (25.9%) | 811 (39.0%) |
| 25 to 34 Years | 119 (6.3%) | 254 (14.9%) |
| 35 to 44 Years | 42 (2.7%) | 189 (9.8%) |
| 45 to 54 Years | 247 (12.4%) | 147 (7.5%) |
| 55 to 64 Years | 190 (11.6%) | 269 (16.5%) |
| 65 to 74 Years | 230 (16.7%) | 262 (17.5%) |
| 75 Years and over | 58 (5.2%) | 273 (14.7%) |
| Total | 1,656 (11.3%) | 2,480 (15.7%) |
Income Above Poverty by Sex and Age in Walla Walla
According to the poverty statistics in Walla Walla, males aged 35 to 44 years and females aged 15 years are the age groups that are most secure financially, with 97.3% of males and 97.6% of females in these age groups living above the poverty line.
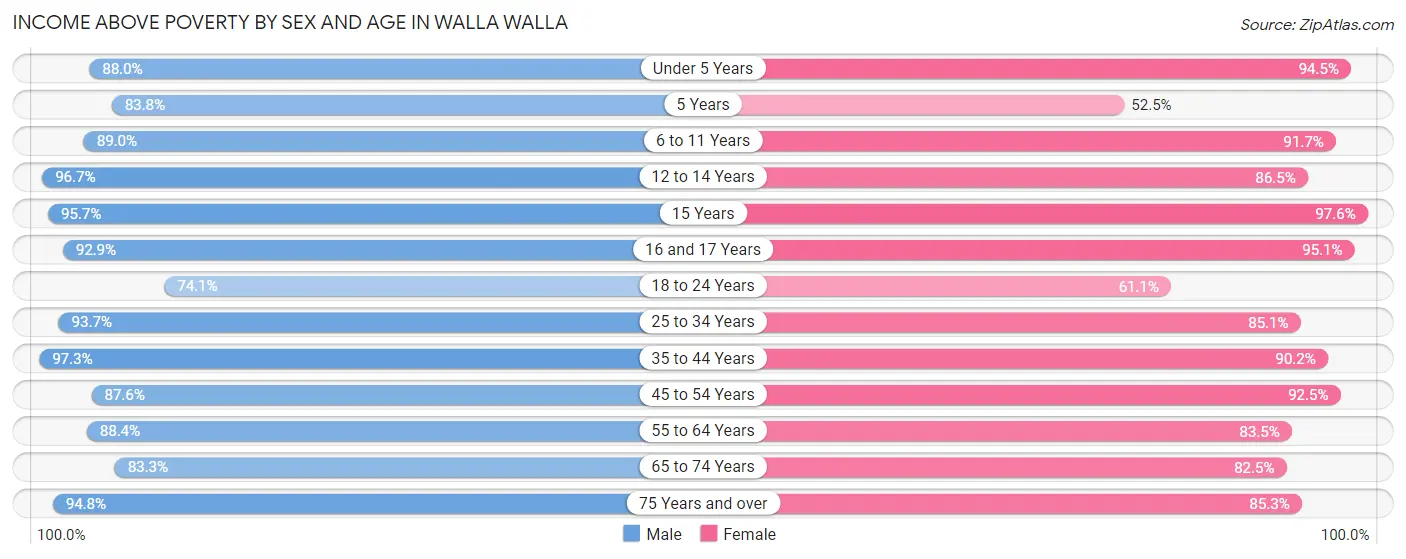
| Age Bracket | Male | Female |
| Under 5 Years | 557 (88.0%) | 648 (94.5%) |
| 5 Years | 57 (83.8%) | 32 (52.5%) |
| 6 to 11 Years | 1,003 (89.0%) | 1,011 (91.7%) |
| 12 to 14 Years | 648 (96.7%) | 606 (86.5%) |
| 15 Years | 242 (95.7%) | 241 (97.6%) |
| 16 and 17 Years | 498 (92.9%) | 293 (95.1%) |
| 18 to 24 Years | 1,394 (74.1%) | 1,271 (61.1%) |
| 25 to 34 Years | 1,762 (93.7%) | 1,450 (85.1%) |
| 35 to 44 Years | 1,501 (97.3%) | 1,732 (90.2%) |
| 45 to 54 Years | 1,740 (87.6%) | 1,815 (92.5%) |
| 55 to 64 Years | 1,453 (88.4%) | 1,359 (83.5%) |
| 65 to 74 Years | 1,144 (83.3%) | 1,234 (82.5%) |
| 75 Years and over | 1,048 (94.8%) | 1,589 (85.3%) |
| Total | 13,047 (88.7%) | 13,281 (84.3%) |
Income Below Poverty Among Married-Couple Families in Walla Walla
The poverty statistics for married-couple families in Walla Walla show that 5.1% or 268 of the total 5,231 families live below the poverty line. Families with 1 or 2 children have the highest poverty rate of 6.1%, comprising of 103 families. On the other hand, families with 5 or more children have the lowest poverty rate of 0.0%, which includes 0 families.
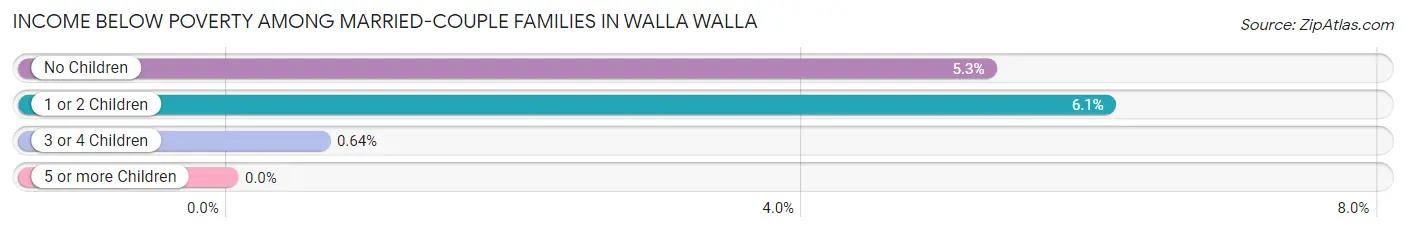
| Children | Above Poverty | Below Poverty |
| No Children | 2,905 (94.7%) | 162 (5.3%) |
| 1 or 2 Children | 1,583 (93.9%) | 103 (6.1%) |
| 3 or 4 Children | 468 (99.4%) | 3 (0.6%) |
| 5 or more Children | 7 (100.0%) | 0 (0.0%) |
| Total | 4,963 (94.9%) | 268 (5.1%) |
Income Below Poverty Among Single-Parent Households in Walla Walla
According to the poverty data in Walla Walla, 1.2% or 7 single-father households and 17.3% or 234 single-mother households are living below the poverty line. Among single-father households, those with 1 or 2 children have the highest poverty rate, with 7 households (2.5%) experiencing poverty. Likewise, among single-mother households, those with 5 or more children have the highest poverty rate, with 6 households (100.0%) falling below the poverty line.
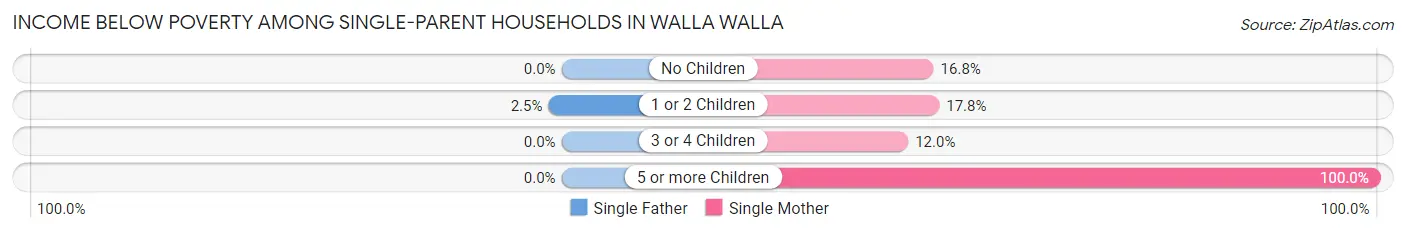
| Children | Single Father | Single Mother |
| No Children | 0 (0.0%) | 62 (16.8%) |
| 1 or 2 Children | 7 (2.5%) | 150 (17.8%) |
| 3 or 4 Children | 0 (0.0%) | 16 (12.0%) |
| 5 or more Children | 0 (0.0%) | 6 (100.0%) |
| Total | 7 (1.2%) | 234 (17.3%) |
Income Below Poverty Among Married-Couple vs Single-Parent Households in Walla Walla
The poverty data for Walla Walla shows that 268 of the married-couple family households (5.1%) and 241 of the single-parent households (12.5%) are living below the poverty level. Within the married-couple family households, those with 1 or 2 children have the highest poverty rate, with 103 households (6.1%) falling below the poverty line. Among the single-parent households, those with 5 or more children have the highest poverty rate, with 6 household (100.0%) living below poverty.
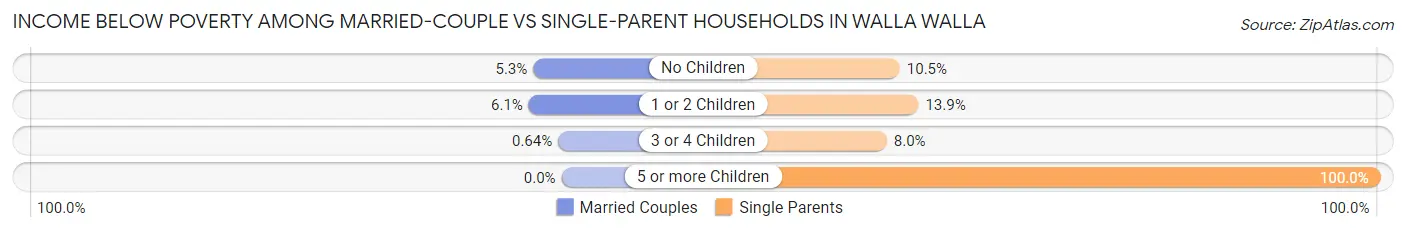
| Children | Married-Couple Families | Single-Parent Households |
| No Children | 162 (5.3%) | 62 (10.5%) |
| 1 or 2 Children | 103 (6.1%) | 157 (13.9%) |
| 3 or 4 Children | 3 (0.6%) | 16 (8.0%) |
| 5 or more Children | 0 (0.0%) | 6 (100.0%) |
| Total | 268 (5.1%) | 241 (12.5%) |
Race in Walla Walla
The most populous races in Walla Walla are White / Caucasian (25,419 | 75.1%), Hispanic or Latino (7,994 | 23.6%), and Two or more Races (2,941 | 8.7%).
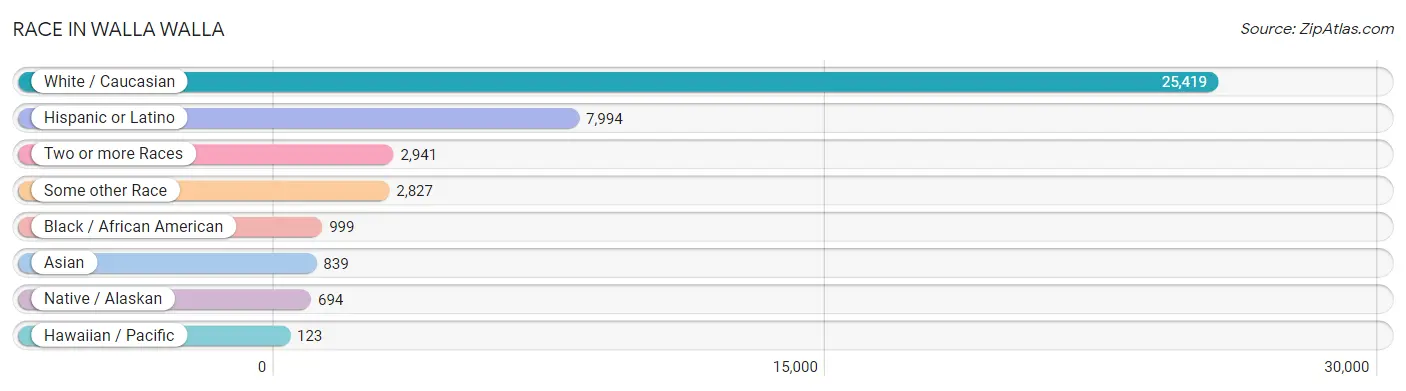
| Race | # Population | % Population |
| Asian | 839 | 2.5% |
| Black / African American | 999 | 2.9% |
| Hawaiian / Pacific | 123 | 0.4% |
| Hispanic or Latino | 7,994 | 23.6% |
| Native / Alaskan | 694 | 2.1% |
| White / Caucasian | 25,419 | 75.1% |
| Two or more Races | 2,941 | 8.7% |
| Some other Race | 2,827 | 8.4% |
| Total | 33,842 | 100.0% |
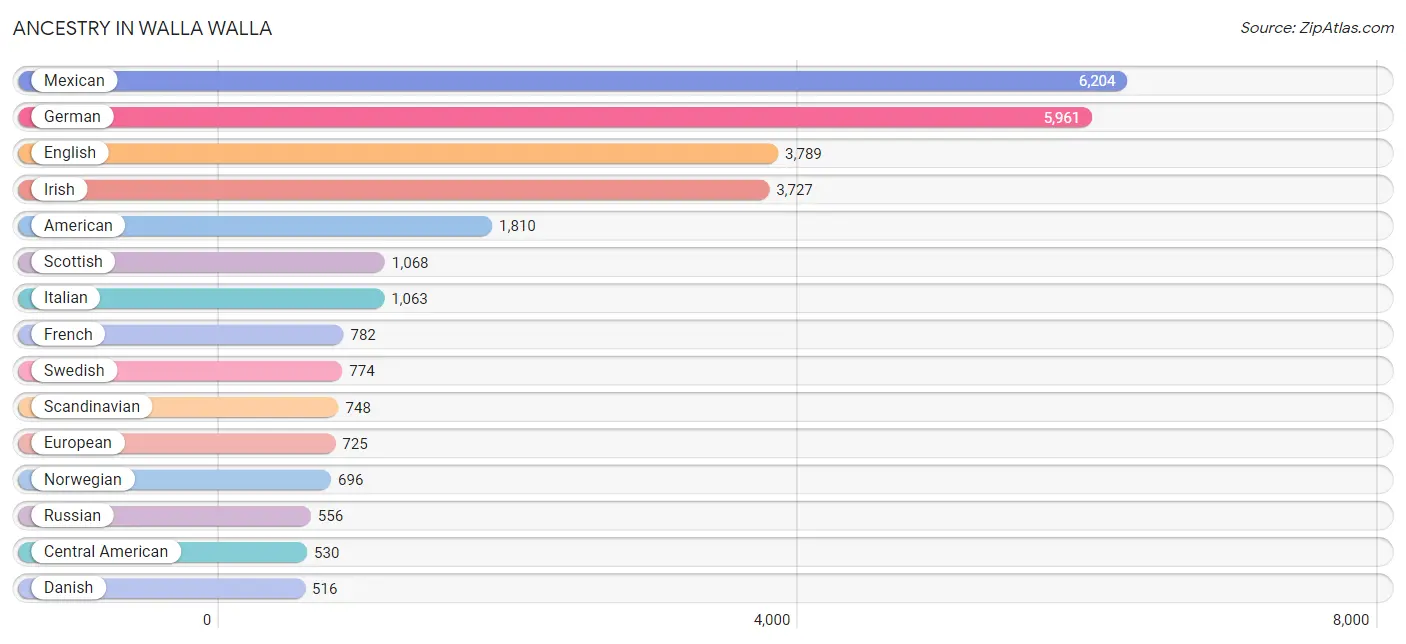
Ancestry in Walla Walla
The most populous ancestries reported in Walla Walla are Mexican (6,204 | 18.3%), German (5,961 | 17.6%), English (3,789 | 11.2%), Irish (3,727 | 11.0%), and American (1,810 | 5.3%), together accounting for 63.5% of all Walla Walla residents.
| Ancestry | # Population | % Population |
| African | 46 | 0.1% |
| Alaska Native | 50 | 0.2% |
| Alaskan Athabascan | 19 | 0.1% |
| Aleut | 19 | 0.1% |
| American | 1,810 | 5.3% |
| Apache | 48 | 0.1% |
| Arab | 41 | 0.1% |
| Armenian | 18 | 0.1% |
| Australian | 36 | 0.1% |
| Austrian | 125 | 0.4% |
| Belgian | 10 | 0.0% |
| Bhutanese | 95 | 0.3% |
| Blackfeet | 42 | 0.1% |
| British | 171 | 0.5% |
| Burmese | 120 | 0.4% |
| Canadian | 196 | 0.6% |
| Carpatho Rusyn | 6 | 0.0% |
| Celtic | 8 | 0.0% |
| Central American | 530 | 1.6% |
| Central American Indian | 395 | 1.2% |
| Cherokee | 193 | 0.6% |
| Chippewa | 104 | 0.3% |
| Choctaw | 50 | 0.2% |
| Colombian | 79 | 0.2% |
| Costa Rican | 36 | 0.1% |
| Croatian | 11 | 0.0% |
| Cuban | 23 | 0.1% |
| Czech | 39 | 0.1% |
| Czechoslovakian | 92 | 0.3% |
| Danish | 516 | 1.5% |
| Dominican | 5 | 0.0% |
| Dutch | 450 | 1.3% |
| Eastern European | 100 | 0.3% |
| Ecuadorian | 42 | 0.1% |
| English | 3,789 | 11.2% |
| Estonian | 13 | 0.0% |
| Ethiopian | 94 | 0.3% |
| European | 725 | 2.1% |
| Filipino | 101 | 0.3% |
| Finnish | 285 | 0.8% |
| French | 782 | 2.3% |
| French American Indian | 6 | 0.0% |
| French Canadian | 152 | 0.4% |
| German | 5,961 | 17.6% |
| Greek | 174 | 0.5% |
| Guamanian / Chamorro | 95 | 0.3% |
| Guatemalan | 21 | 0.1% |
| Haitian | 5 | 0.0% |
| Hungarian | 26 | 0.1% |
| Indian (Asian) | 330 | 1.0% |
| Iranian | 15 | 0.0% |
| Irish | 3,727 | 11.0% |
| Iroquois | 15 | 0.0% |
| Italian | 1,063 | 3.1% |
| Japanese | 9 | 0.0% |
| Kenyan | 4 | 0.0% |
| Korean | 327 | 1.0% |
| Laotian | 4 | 0.0% |
| Latvian | 6 | 0.0% |
| Lebanese | 22 | 0.1% |
| Liberian | 262 | 0.8% |
| Lithuanian | 60 | 0.2% |
| Malaysian | 11 | 0.0% |
| Menominee | 5 | 0.0% |
| Mexican | 6,204 | 18.3% |
| Mexican American Indian | 74 | 0.2% |
| Native Hawaiian | 64 | 0.2% |
| New Zealander | 27 | 0.1% |
| Northern European | 23 | 0.1% |
| Norwegian | 696 | 2.1% |
| Paiute | 11 | 0.0% |
| Palestinian | 9 | 0.0% |
| Pennsylvania German | 8 | 0.0% |
| Peruvian | 111 | 0.3% |
| Polish | 403 | 1.2% |
| Portuguese | 91 | 0.3% |
| Potawatomi | 5 | 0.0% |
| Puerto Rican | 248 | 0.7% |
| Puget Sound Salish | 52 | 0.2% |
| Romanian | 1 | 0.0% |
| Russian | 556 | 1.6% |
| Salvadoran | 473 | 1.4% |
| Samoan | 70 | 0.2% |
| Scandinavian | 748 | 2.2% |
| Scotch-Irish | 321 | 0.9% |
| Scottish | 1,068 | 3.2% |
| Seminole | 14 | 0.0% |
| Sioux | 68 | 0.2% |
| Slavic | 7 | 0.0% |
| Slovak | 39 | 0.1% |
| South American | 232 | 0.7% |
| South American Indian | 10 | 0.0% |
| Spaniard | 200 | 0.6% |
| Spanish | 58 | 0.2% |
| Sri Lankan | 73 | 0.2% |
| Subsaharan African | 487 | 1.4% |
| Swedish | 774 | 2.3% |
| Swiss | 135 | 0.4% |
| Thai | 108 | 0.3% |
| Tsimshian | 18 | 0.1% |
| Turkish | 10 | 0.0% |
| Ugandan | 66 | 0.2% |
| Ukrainian | 86 | 0.3% |
| Welsh | 353 | 1.0% |
| West Indian | 12 | 0.0% |
| Yugoslavian | 52 | 0.2% | View All 106 Rows |
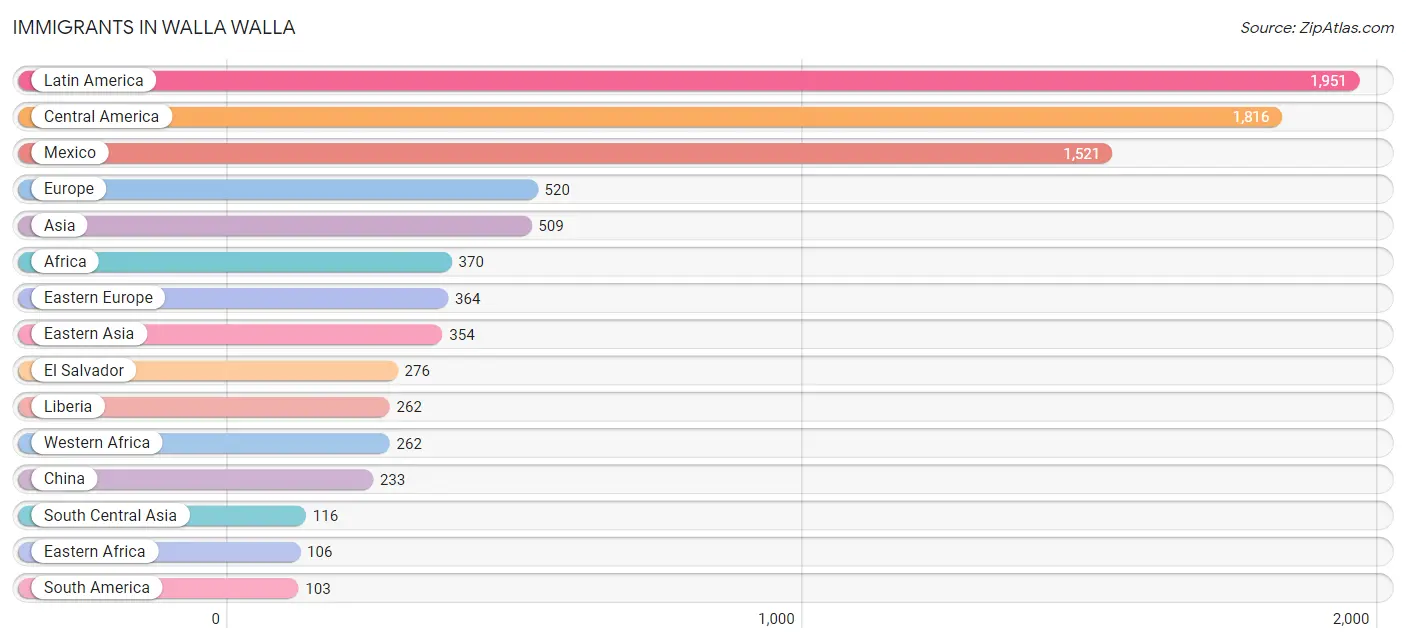
Immigrants in Walla Walla
The most numerous immigrant groups reported in Walla Walla came from Latin America (1,951 | 5.8%), Central America (1,816 | 5.4%), Mexico (1,521 | 4.5%), Europe (520 | 1.5%), and Asia (509 | 1.5%), together accounting for 18.7% of all Walla Walla residents.
| Immigration Origin | # Population | % Population |
| Africa | 370 | 1.1% |
| Asia | 509 | 1.5% |
| Australia | 8 | 0.0% |
| Bosnia and Herzegovina | 15 | 0.0% |
| Canada | 86 | 0.3% |
| Caribbean | 32 | 0.1% |
| Central America | 1,816 | 5.4% |
| China | 233 | 0.7% |
| Eastern Africa | 106 | 0.3% |
| Eastern Asia | 354 | 1.1% |
| Eastern Europe | 364 | 1.1% |
| Ecuador | 19 | 0.1% |
| El Salvador | 276 | 0.8% |
| England | 52 | 0.2% |
| Ethiopia | 89 | 0.3% |
| Europe | 520 | 1.5% |
| Fiji | 26 | 0.1% |
| Germany | 70 | 0.2% |
| Guatemala | 19 | 0.1% |
| Haiti | 32 | 0.1% |
| Hong Kong | 8 | 0.0% |
| India | 73 | 0.2% |
| Ireland | 15 | 0.0% |
| Japan | 32 | 0.1% |
| Korea | 89 | 0.3% |
| Latin America | 1,951 | 5.8% |
| Lebanon | 10 | 0.0% |
| Liberia | 262 | 0.8% |
| Mexico | 1,521 | 4.5% |
| Moldova | 5 | 0.0% |
| Nepal | 3 | 0.0% |
| Northern Europe | 76 | 0.2% |
| Norway | 9 | 0.0% |
| Oceania | 71 | 0.2% |
| Pakistan | 10 | 0.0% |
| Peru | 84 | 0.3% |
| Philippines | 5 | 0.0% |
| Poland | 8 | 0.0% |
| Russia | 54 | 0.2% |
| South Africa | 2 | 0.0% |
| South America | 103 | 0.3% |
| South Central Asia | 116 | 0.3% |
| South Eastern Asia | 23 | 0.1% |
| Southern Europe | 10 | 0.0% |
| Spain | 10 | 0.0% |
| Sri Lanka | 8 | 0.0% |
| Taiwan | 55 | 0.2% |
| Ukraine | 3 | 0.0% |
| Uzbekistan | 17 | 0.1% |
| Vietnam | 18 | 0.1% |
| Western Africa | 262 | 0.8% |
| Western Asia | 16 | 0.1% |
| Western Europe | 70 | 0.2% | View All 53 Rows |
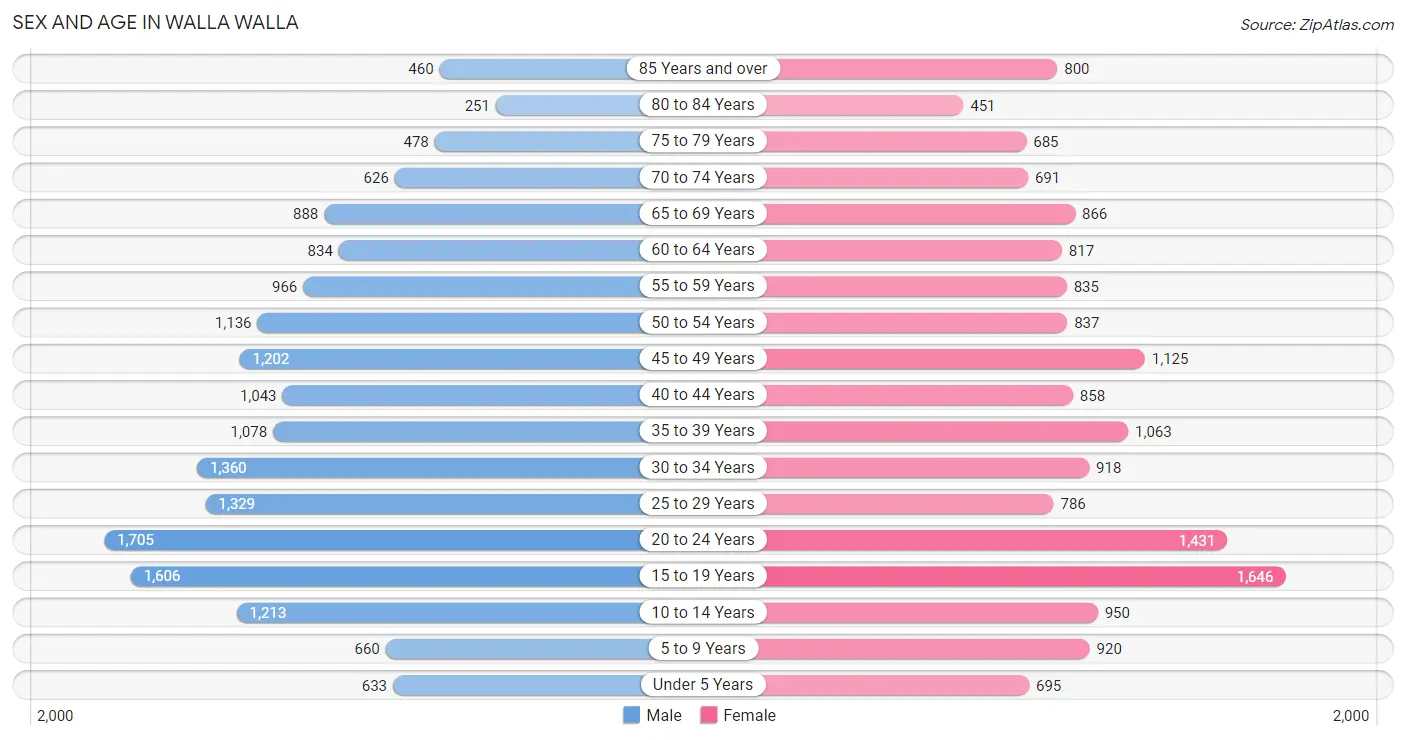
Sex and Age in Walla Walla
Sex and Age in Walla Walla
The most populous age groups in Walla Walla are 20 to 24 Years (1,705 | 9.8%) for men and 15 to 19 Years (1,646 | 10.1%) for women.
| Age Bracket | Male | Female |
| Under 5 Years | 633 (3.6%) | 695 (4.2%) |
| 5 to 9 Years | 660 (3.8%) | 920 (5.6%) |
| 10 to 14 Years | 1,213 (6.9%) | 950 (5.8%) |
| 15 to 19 Years | 1,606 (9.2%) | 1,646 (10.1%) |
| 20 to 24 Years | 1,705 (9.8%) | 1,431 (8.7%) |
| 25 to 29 Years | 1,329 (7.6%) | 786 (4.8%) |
| 30 to 34 Years | 1,360 (7.8%) | 918 (5.6%) |
| 35 to 39 Years | 1,078 (6.2%) | 1,063 (6.5%) |
| 40 to 44 Years | 1,043 (6.0%) | 858 (5.2%) |
| 45 to 49 Years | 1,202 (6.9%) | 1,125 (6.9%) |
| 50 to 54 Years | 1,136 (6.5%) | 837 (5.1%) |
| 55 to 59 Years | 966 (5.5%) | 835 (5.1%) |
| 60 to 64 Years | 834 (4.8%) | 817 (5.0%) |
| 65 to 69 Years | 888 (5.1%) | 866 (5.3%) |
| 70 to 74 Years | 626 (3.6%) | 691 (4.2%) |
| 75 to 79 Years | 478 (2.7%) | 685 (4.2%) |
| 80 to 84 Years | 251 (1.4%) | 451 (2.8%) |
| 85 Years and over | 460 (2.6%) | 800 (4.9%) |
| Total | 17,468 (100.0%) | 16,374 (100.0%) |
Families and Households in Walla Walla
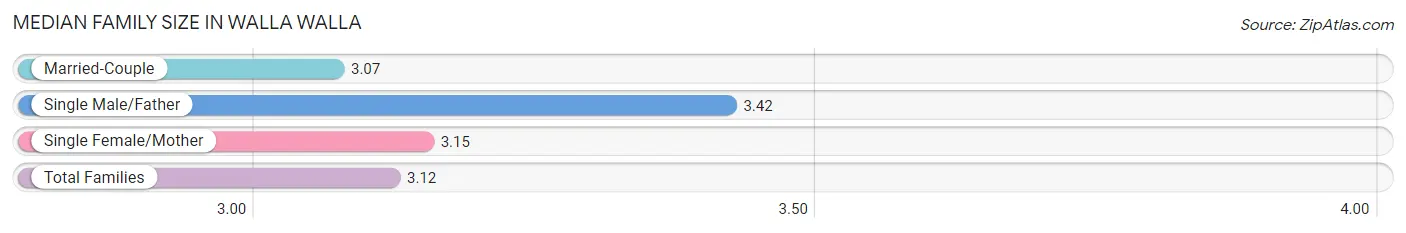
Median Family Size in Walla Walla
The median family size in Walla Walla is 3.12 persons per family, with single male/father families (573 | 8.0%) accounting for the largest median family size of 3.42 persons per family. On the other hand, married-couple families (5,231 | 73.1%) represent the smallest median family size with 3.07 persons per family.
| Family Type | # Families | Family Size |
| Married-Couple | 5,231 (73.1%) | 3.07 |
| Single Male/Father | 573 (8.0%) | 3.42 |
| Single Female/Mother | 1,351 (18.9%) | 3.15 |
| Total Families | 7,155 (100.0%) | 3.12 |
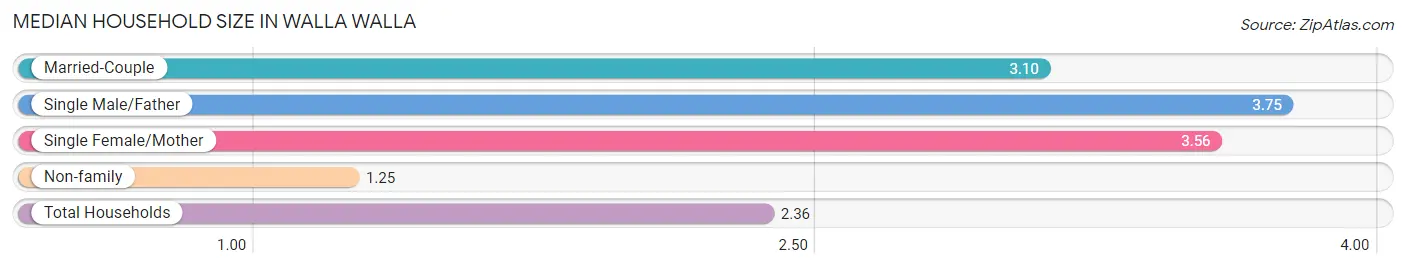
Median Household Size in Walla Walla
The median household size in Walla Walla is 2.36 persons per household, with single male/father households (573 | 4.4%) accounting for the largest median household size of 3.75 persons per household. non-family households (5,710 | 44.4%) represent the smallest median household size with 1.25 persons per household.
| Household Type | # Households | Household Size |
| Married-Couple | 5,231 (40.7%) | 3.10 |
| Single Male/Father | 573 (4.4%) | 3.75 |
| Single Female/Mother | 1,351 (10.5%) | 3.56 |
| Non-family | 5,710 (44.4%) | 1.25 |
| Total Households | 12,865 (100.0%) | 2.36 |
Household Size by Marriage Status in Walla Walla
Out of a total of 12,865 households in Walla Walla, 7,155 (55.6%) are family households, while 5,710 (44.4%) are nonfamily households. The most numerous type of family households are 2-person households, comprising 3,042, and the most common type of nonfamily households are 1-person households, comprising 4,801.
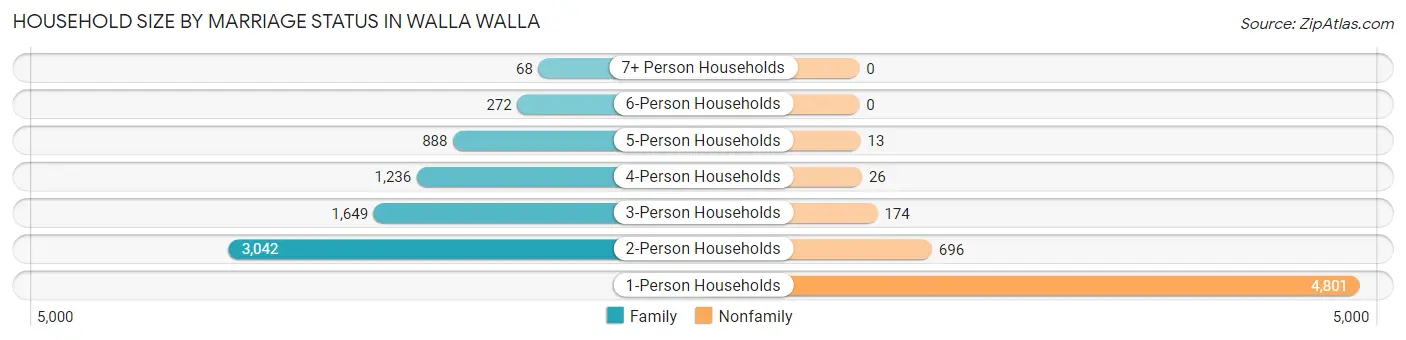
| Household Size | Family Households | Nonfamily Households |
| 1-Person Households | - | 4,801 (37.3%) |
| 2-Person Households | 3,042 (23.6%) | 696 (5.4%) |
| 3-Person Households | 1,649 (12.8%) | 174 (1.3%) |
| 4-Person Households | 1,236 (9.6%) | 26 (0.2%) |
| 5-Person Households | 888 (6.9%) | 13 (0.1%) |
| 6-Person Households | 272 (2.1%) | 0 (0.0%) |
| 7+ Person Households | 68 (0.5%) | 0 (0.0%) |
| Total | 7,155 (55.6%) | 5,710 (44.4%) |
Female Fertility in Walla Walla
Fertility by Age in Walla Walla
Average fertility rate in Walla Walla is 17.0 births per 1,000 women. Women in the age bracket of 20 to 34 years have the highest fertility rate with 24.0 births per 1,000 women. Women in the age bracket of 20 to 34 years acount for 54.8% of all women with births.
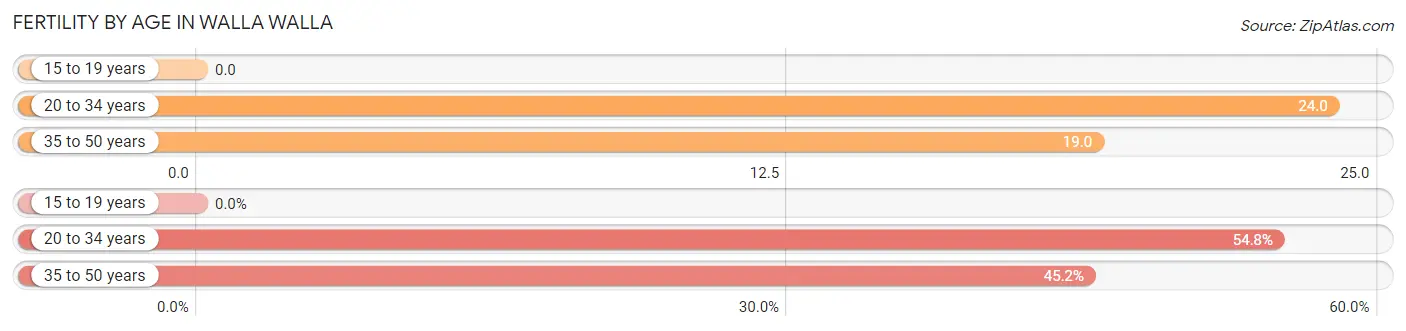
| Age Bracket | Women with Births | Births / 1,000 Women |
| 15 to 19 years | 0 (0.0%) | 0.0 |
| 20 to 34 years | 74 (54.8%) | 24.0 |
| 35 to 50 years | 61 (45.2%) | 19.0 |
| Total | 135 (100.0%) | 17.0 |
Fertility by Age by Marriage Status in Walla Walla
60.0% of women with births (135) in Walla Walla are married. The highest percentage of unmarried women with births falls into 35 to 50 years age bracket with 62.3% of them unmarried at the time of birth, while the lowest percentage of unmarried women with births belong to 20 to 34 years age bracket with 21.6% of them unmarried.
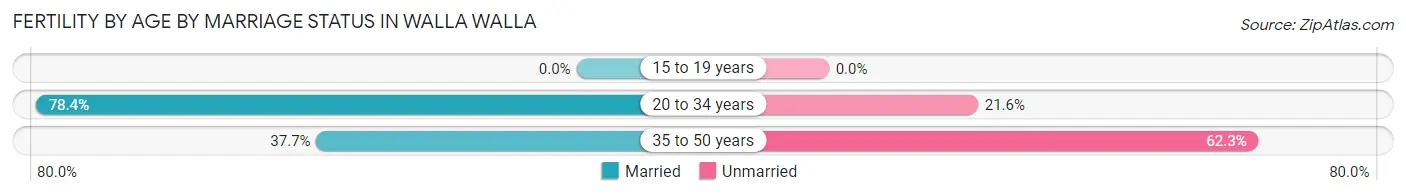
| Age Bracket | Married | Unmarried |
| 15 to 19 years | 0 (0.0%) | 0 (0.0%) |
| 20 to 34 years | 58 (78.4%) | 16 (21.6%) |
| 35 to 50 years | 23 (37.7%) | 38 (62.3%) |
| Total | 81 (60.0%) | 54 (40.0%) |
Fertility by Education in Walla Walla
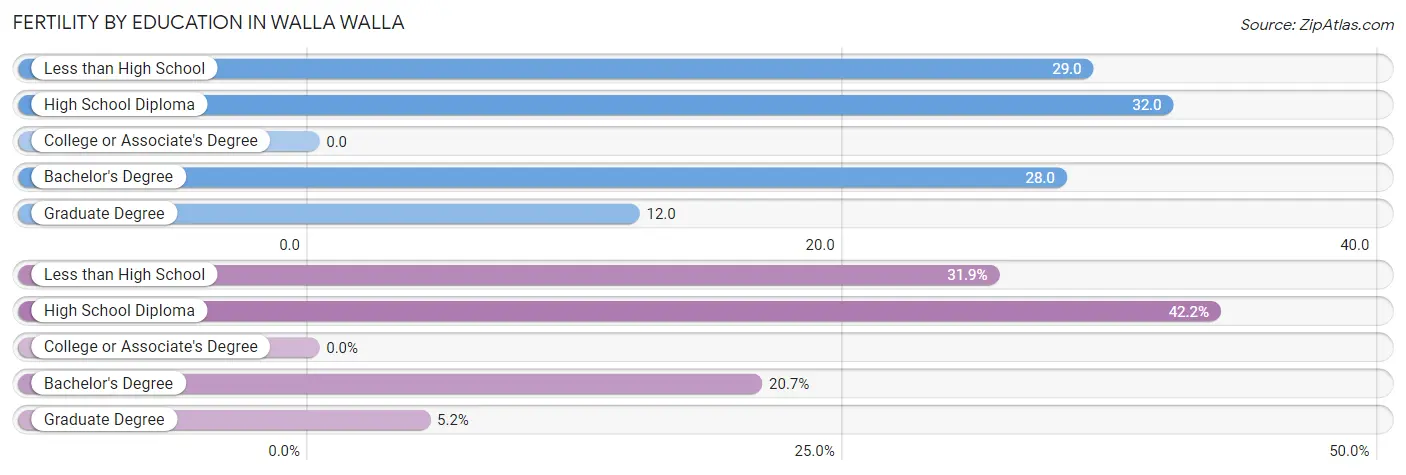
| Educational Attainment | Women with Births | Births / 1,000 Women |
| Less than High School | 43 (31.9%) | 29.0 |
| High School Diploma | 57 (42.2%) | 32.0 |
| College or Associate's Degree | 0 (0.0%) | 0.0 |
| Bachelor's Degree | 28 (20.7%) | 28.0 |
| Graduate Degree | 7 (5.2%) | 12.0 |
| Total | 135 (100.0%) | 17.0 |
Fertility by Education by Marriage Status in Walla Walla
40.0% of women with births in Walla Walla are unmarried. Women with the educational attainment of bachelor's degree are most likely to be married with 100.0% of them married at childbirth, while women with the educational attainment of less than high school are least likely to be married with 88.4% of them unmarried at childbirth.
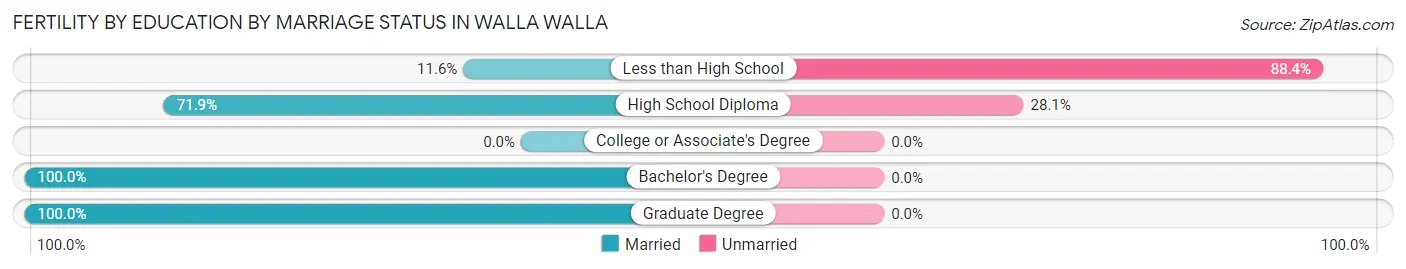
| Educational Attainment | Married | Unmarried |
| Less than High School | 5 (11.6%) | 38 (88.4%) |
| High School Diploma | 41 (71.9%) | 16 (28.1%) |
| College or Associate's Degree | 0 (0.0%) | 0 (0.0%) |
| Bachelor's Degree | 28 (100.0%) | 0 (0.0%) |
| Graduate Degree | 7 (100.0%) | 0 (0.0%) |
| Total | 81 (60.0%) | 54 (40.0%) |
Employment Characteristics in Walla Walla
Employment by Class of Employer in Walla Walla
Among the 14,829 employed individuals in Walla Walla, private company employees (9,319 | 62.8%), not-for-profit organizations (1,383 | 9.3%), and self-employed (not incorporated) (960 | 6.5%) make up the most common classes of employment.
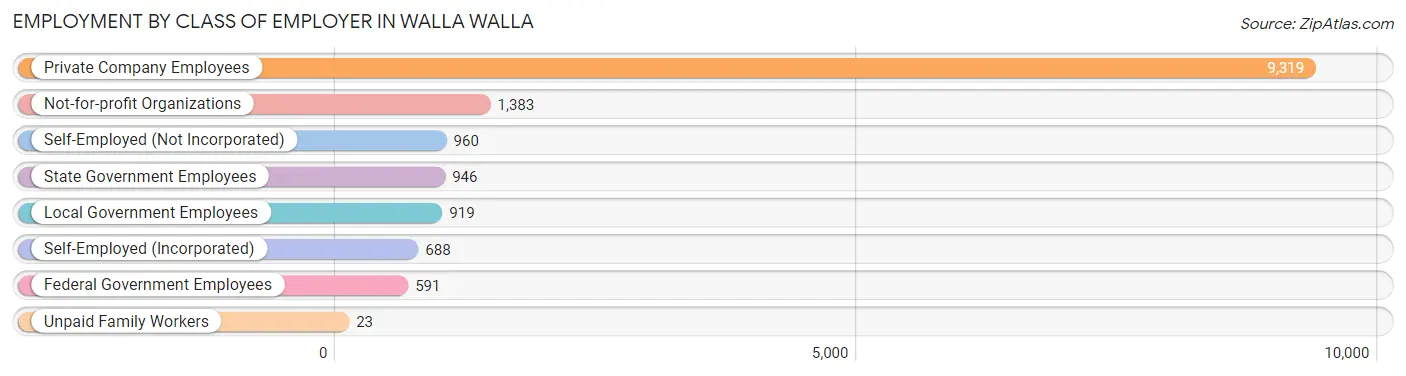
| Employer Class | # Employees | % Employees |
| Private Company Employees | 9,319 | 62.8% |
| Self-Employed (Incorporated) | 688 | 4.6% |
| Self-Employed (Not Incorporated) | 960 | 6.5% |
| Not-for-profit Organizations | 1,383 | 9.3% |
| Local Government Employees | 919 | 6.2% |
| State Government Employees | 946 | 6.4% |
| Federal Government Employees | 591 | 4.0% |
| Unpaid Family Workers | 23 | 0.2% |
| Total | 14,829 | 100.0% |
Employment Status by Age in Walla Walla
According to the labor force statistics for Walla Walla, out of the total population over 16 years of age (28,270), 56.8% or 16,057 individuals are in the labor force, with 6.1% or 979 of them unemployed. The age group with the highest labor force participation rate is 20 to 24 years, with 76.0% or 2,383 individuals in the labor force. Within the labor force, the 25 to 29 years age range has the highest percentage of unemployed individuals, with 14.9% or 236 of them being unemployed.
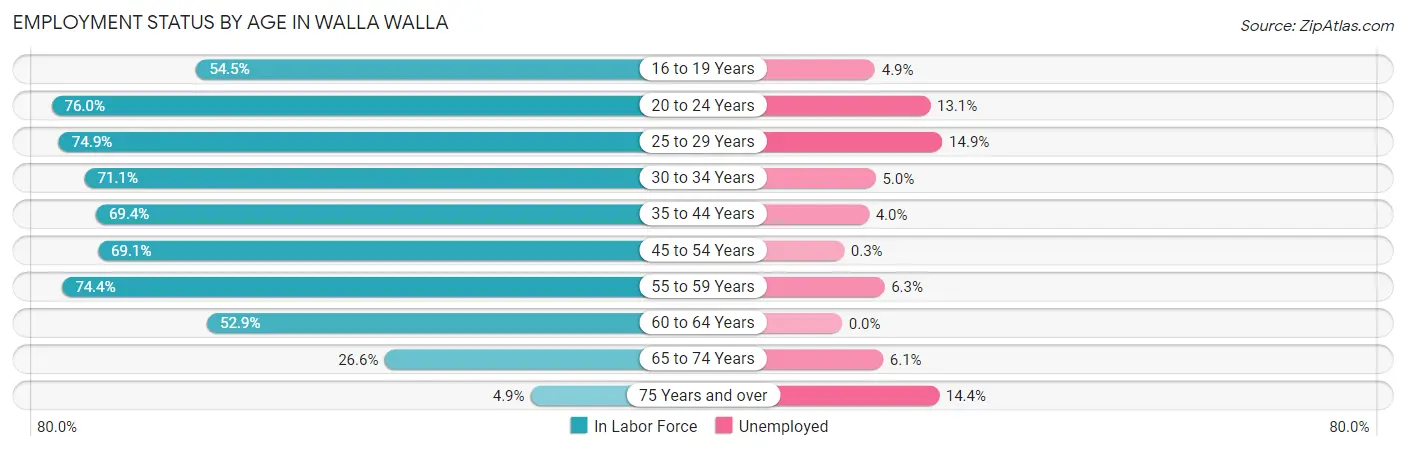
| Age Bracket | In Labor Force | Unemployed |
| 16 to 19 Years | 1,499 (54.5%) | 73 (4.9%) |
| 20 to 24 Years | 2,383 (76.0%) | 312 (13.1%) |
| 25 to 29 Years | 1,584 (74.9%) | 236 (14.9%) |
| 30 to 34 Years | 1,620 (71.1%) | 81 (5.0%) |
| 35 to 44 Years | 2,805 (69.4%) | 112 (4.0%) |
| 45 to 54 Years | 2,971 (69.1%) | 9 (0.3%) |
| 55 to 59 Years | 1,340 (74.4%) | 84 (6.3%) |
| 60 to 64 Years | 873 (52.9%) | 0 (0.0%) |
| 65 to 74 Years | 817 (26.6%) | 50 (6.1%) |
| 75 Years and over | 153 (4.9%) | 22 (14.4%) |
| Total | 16,057 (56.8%) | 979 (6.1%) |
Employment Status by Educational Attainment in Walla Walla
According to labor force statistics for Walla Walla, 69.2% of individuals (11,201) out of the total population between 25 and 64 years of age (16,187) are in the labor force, with 4.7% or 526 of them being unemployed. The group with the highest labor force participation rate are those with the educational attainment of bachelor's degree or higher, with 86.4% or 3,768 individuals in the labor force. Within the labor force, individuals with high school diploma education have the highest percentage of unemployment, with 11.8% or 251 of them being unemployed.
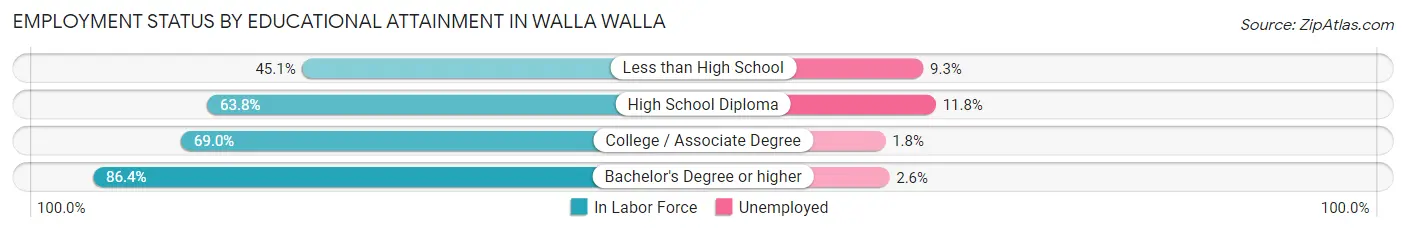
| Educational Attainment | In Labor Force | Unemployed |
| Less than High School | 1,053 (45.1%) | 217 (9.3%) |
| High School Diploma | 2,125 (63.8%) | 393 (11.8%) |
| College / Associate Degree | 4,250 (69.0%) | 111 (1.8%) |
| Bachelor's Degree or higher | 3,768 (86.4%) | 113 (2.6%) |
| Total | 11,201 (69.2%) | 761 (4.7%) |
Employment Occupations by Sex in Walla Walla
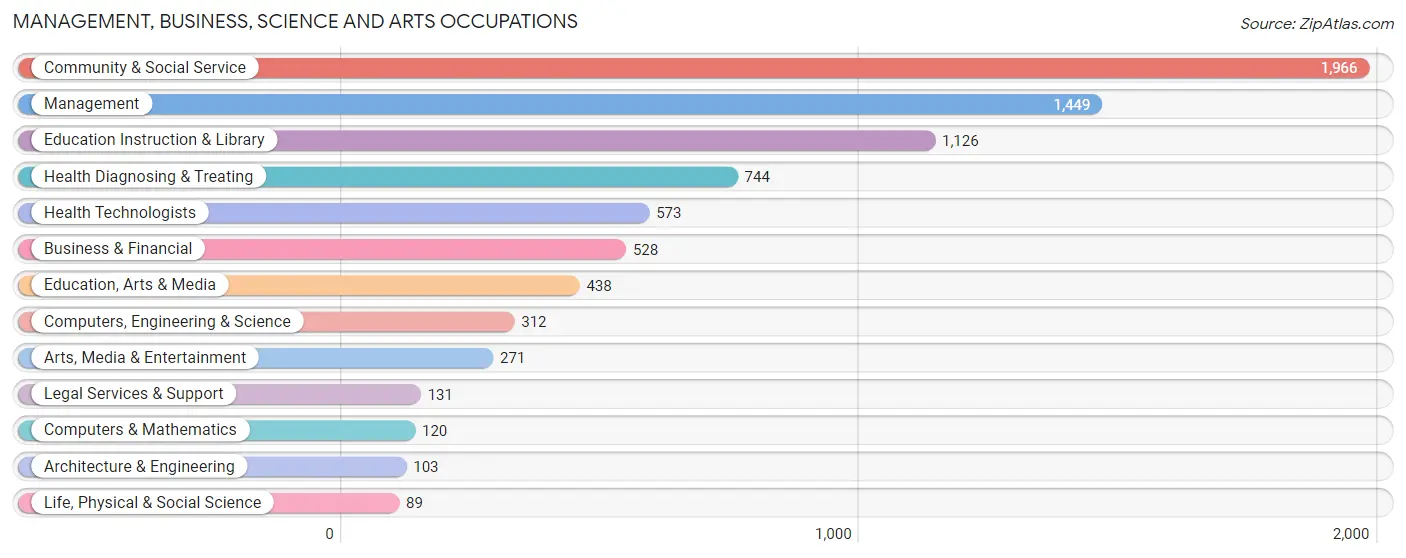
Management, Business, Science and Arts Occupations
The most common Management, Business, Science and Arts occupations in Walla Walla are Community & Social Service (1,966 | 13.1%), Management (1,449 | 9.7%), Education Instruction & Library (1,126 | 7.5%), Health Diagnosing & Treating (744 | 5.0%), and Health Technologists (573 | 3.8%).
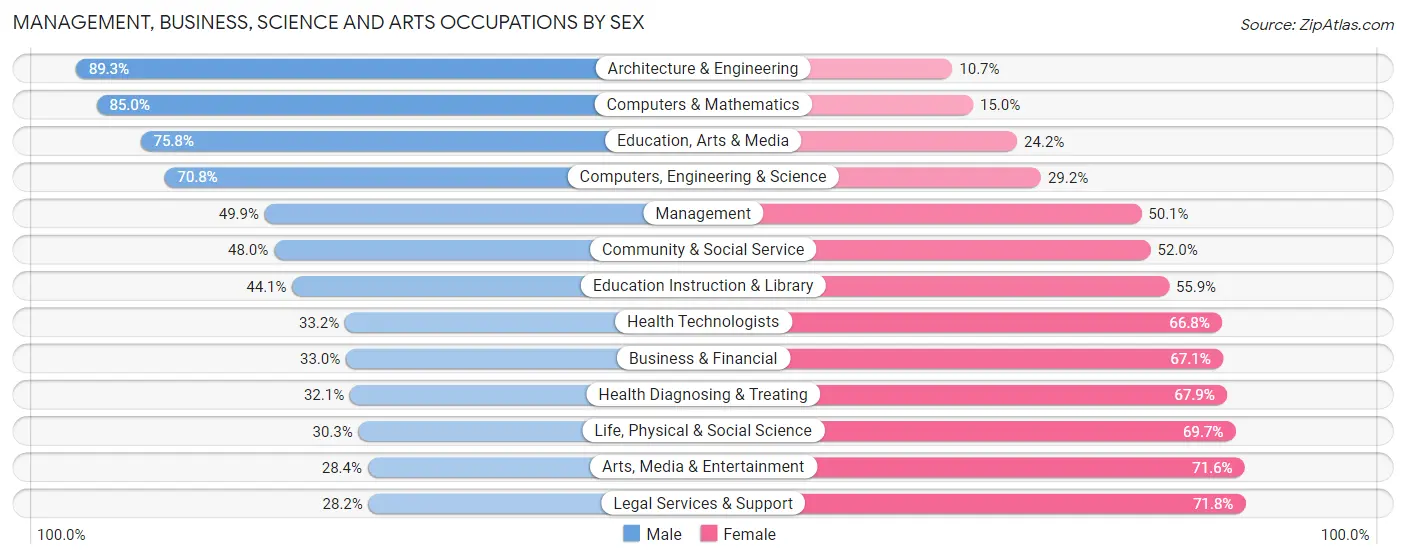
Management, Business, Science and Arts Occupations by Sex
Within the Management, Business, Science and Arts occupations in Walla Walla, the most male-oriented occupations are Architecture & Engineering (89.3%), Computers & Mathematics (85.0%), and Education, Arts & Media (75.8%), while the most female-oriented occupations are Legal Services & Support (71.8%), Arts, Media & Entertainment (71.6%), and Life, Physical & Social Science (69.7%).
| Occupation | Male | Female |
| Management | 723 (49.9%) | 726 (50.1%) |
| Business & Financial | 174 (33.0%) | 354 (67.0%) |
| Computers, Engineering & Science | 221 (70.8%) | 91 (29.2%) |
| Computers & Mathematics | 102 (85.0%) | 18 (15.0%) |
| Architecture & Engineering | 92 (89.3%) | 11 (10.7%) |
| Life, Physical & Social Science | 27 (30.3%) | 62 (69.7%) |
| Community & Social Service | 943 (48.0%) | 1,023 (52.0%) |
| Education, Arts & Media | 332 (75.8%) | 106 (24.2%) |
| Legal Services & Support | 37 (28.2%) | 94 (71.8%) |
| Education Instruction & Library | 497 (44.1%) | 629 (55.9%) |
| Arts, Media & Entertainment | 77 (28.4%) | 194 (71.6%) |
| Health Diagnosing & Treating | 239 (32.1%) | 505 (67.9%) |
| Health Technologists | 190 (33.2%) | 383 (66.8%) |
| Total (Category) | 2,300 (46.0%) | 2,699 (54.0%) |
| Total (Overall) | 7,458 (49.7%) | 7,544 (50.3%) |
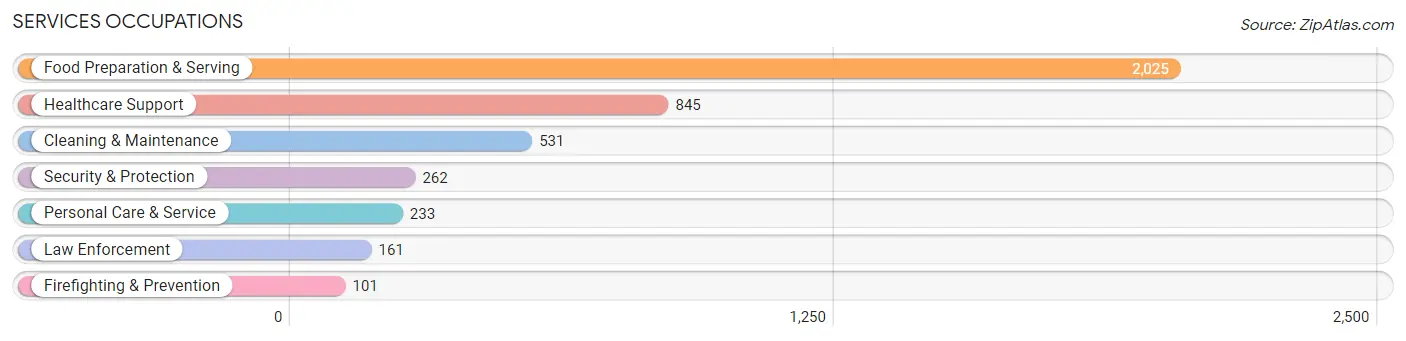
Services Occupations
The most common Services occupations in Walla Walla are Food Preparation & Serving (2,025 | 13.5%), Healthcare Support (845 | 5.6%), Cleaning & Maintenance (531 | 3.5%), Security & Protection (262 | 1.8%), and Personal Care & Service (233 | 1.5%).
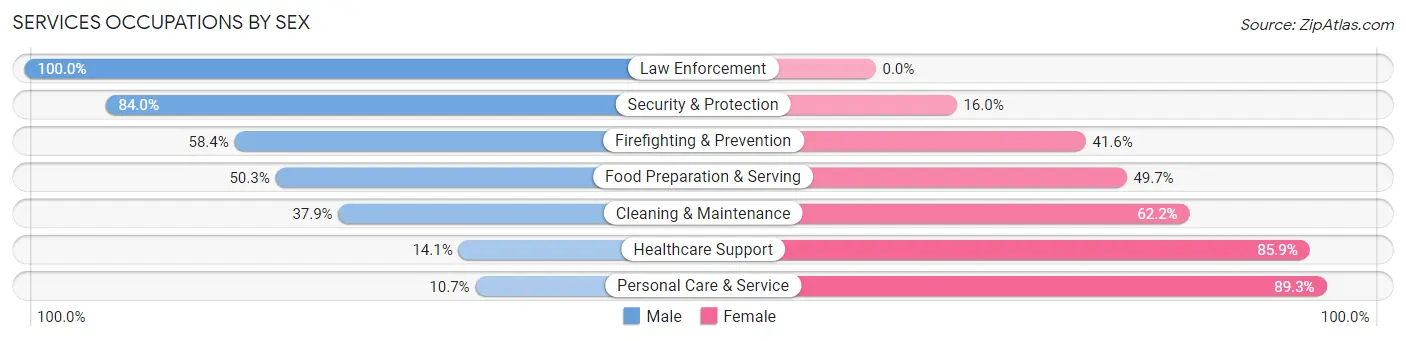
Services Occupations by Sex
Within the Services occupations in Walla Walla, the most male-oriented occupations are Law Enforcement (100.0%), Security & Protection (84.0%), and Firefighting & Prevention (58.4%), while the most female-oriented occupations are Personal Care & Service (89.3%), Healthcare Support (85.9%), and Cleaning & Maintenance (62.2%).
| Occupation | Male | Female |
| Healthcare Support | 119 (14.1%) | 726 (85.9%) |
| Security & Protection | 220 (84.0%) | 42 (16.0%) |
| Firefighting & Prevention | 59 (58.4%) | 42 (41.6%) |
| Law Enforcement | 161 (100.0%) | 0 (0.0%) |
| Food Preparation & Serving | 1,019 (50.3%) | 1,006 (49.7%) |
| Cleaning & Maintenance | 201 (37.9%) | 330 (62.2%) |
| Personal Care & Service | 25 (10.7%) | 208 (89.3%) |
| Total (Category) | 1,584 (40.7%) | 2,312 (59.3%) |
| Total (Overall) | 7,458 (49.7%) | 7,544 (50.3%) |
Sales and Office Occupations
The most common Sales and Office occupations in Walla Walla are Sales & Related (1,687 | 11.3%), and Office & Administration (1,243 | 8.3%).
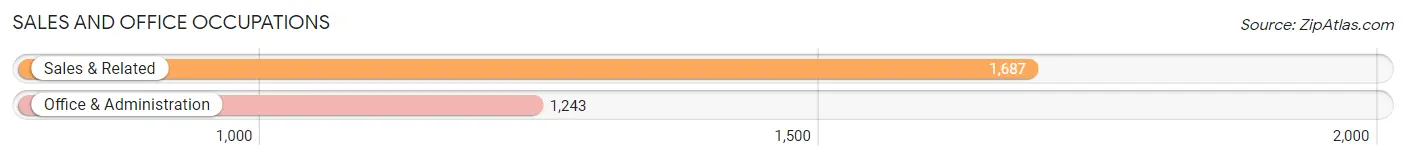
Sales and Office Occupations by Sex
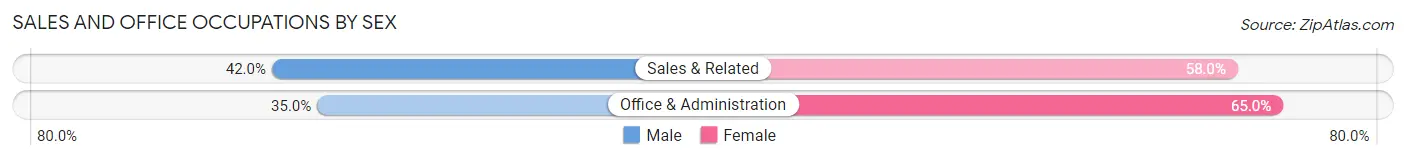
| Occupation | Male | Female |
| Sales & Related | 708 (42.0%) | 979 (58.0%) |
| Office & Administration | 435 (35.0%) | 808 (65.0%) |
| Total (Category) | 1,143 (39.0%) | 1,787 (61.0%) |
| Total (Overall) | 7,458 (49.7%) | 7,544 (50.3%) |
Natural Resources, Construction and Maintenance Occupations
The most common Natural Resources, Construction and Maintenance occupations in Walla Walla are Construction & Extraction (425 | 2.8%), Installation, Maintenance & Repair (313 | 2.1%), and Farming, Fishing & Forestry (236 | 1.6%).
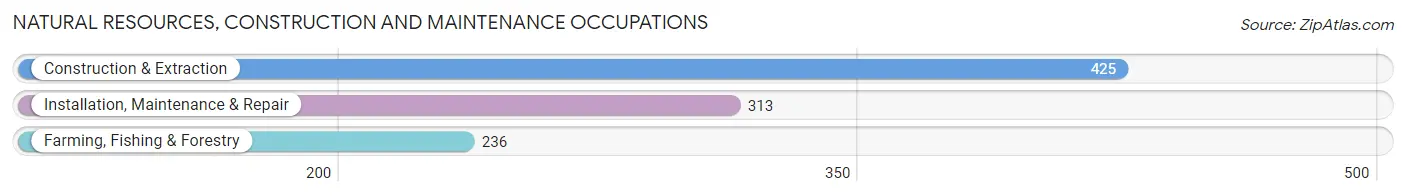
Natural Resources, Construction and Maintenance Occupations by Sex
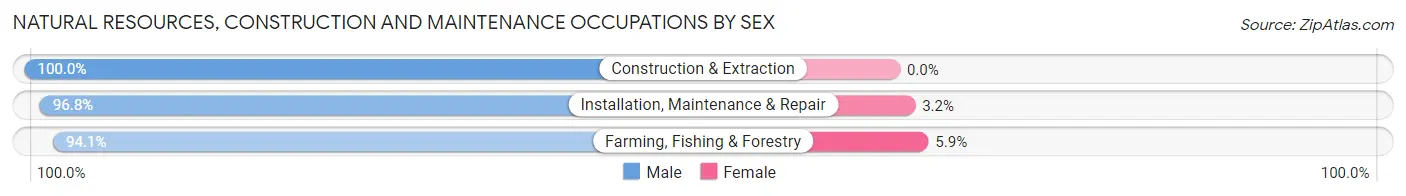
| Occupation | Male | Female |
| Farming, Fishing & Forestry | 222 (94.1%) | 14 (5.9%) |
| Construction & Extraction | 425 (100.0%) | 0 (0.0%) |
| Installation, Maintenance & Repair | 303 (96.8%) | 10 (3.2%) |
| Total (Category) | 950 (97.5%) | 24 (2.5%) |
| Total (Overall) | 7,458 (49.7%) | 7,544 (50.3%) |
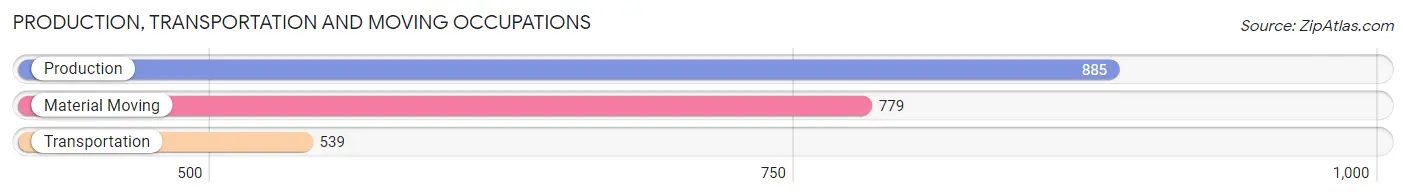
Production, Transportation and Moving Occupations
The most common Production, Transportation and Moving occupations in Walla Walla are Production (885 | 5.9%), Material Moving (779 | 5.2%), and Transportation (539 | 3.6%).
Production, Transportation and Moving Occupations by Sex
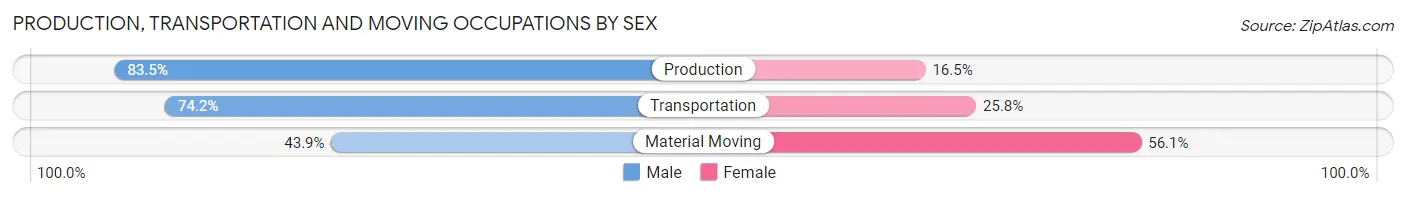
| Occupation | Male | Female |
| Production | 739 (83.5%) | 146 (16.5%) |
| Transportation | 400 (74.2%) | 139 (25.8%) |
| Material Moving | 342 (43.9%) | 437 (56.1%) |
| Total (Category) | 1,481 (67.2%) | 722 (32.8%) |
| Total (Overall) | 7,458 (49.7%) | 7,544 (50.3%) |
Employment Industries by Sex in Walla Walla
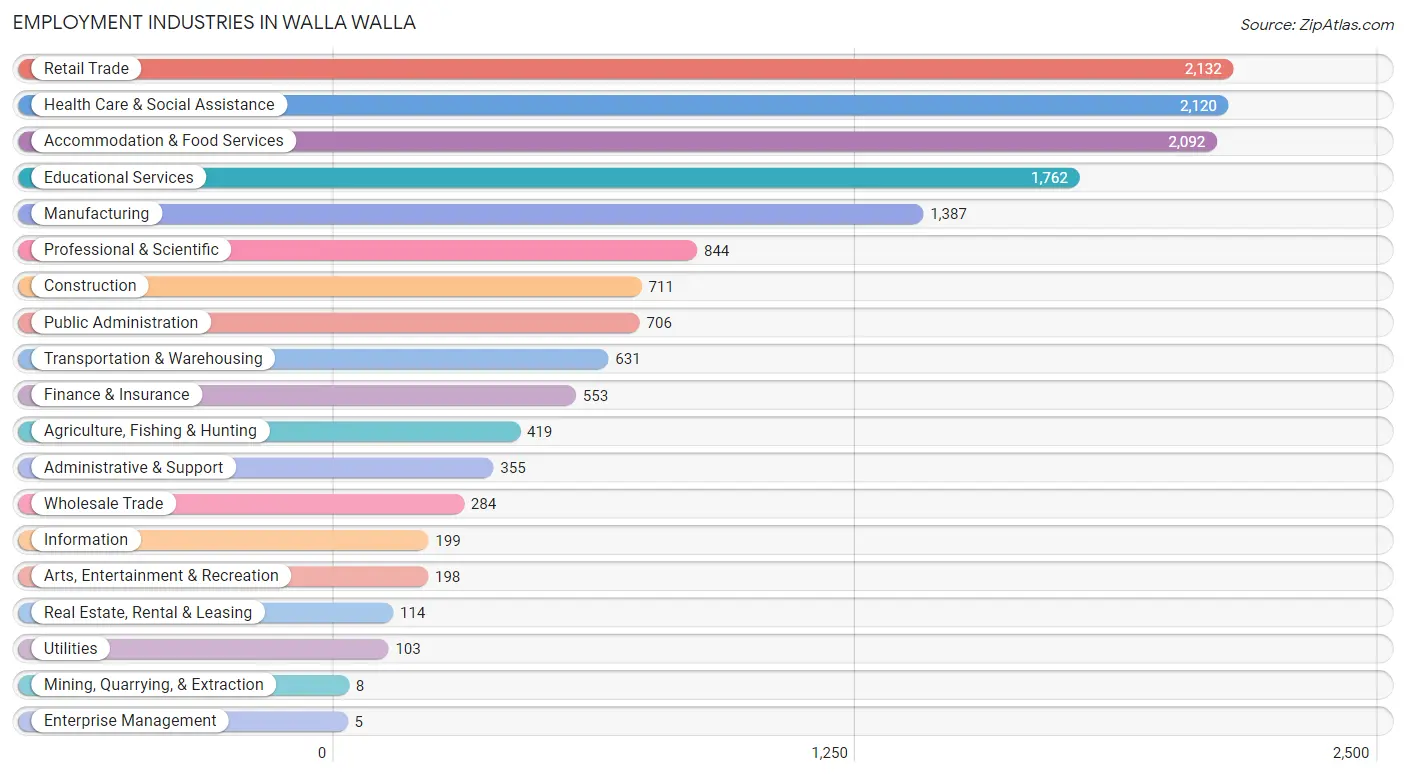
Employment Industries in Walla Walla
The major employment industries in Walla Walla include Retail Trade (2,132 | 14.2%), Health Care & Social Assistance (2,120 | 14.1%), Accommodation & Food Services (2,092 | 13.9%), Educational Services (1,762 | 11.7%), and Manufacturing (1,387 | 9.2%).
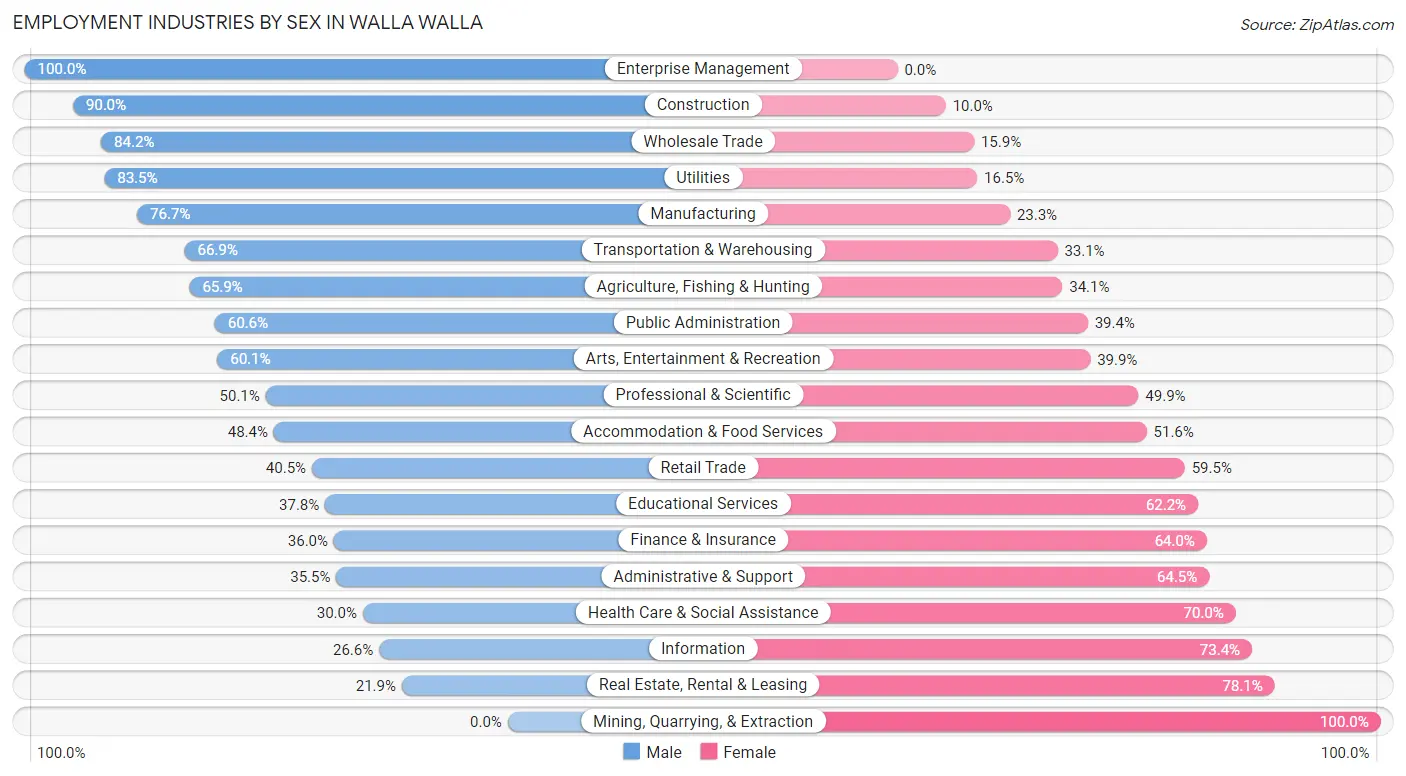
Employment Industries by Sex in Walla Walla
The Walla Walla industries that see more men than women are Enterprise Management (100.0%), Construction (90.0%), and Wholesale Trade (84.2%), whereas the industries that tend to have a higher number of women are Mining, Quarrying, & Extraction (100.0%), Real Estate, Rental & Leasing (78.1%), and Information (73.4%).
| Industry | Male | Female |
| Agriculture, Fishing & Hunting | 276 (65.9%) | 143 (34.1%) |
| Mining, Quarrying, & Extraction | 0 (0.0%) | 8 (100.0%) |
| Construction | 640 (90.0%) | 71 (10.0%) |
| Manufacturing | 1,064 (76.7%) | 323 (23.3%) |
| Wholesale Trade | 239 (84.2%) | 45 (15.9%) |
| Retail Trade | 864 (40.5%) | 1,268 (59.5%) |
| Transportation & Warehousing | 422 (66.9%) | 209 (33.1%) |
| Utilities | 86 (83.5%) | 17 (16.5%) |
| Information | 53 (26.6%) | 146 (73.4%) |
| Finance & Insurance | 199 (36.0%) | 354 (64.0%) |
| Real Estate, Rental & Leasing | 25 (21.9%) | 89 (78.1%) |
| Professional & Scientific | 423 (50.1%) | 421 (49.9%) |
| Enterprise Management | 5 (100.0%) | 0 (0.0%) |
| Administrative & Support | 126 (35.5%) | 229 (64.5%) |
| Educational Services | 666 (37.8%) | 1,096 (62.2%) |
| Health Care & Social Assistance | 636 (30.0%) | 1,484 (70.0%) |
| Arts, Entertainment & Recreation | 119 (60.1%) | 79 (39.9%) |
| Accommodation & Food Services | 1,013 (48.4%) | 1,079 (51.6%) |
| Public Administration | 428 (60.6%) | 278 (39.4%) |
| Total | 7,458 (49.7%) | 7,544 (50.3%) |
Education in Walla Walla
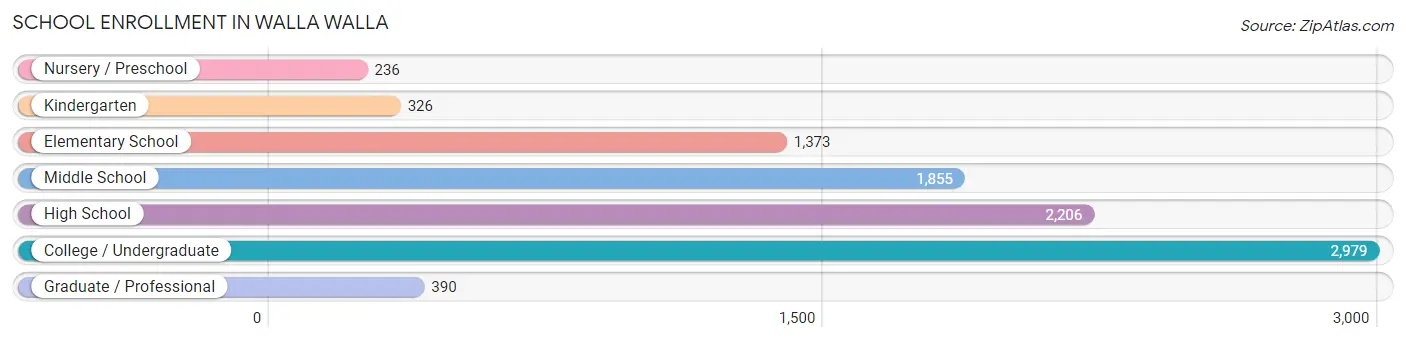
School Enrollment in Walla Walla
The most common levels of schooling among the 9,365 students in Walla Walla are college / undergraduate (2,979 | 31.8%), high school (2,206 | 23.6%), and middle school (1,855 | 19.8%).
| School Level | # Students | % Students |
| Nursery / Preschool | 236 | 2.5% |
| Kindergarten | 326 | 3.5% |
| Elementary School | 1,373 | 14.7% |
| Middle School | 1,855 | 19.8% |
| High School | 2,206 | 23.6% |
| College / Undergraduate | 2,979 | 31.8% |
| Graduate / Professional | 390 | 4.2% |
| Total | 9,365 | 100.0% |
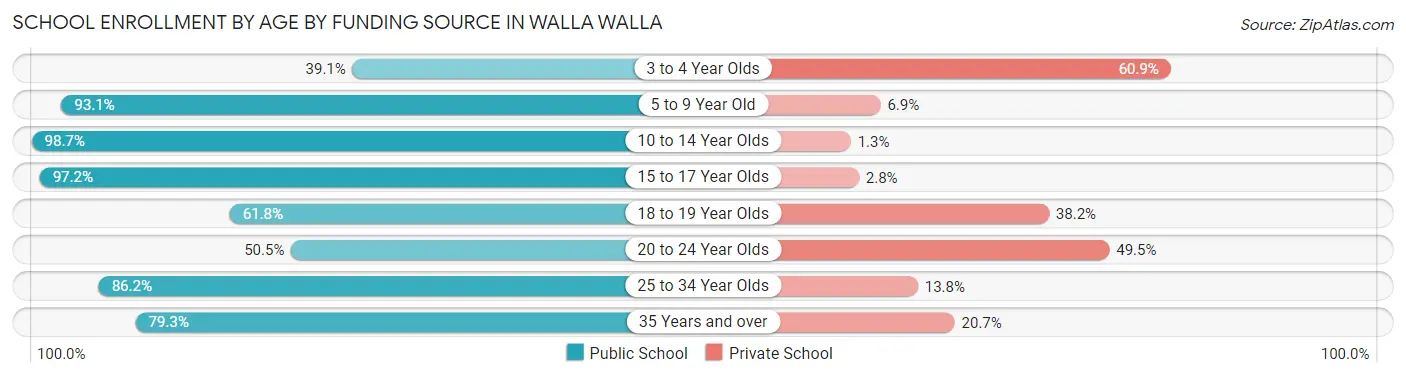
School Enrollment by Age by Funding Source in Walla Walla
Out of a total of 9,365 students who are enrolled in schools in Walla Walla, 1,779 (19.0%) attend a private institution, while the remaining 7,586 (81.0%) are enrolled in public schools. The age group of 3 to 4 year olds has the highest likelihood of being enrolled in private schools, with 120 (60.9% in the age bracket) enrolled. Conversely, the age group of 10 to 14 year olds has the lowest likelihood of being enrolled in a private school, with 2,111 (98.7% in the age bracket) attending a public institution.
| Age Bracket | Public School | Private School |
| 3 to 4 Year Olds | 77 (39.1%) | 120 (60.9%) |
| 5 to 9 Year Old | 1,412 (93.1%) | 104 (6.9%) |
| 10 to 14 Year Olds | 2,111 (98.7%) | 28 (1.3%) |
| 15 to 17 Year Olds | 1,269 (97.2%) | 37 (2.8%) |
| 18 to 19 Year Olds | 1,005 (61.8%) | 622 (38.2%) |
| 20 to 24 Year Olds | 675 (50.5%) | 661 (49.5%) |
| 25 to 34 Year Olds | 680 (86.2%) | 109 (13.8%) |
| 35 Years and over | 361 (79.3%) | 94 (20.7%) |
| Total | 7,586 (81.0%) | 1,779 (19.0%) |
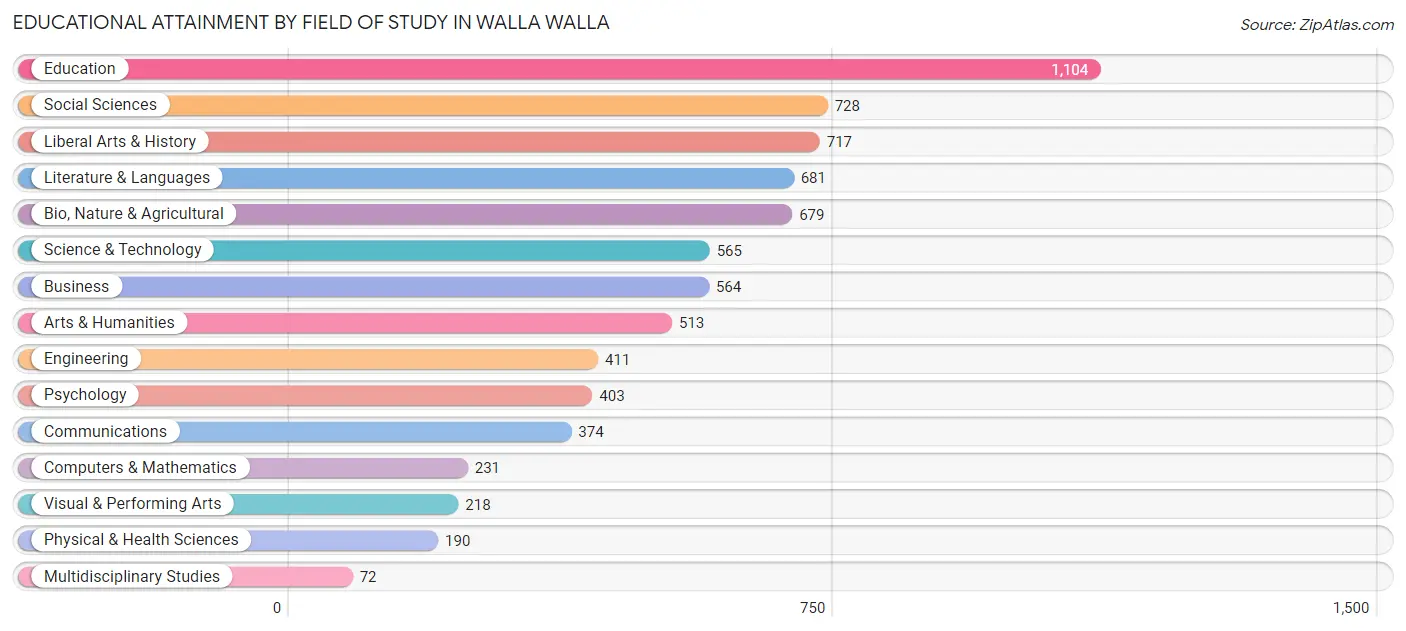
Educational Attainment by Field of Study in Walla Walla
Education (1,104 | 14.8%), social sciences (728 | 9.8%), liberal arts & history (717 | 9.6%), literature & languages (681 | 9.1%), and bio, nature & agricultural (679 | 9.1%) are the most common fields of study among 7,450 individuals in Walla Walla who have obtained a bachelor's degree or higher.
| Field of Study | # Graduates | % Graduates |
| Computers & Mathematics | 231 | 3.1% |
| Bio, Nature & Agricultural | 679 | 9.1% |
| Physical & Health Sciences | 190 | 2.5% |
| Psychology | 403 | 5.4% |
| Social Sciences | 728 | 9.8% |
| Engineering | 411 | 5.5% |
| Multidisciplinary Studies | 72 | 1.0% |
| Science & Technology | 565 | 7.6% |
| Business | 564 | 7.6% |
| Education | 1,104 | 14.8% |
| Literature & Languages | 681 | 9.1% |
| Liberal Arts & History | 717 | 9.6% |
| Visual & Performing Arts | 218 | 2.9% |
| Communications | 374 | 5.0% |
| Arts & Humanities | 513 | 6.9% |
| Total | 7,450 | 100.0% |
Transportation & Commute in Walla Walla
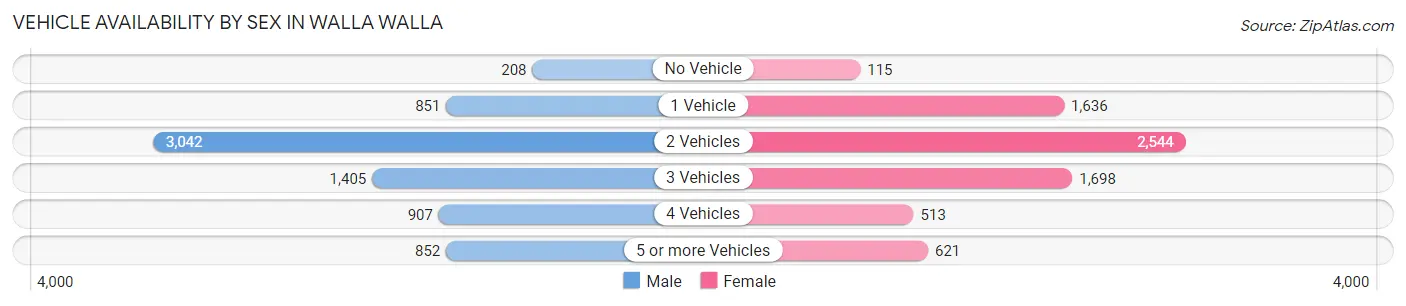
Vehicle Availability by Sex in Walla Walla
The most prevalent vehicle ownership categories in Walla Walla are males with 2 vehicles (3,042, accounting for 41.9%) and females with 2 vehicles (2,544, making up 42.7%).
| Vehicles Available | Male | Female |
| No Vehicle | 208 (2.9%) | 115 (1.6%) |
| 1 Vehicle | 851 (11.7%) | 1,636 (23.0%) |
| 2 Vehicles | 3,042 (41.9%) | 2,544 (35.7%) |
| 3 Vehicles | 1,405 (19.3%) | 1,698 (23.8%) |
| 4 Vehicles | 907 (12.5%) | 513 (7.2%) |
| 5 or more Vehicles | 852 (11.7%) | 621 (8.7%) |
| Total | 7,265 (100.0%) | 7,127 (100.0%) |
Commute Time in Walla Walla
The most frequently occuring commute durations in Walla Walla are 5 to 9 minutes (4,304 commuters, 33.1%), 10 to 14 minutes (4,021 commuters, 30.9%), and 15 to 19 minutes (1,500 commuters, 11.5%).
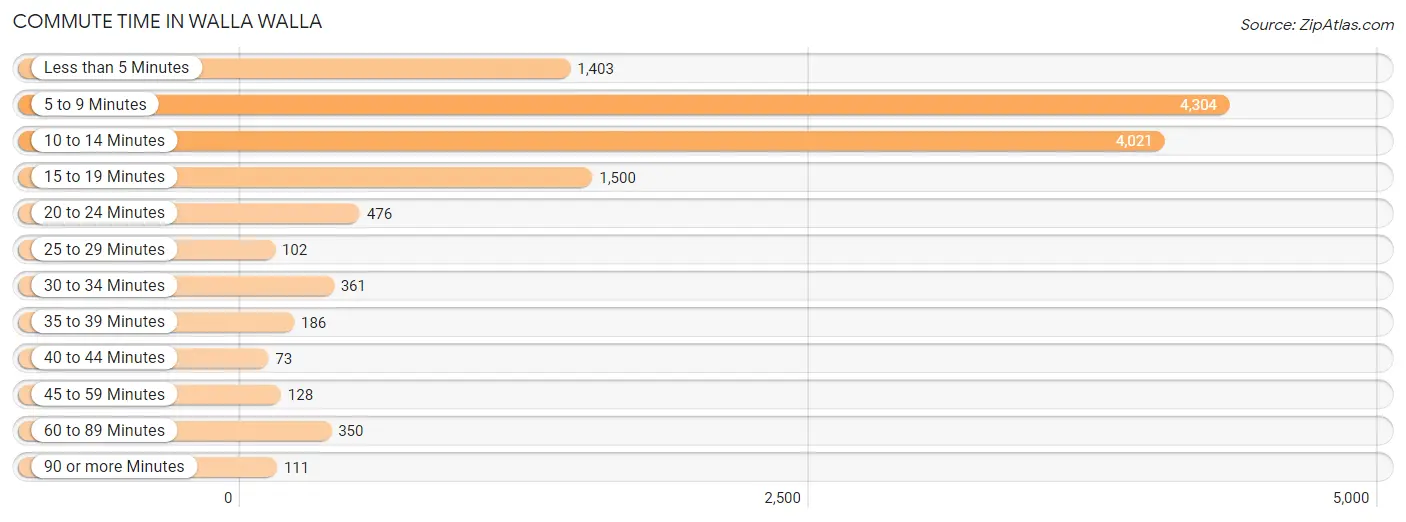
| Commute Time | # Commuters | % Commuters |
| Less than 5 Minutes | 1,403 | 10.8% |
| 5 to 9 Minutes | 4,304 | 33.1% |
| 10 to 14 Minutes | 4,021 | 30.9% |
| 15 to 19 Minutes | 1,500 | 11.5% |
| 20 to 24 Minutes | 476 | 3.7% |
| 25 to 29 Minutes | 102 | 0.8% |
| 30 to 34 Minutes | 361 | 2.8% |
| 35 to 39 Minutes | 186 | 1.4% |
| 40 to 44 Minutes | 73 | 0.6% |
| 45 to 59 Minutes | 128 | 1.0% |
| 60 to 89 Minutes | 350 | 2.7% |
| 90 or more Minutes | 111 | 0.9% |
Commute Time by Sex in Walla Walla
The most common commute times in Walla Walla are 5 to 9 minutes (2,093 commuters, 31.6%) for males and 5 to 9 minutes (2,211 commuters, 34.6%) for females.
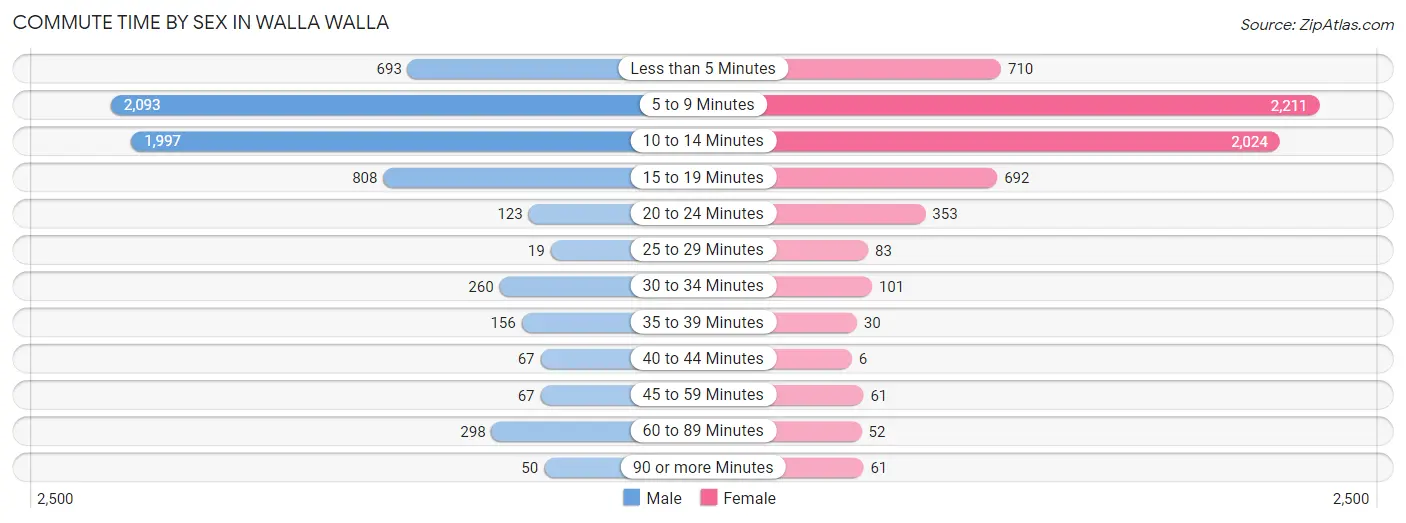
| Commute Time | Male | Female |
| Less than 5 Minutes | 693 (10.4%) | 710 (11.1%) |
| 5 to 9 Minutes | 2,093 (31.6%) | 2,211 (34.6%) |
| 10 to 14 Minutes | 1,997 (30.1%) | 2,024 (31.7%) |
| 15 to 19 Minutes | 808 (12.2%) | 692 (10.8%) |
| 20 to 24 Minutes | 123 (1.8%) | 353 (5.5%) |
| 25 to 29 Minutes | 19 (0.3%) | 83 (1.3%) |
| 30 to 34 Minutes | 260 (3.9%) | 101 (1.6%) |
| 35 to 39 Minutes | 156 (2.4%) | 30 (0.5%) |
| 40 to 44 Minutes | 67 (1.0%) | 6 (0.1%) |
| 45 to 59 Minutes | 67 (1.0%) | 61 (1.0%) |
| 60 to 89 Minutes | 298 (4.5%) | 52 (0.8%) |
| 90 or more Minutes | 50 (0.7%) | 61 (1.0%) |
Time of Departure to Work by Sex in Walla Walla
The most frequent times of departure to work in Walla Walla are 7:30 AM to 7:59 AM (922, 13.9%) for males and 7:30 AM to 7:59 AM (879, 13.8%) for females.
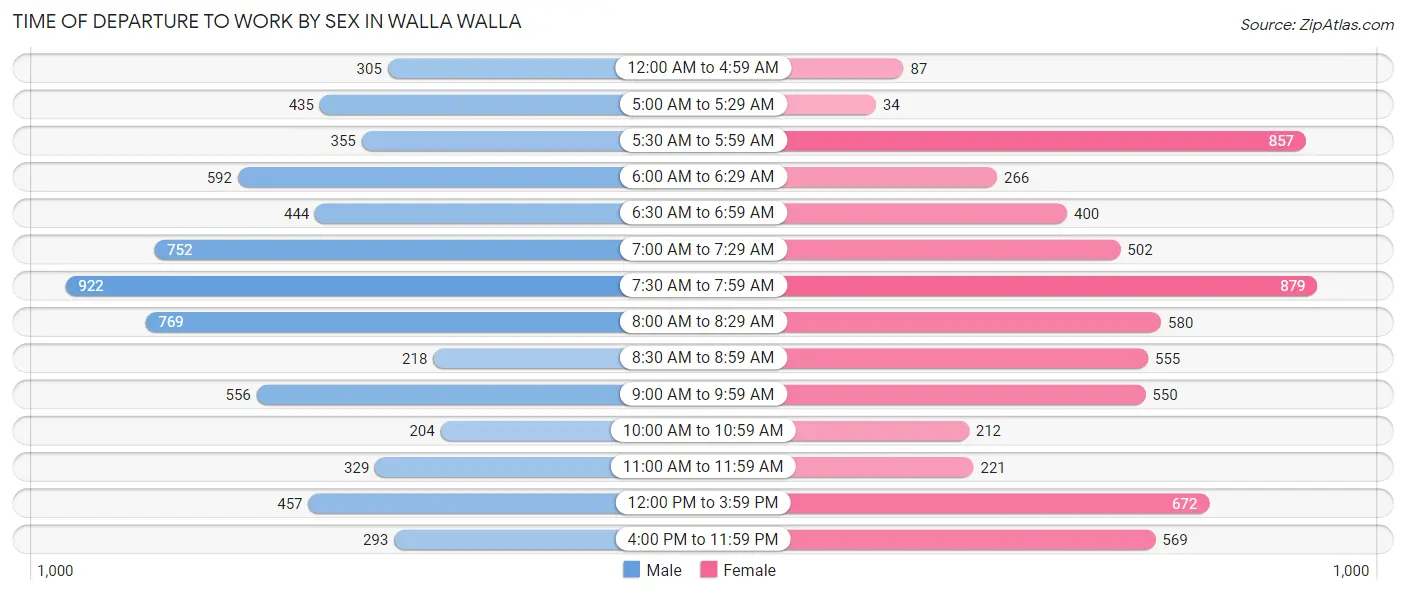
| Time of Departure | Male | Female |
| 12:00 AM to 4:59 AM | 305 (4.6%) | 87 (1.4%) |
| 5:00 AM to 5:29 AM | 435 (6.6%) | 34 (0.5%) |
| 5:30 AM to 5:59 AM | 355 (5.3%) | 857 (13.4%) |
| 6:00 AM to 6:29 AM | 592 (8.9%) | 266 (4.2%) |
| 6:30 AM to 6:59 AM | 444 (6.7%) | 400 (6.3%) |
| 7:00 AM to 7:29 AM | 752 (11.3%) | 502 (7.9%) |
| 7:30 AM to 7:59 AM | 922 (13.9%) | 879 (13.8%) |
| 8:00 AM to 8:29 AM | 769 (11.6%) | 580 (9.1%) |
| 8:30 AM to 8:59 AM | 218 (3.3%) | 555 (8.7%) |
| 9:00 AM to 9:59 AM | 556 (8.4%) | 550 (8.6%) |
| 10:00 AM to 10:59 AM | 204 (3.1%) | 212 (3.3%) |
| 11:00 AM to 11:59 AM | 329 (5.0%) | 221 (3.5%) |
| 12:00 PM to 3:59 PM | 457 (6.9%) | 672 (10.5%) |
| 4:00 PM to 11:59 PM | 293 (4.4%) | 569 (8.9%) |
| Total | 6,631 (100.0%) | 6,384 (100.0%) |
Housing Occupancy in Walla Walla
Occupancy by Ownership in Walla Walla
Of the total 12,865 dwellings in Walla Walla, owner-occupied units account for 7,774 (60.4%), while renter-occupied units make up 5,091 (39.6%).
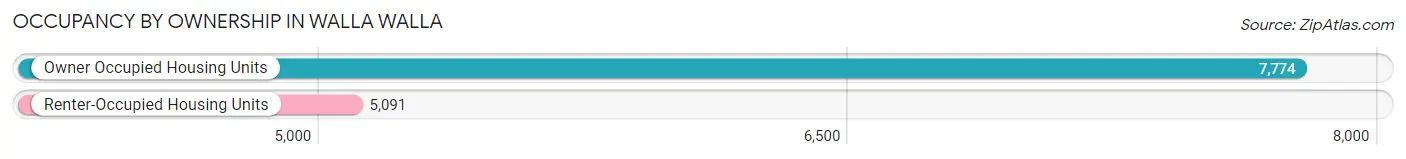
| Occupancy | # Housing Units | % Housing Units |
| Owner Occupied Housing Units | 7,774 | 60.4% |
| Renter-Occupied Housing Units | 5,091 | 39.6% |
| Total Occupied Housing Units | 12,865 | 100.0% |
Occupancy by Household Size in Walla Walla
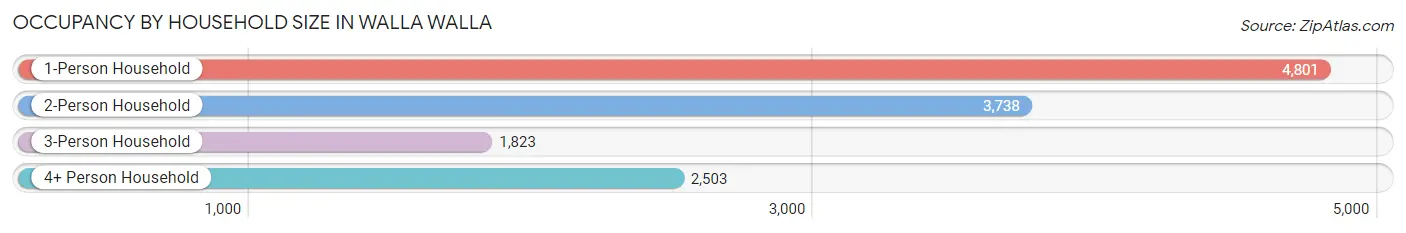
| Household Size | # Housing Units | % Housing Units |
| 1-Person Household | 4,801 | 37.3% |
| 2-Person Household | 3,738 | 29.1% |
| 3-Person Household | 1,823 | 14.2% |
| 4+ Person Household | 2,503 | 19.5% |
| Total Housing Units | 12,865 | 100.0% |
Occupancy by Ownership by Household Size in Walla Walla
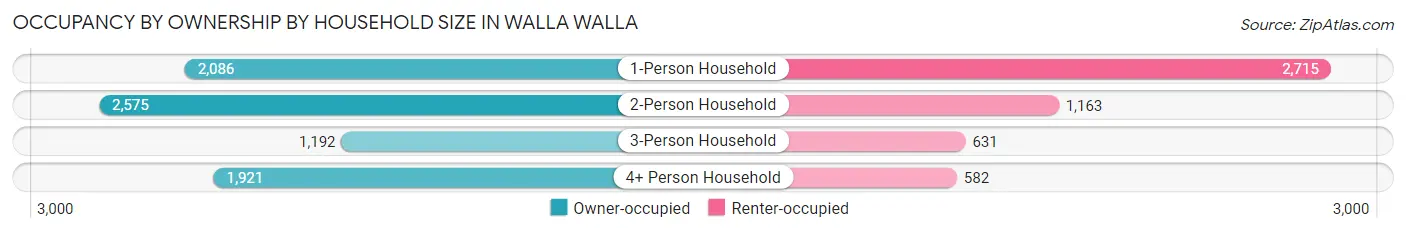
| Household Size | Owner-occupied | Renter-occupied |
| 1-Person Household | 2,086 (43.4%) | 2,715 (56.6%) |
| 2-Person Household | 2,575 (68.9%) | 1,163 (31.1%) |
| 3-Person Household | 1,192 (65.4%) | 631 (34.6%) |
| 4+ Person Household | 1,921 (76.7%) | 582 (23.3%) |
| Total Housing Units | 7,774 (60.4%) | 5,091 (39.6%) |
Occupancy by Educational Attainment in Walla Walla
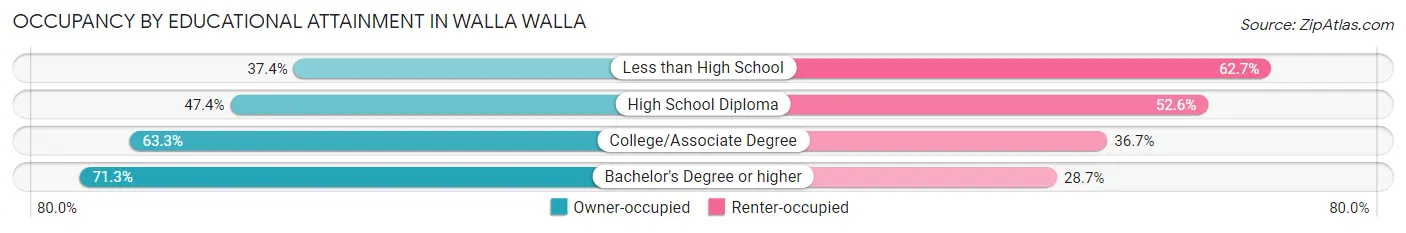
| Household Size | Owner-occupied | Renter-occupied |
| Less than High School | 375 (37.3%) | 629 (62.6%) |
| High School Diploma | 1,299 (47.4%) | 1,443 (52.6%) |
| College/Associate Degree | 3,188 (63.3%) | 1,846 (36.7%) |
| Bachelor's Degree or higher | 2,912 (71.3%) | 1,173 (28.7%) |
Occupancy by Age of Householder in Walla Walla
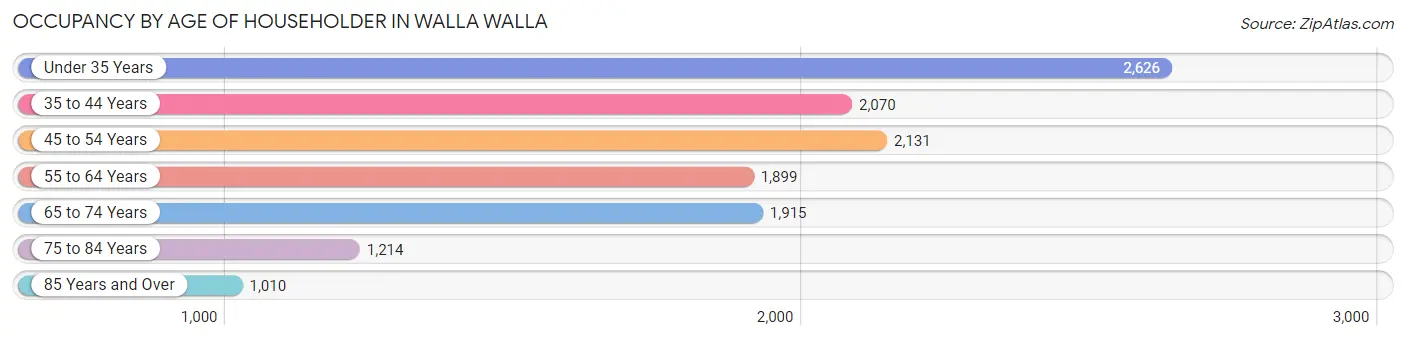
| Age Bracket | # Households | % Households |
| Under 35 Years | 2,626 | 20.4% |
| 35 to 44 Years | 2,070 | 16.1% |
| 45 to 54 Years | 2,131 | 16.6% |
| 55 to 64 Years | 1,899 | 14.8% |
| 65 to 74 Years | 1,915 | 14.9% |
| 75 to 84 Years | 1,214 | 9.4% |
| 85 Years and Over | 1,010 | 7.9% |
| Total | 12,865 | 100.0% |
Housing Finances in Walla Walla
Median Income by Occupancy in Walla Walla
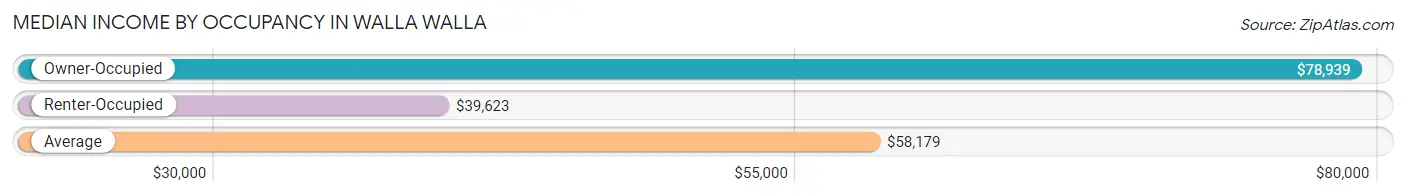
| Occupancy Type | # Households | Median Income |
| Owner-Occupied | 7,774 (60.4%) | $78,939 |
| Renter-Occupied | 5,091 (39.6%) | $39,623 |
| Average | 12,865 (100.0%) | $58,179 |
Occupancy by Householder Income Bracket in Walla Walla
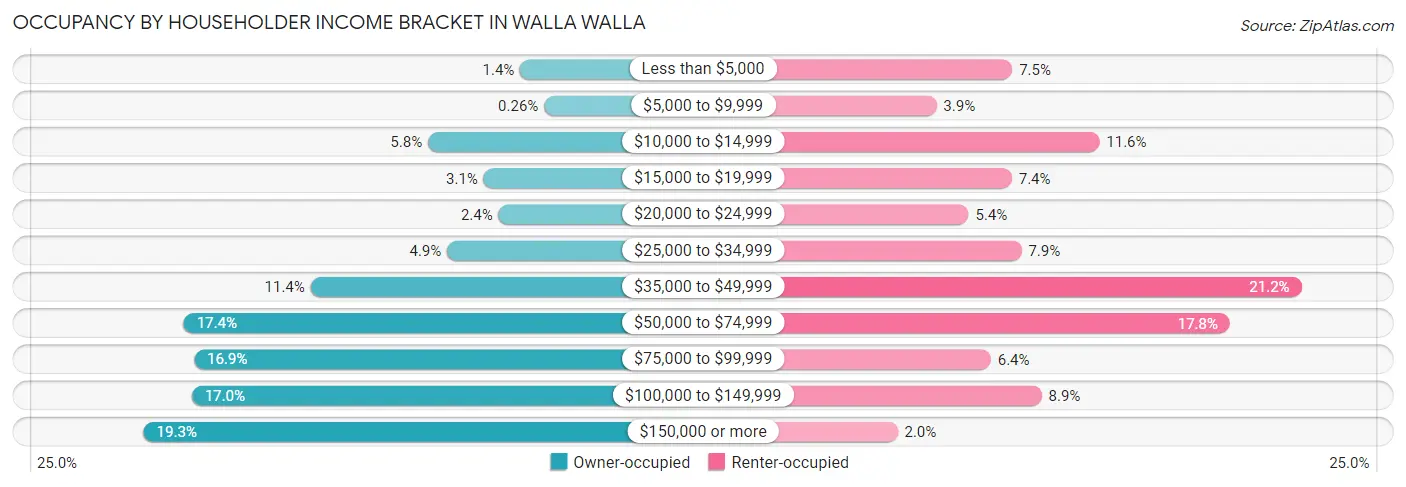
| Income Bracket | Owner-occupied | Renter-occupied |
| Less than $5,000 | 109 (1.4%) | 380 (7.5%) |
| $5,000 to $9,999 | 20 (0.3%) | 196 (3.8%) |
| $10,000 to $14,999 | 450 (5.8%) | 591 (11.6%) |
| $15,000 to $19,999 | 244 (3.1%) | 379 (7.4%) |
| $20,000 to $24,999 | 189 (2.4%) | 274 (5.4%) |
| $25,000 to $34,999 | 379 (4.9%) | 402 (7.9%) |
| $35,000 to $49,999 | 885 (11.4%) | 1,081 (21.2%) |
| $50,000 to $74,999 | 1,354 (17.4%) | 907 (17.8%) |
| $75,000 to $99,999 | 1,316 (16.9%) | 328 (6.4%) |
| $100,000 to $149,999 | 1,325 (17.0%) | 451 (8.9%) |
| $150,000 or more | 1,503 (19.3%) | 102 (2.0%) |
| Total | 7,774 (100.0%) | 5,091 (100.0%) |
Monthly Housing Cost Tiers in Walla Walla
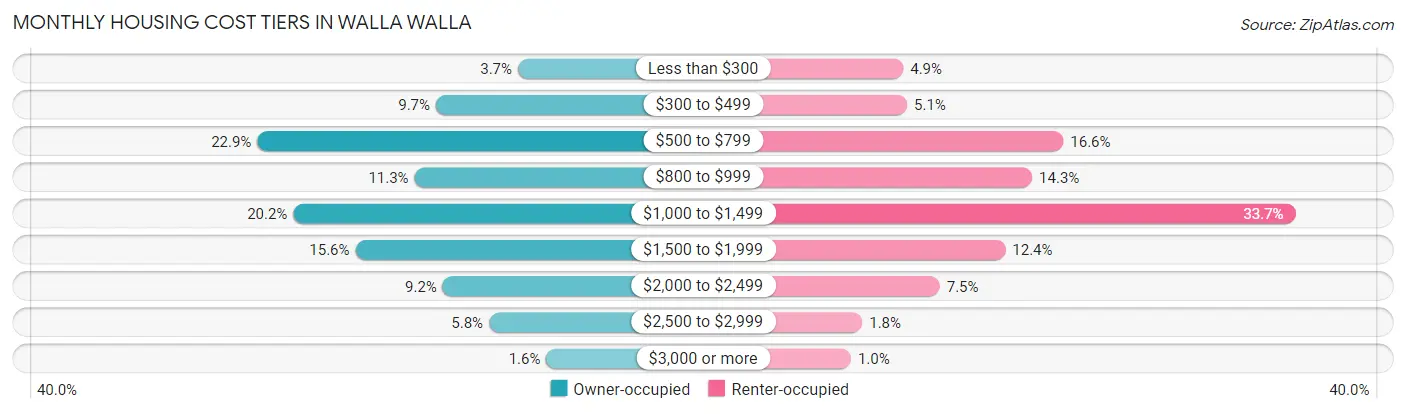
| Monthly Cost | Owner-occupied | Renter-occupied |
| Less than $300 | 285 (3.7%) | 247 (4.9%) |
| $300 to $499 | 755 (9.7%) | 261 (5.1%) |
| $500 to $799 | 1,778 (22.9%) | 847 (16.6%) |
| $800 to $999 | 878 (11.3%) | 730 (14.3%) |
| $1,000 to $1,499 | 1,572 (20.2%) | 1,717 (33.7%) |
| $1,500 to $1,999 | 1,216 (15.6%) | 630 (12.4%) |
| $2,000 to $2,499 | 716 (9.2%) | 384 (7.5%) |
| $2,500 to $2,999 | 451 (5.8%) | 93 (1.8%) |
| $3,000 or more | 123 (1.6%) | 51 (1.0%) |
| Total | 7,774 (100.0%) | 5,091 (100.0%) |
Physical Housing Characteristics in Walla Walla
Housing Structures in Walla Walla
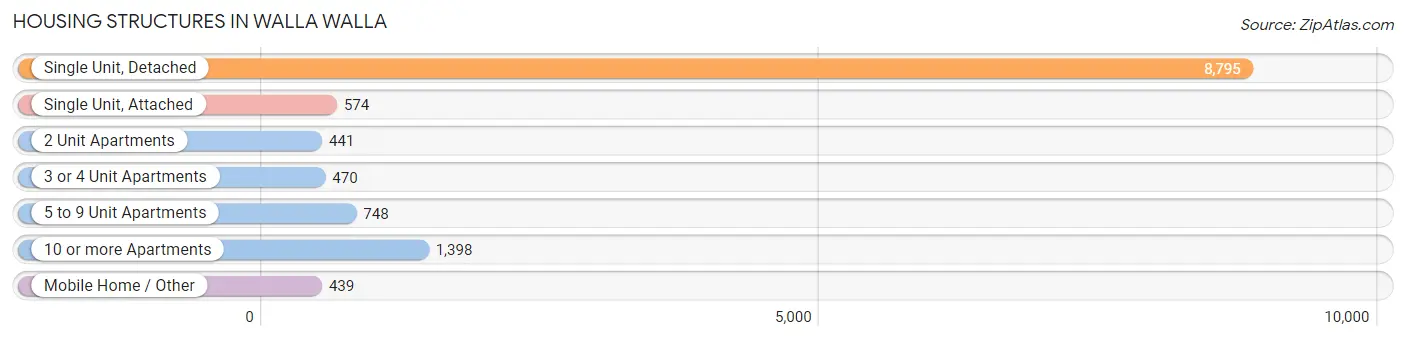
| Structure Type | # Housing Units | % Housing Units |
| Single Unit, Detached | 8,795 | 68.4% |
| Single Unit, Attached | 574 | 4.5% |
| 2 Unit Apartments | 441 | 3.4% |
| 3 or 4 Unit Apartments | 470 | 3.6% |
| 5 to 9 Unit Apartments | 748 | 5.8% |
| 10 or more Apartments | 1,398 | 10.9% |
| Mobile Home / Other | 439 | 3.4% |
| Total | 12,865 | 100.0% |
Housing Structures by Occupancy in Walla Walla
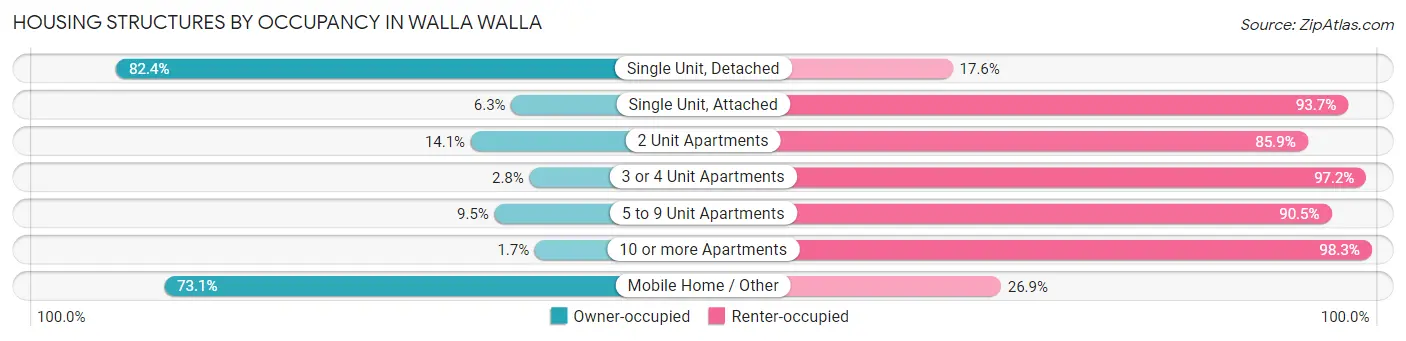
| Structure Type | Owner-occupied | Renter-occupied |
| Single Unit, Detached | 7,247 (82.4%) | 1,548 (17.6%) |
| Single Unit, Attached | 36 (6.3%) | 538 (93.7%) |
| 2 Unit Apartments | 62 (14.1%) | 379 (85.9%) |
| 3 or 4 Unit Apartments | 13 (2.8%) | 457 (97.2%) |
| 5 to 9 Unit Apartments | 71 (9.5%) | 677 (90.5%) |
| 10 or more Apartments | 24 (1.7%) | 1,374 (98.3%) |
| Mobile Home / Other | 321 (73.1%) | 118 (26.9%) |
| Total | 7,774 (60.4%) | 5,091 (39.6%) |
Housing Structures by Number of Rooms in Walla Walla
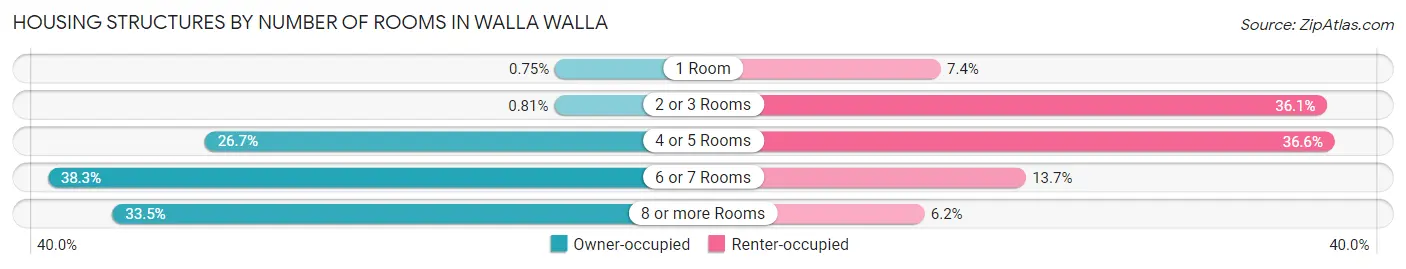
| Number of Rooms | Owner-occupied | Renter-occupied |
| 1 Room | 58 (0.7%) | 377 (7.4%) |
| 2 or 3 Rooms | 63 (0.8%) | 1,836 (36.1%) |
| 4 or 5 Rooms | 2,073 (26.7%) | 1,864 (36.6%) |
| 6 or 7 Rooms | 2,976 (38.3%) | 698 (13.7%) |
| 8 or more Rooms | 2,604 (33.5%) | 316 (6.2%) |
| Total | 7,774 (100.0%) | 5,091 (100.0%) |
Housing Structure by Heating Type in Walla Walla
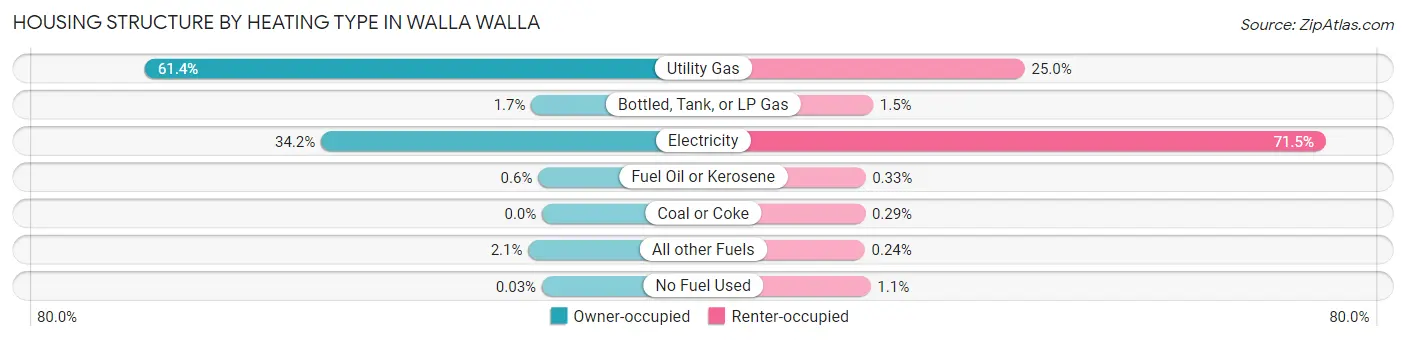
| Heating Type | Owner-occupied | Renter-occupied |
| Utility Gas | 4,773 (61.4%) | 1,271 (25.0%) |
| Bottled, Tank, or LP Gas | 130 (1.7%) | 77 (1.5%) |
| Electricity | 2,656 (34.2%) | 3,641 (71.5%) |
| Fuel Oil or Kerosene | 47 (0.6%) | 17 (0.3%) |
| Coal or Coke | 0 (0.0%) | 15 (0.3%) |
| All other Fuels | 166 (2.1%) | 12 (0.2%) |
| No Fuel Used | 2 (0.0%) | 58 (1.1%) |
| Total | 7,774 (100.0%) | 5,091 (100.0%) |
Household Vehicle Usage in Walla Walla
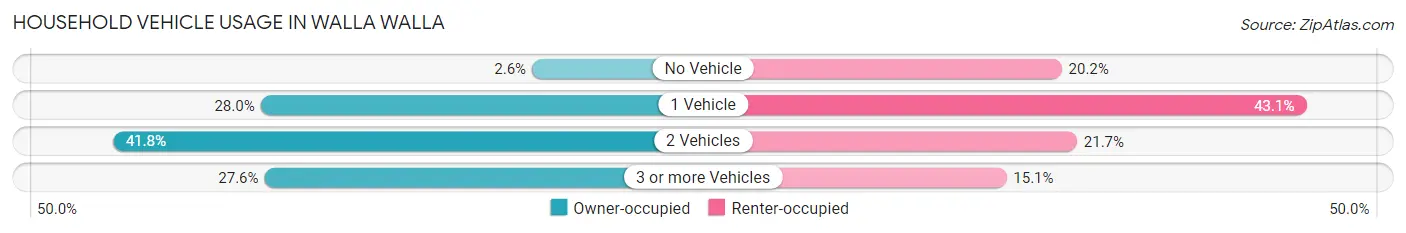
| Vehicles per Household | Owner-occupied | Renter-occupied |
| No Vehicle | 205 (2.6%) | 1,030 (20.2%) |
| 1 Vehicle | 2,175 (28.0%) | 2,192 (43.1%) |
| 2 Vehicles | 3,247 (41.8%) | 1,102 (21.6%) |
| 3 or more Vehicles | 2,147 (27.6%) | 767 (15.1%) |
| Total | 7,774 (100.0%) | 5,091 (100.0%) |
Real Estate & Mortgages in Walla Walla
Real Estate and Mortgage Overview in Walla Walla
| Characteristic | Without Mortgage | With Mortgage |
| Housing Units | 3,604 | 4,170 |
| Median Property Value | $308,800 | $318,600 |
| Median Household Income | $61,500 | $938 |
| Monthly Housing Costs | $622 | $123 |
| Real Estate Taxes | $2,893 | $152 |
Property Value by Mortgage Status in Walla Walla
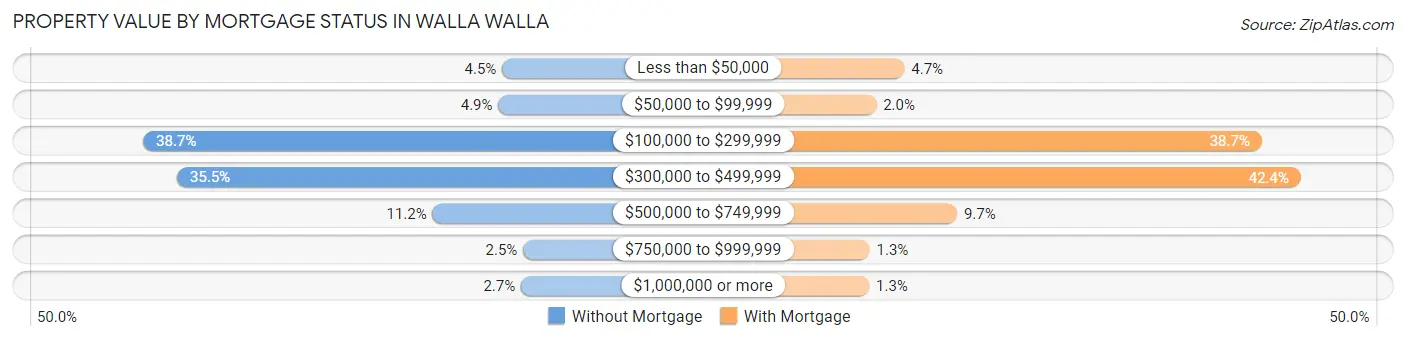
| Property Value | Without Mortgage | With Mortgage |
| Less than $50,000 | 163 (4.5%) | 194 (4.6%) |
| $50,000 to $99,999 | 176 (4.9%) | 82 (2.0%) |
| $100,000 to $299,999 | 1,395 (38.7%) | 1,613 (38.7%) |
| $300,000 to $499,999 | 1,279 (35.5%) | 1,768 (42.4%) |
| $500,000 to $749,999 | 402 (11.2%) | 403 (9.7%) |
| $750,000 to $999,999 | 91 (2.5%) | 56 (1.3%) |
| $1,000,000 or more | 98 (2.7%) | 54 (1.3%) |
| Total | 3,604 (100.0%) | 4,170 (100.0%) |
Household Income by Mortgage Status in Walla Walla
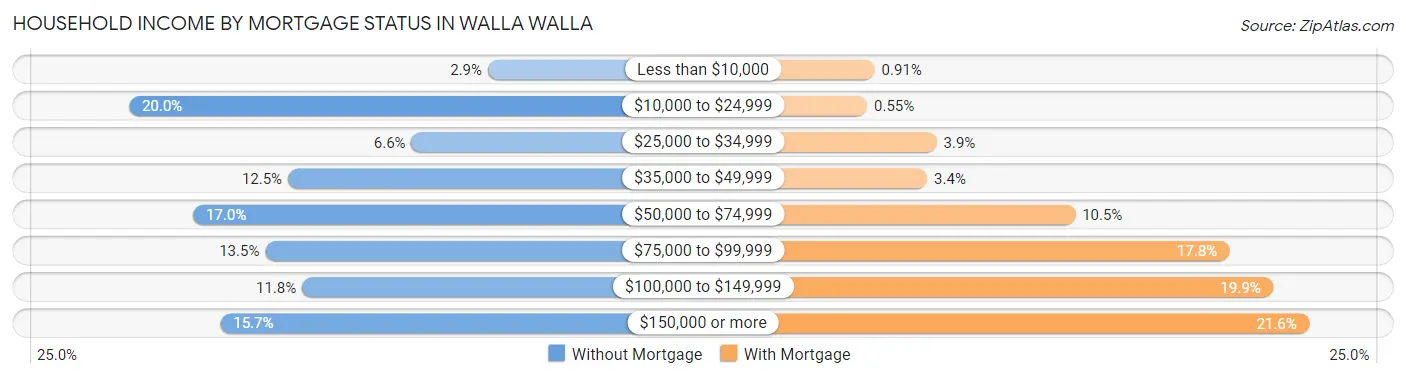
| Household Income | Without Mortgage | With Mortgage |
| Less than $10,000 | 106 (2.9%) | 38 (0.9%) |
| $10,000 to $24,999 | 722 (20.0%) | 23 (0.5%) |
| $25,000 to $34,999 | 237 (6.6%) | 161 (3.9%) |
| $35,000 to $49,999 | 449 (12.5%) | 142 (3.4%) |
| $50,000 to $74,999 | 612 (17.0%) | 436 (10.5%) |
| $75,000 to $99,999 | 488 (13.5%) | 742 (17.8%) |
| $100,000 to $149,999 | 425 (11.8%) | 828 (19.9%) |
| $150,000 or more | 565 (15.7%) | 900 (21.6%) |
| Total | 3,604 (100.0%) | 4,170 (100.0%) |
Property Value to Household Income Ratio in Walla Walla
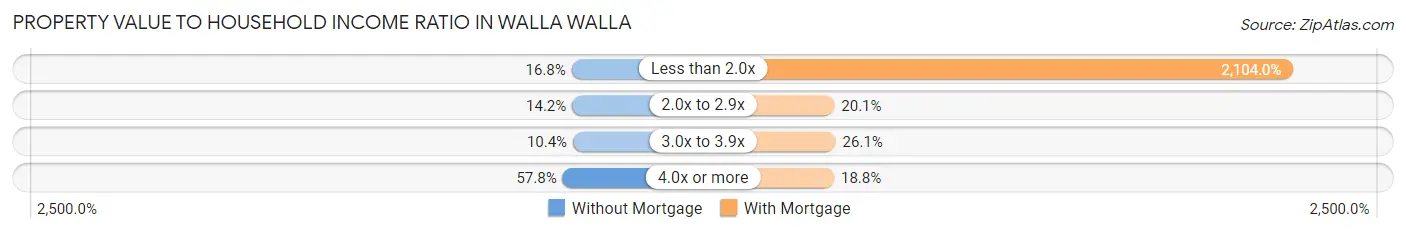
| Value-to-Income Ratio | Without Mortgage | With Mortgage |
| Less than 2.0x | 605 (16.8%) | 87,738 (2,104.0%) |
| 2.0x to 2.9x | 511 (14.2%) | 839 (20.1%) |
| 3.0x to 3.9x | 373 (10.3%) | 1,089 (26.1%) |
| 4.0x or more | 2,083 (57.8%) | 782 (18.8%) |
| Total | 3,604 (100.0%) | 4,170 (100.0%) |
Real Estate Taxes by Mortgage Status in Walla Walla
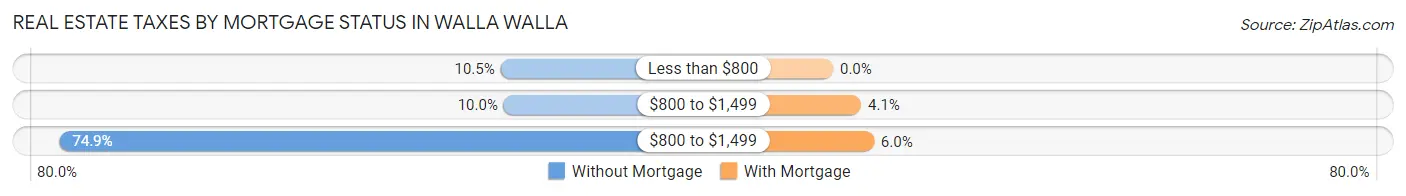
| Property Taxes | Without Mortgage | With Mortgage |
| Less than $800 | 377 (10.5%) | 0 (0.0%) |
| $800 to $1,499 | 360 (10.0%) | 171 (4.1%) |
| $800 to $1,499 | 2,700 (74.9%) | 249 (6.0%) |
| Total | 3,604 (100.0%) | 4,170 (100.0%) |
Health & Disability in Walla Walla
Health Insurance Coverage by Age in Walla Walla
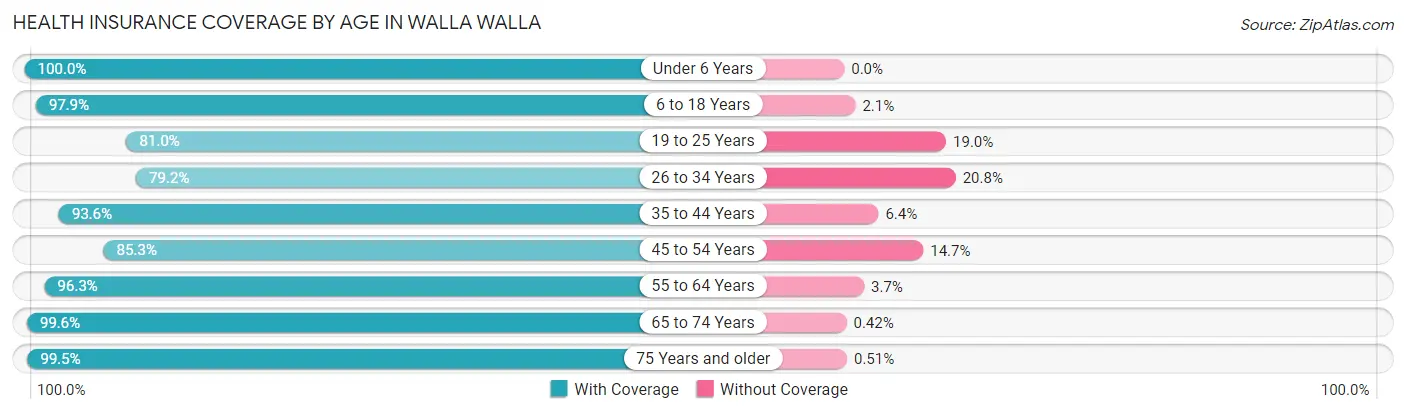
| Age Bracket | With Coverage | Without Coverage |
| Under 6 Years | 1,457 (100.0%) | 0 (0.0%) |
| 6 to 18 Years | 5,844 (97.9%) | 125 (2.1%) |
| 19 to 25 Years | 3,271 (81.0%) | 767 (19.0%) |
| 26 to 34 Years | 2,623 (79.2%) | 688 (20.8%) |
| 35 to 44 Years | 3,243 (93.6%) | 221 (6.4%) |
| 45 to 54 Years | 3,358 (85.3%) | 580 (14.7%) |
| 55 to 64 Years | 3,150 (96.3%) | 121 (3.7%) |
| 65 to 74 Years | 2,858 (99.6%) | 12 (0.4%) |
| 75 Years and older | 2,953 (99.5%) | 15 (0.5%) |
| Total | 28,757 (91.9%) | 2,529 (8.1%) |
Health Insurance Coverage by Citizenship Status in Walla Walla
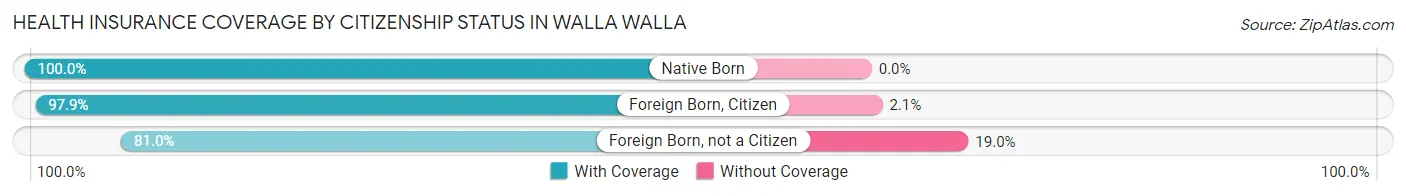
| Citizenship Status | With Coverage | Without Coverage |
| Native Born | 1,457 (100.0%) | 0 (0.0%) |
| Foreign Born, Citizen | 5,844 (97.9%) | 125 (2.1%) |
| Foreign Born, not a Citizen | 3,271 (81.0%) | 767 (19.0%) |
Health Insurance Coverage by Household Income in Walla Walla
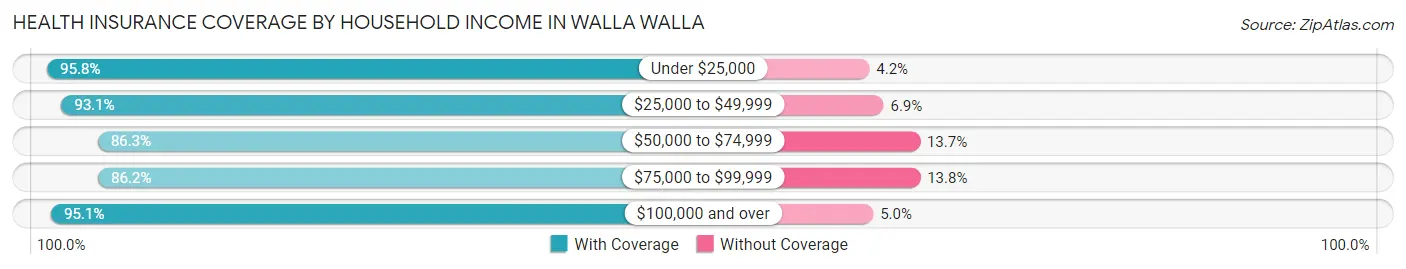
| Household Income | With Coverage | Without Coverage |
| Under $25,000 | 3,898 (95.8%) | 172 (4.2%) |
| $25,000 to $49,999 | 5,213 (93.1%) | 385 (6.9%) |
| $50,000 to $74,999 | 4,475 (86.3%) | 711 (13.7%) |
| $75,000 to $99,999 | 4,131 (86.2%) | 659 (13.8%) |
| $100,000 and over | 10,100 (95.1%) | 526 (5.0%) |
Public vs Private Health Insurance Coverage by Age in Walla Walla
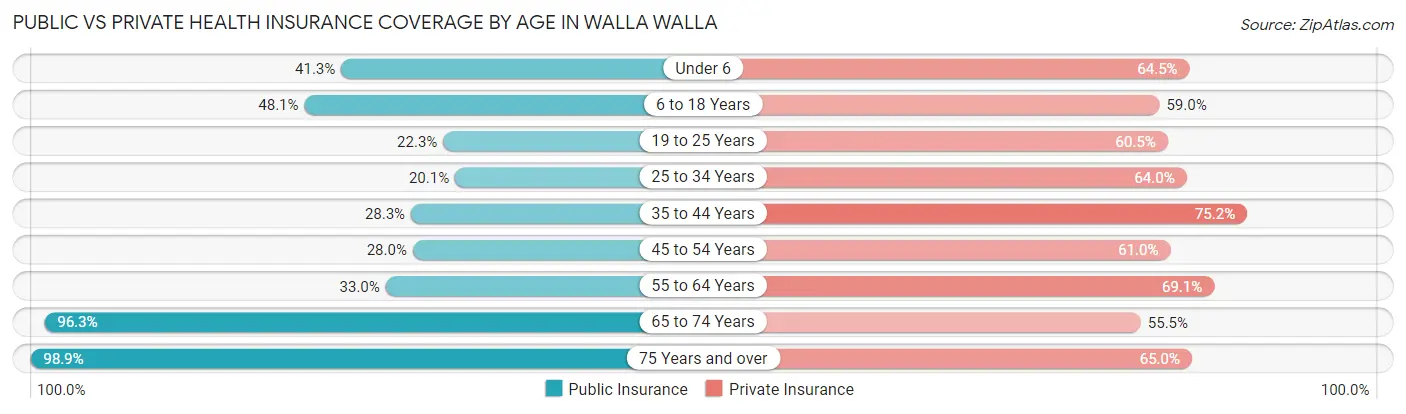
| Age Bracket | Public Insurance | Private Insurance |
| Under 6 | 601 (41.2%) | 940 (64.5%) |
| 6 to 18 Years | 2,869 (48.1%) | 3,520 (59.0%) |
| 19 to 25 Years | 901 (22.3%) | 2,442 (60.5%) |
| 25 to 34 Years | 666 (20.1%) | 2,118 (64.0%) |
| 35 to 44 Years | 980 (28.3%) | 2,605 (75.2%) |
| 45 to 54 Years | 1,101 (28.0%) | 2,401 (61.0%) |
| 55 to 64 Years | 1,079 (33.0%) | 2,260 (69.1%) |
| 65 to 74 Years | 2,765 (96.3%) | 1,593 (55.5%) |
| 75 Years and over | 2,936 (98.9%) | 1,928 (65.0%) |
| Total | 13,898 (44.4%) | 19,807 (63.3%) |
Disability Status by Sex by Age in Walla Walla
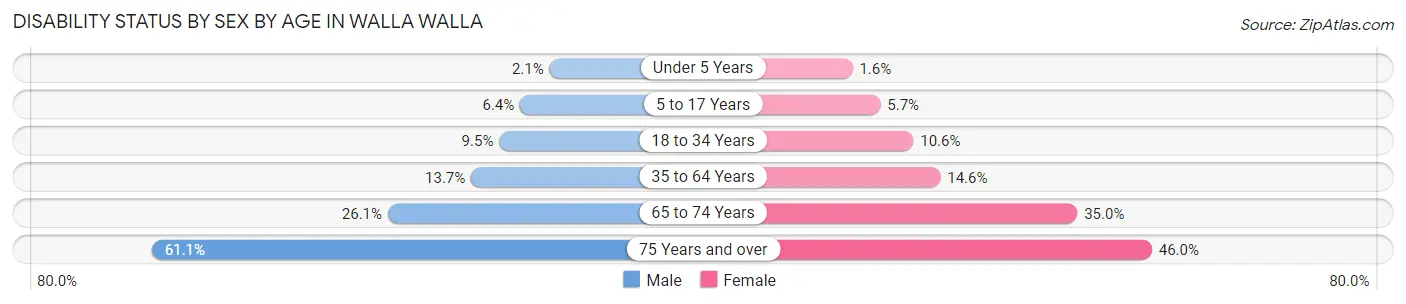
| Age Bracket | Male | Female |
| Under 5 Years | 13 (2.1%) | 11 (1.6%) |
| 5 to 17 Years | 171 (6.4%) | 139 (5.7%) |
| 18 to 34 Years | 395 (9.5%) | 447 (10.6%) |
| 35 to 64 Years | 707 (13.7%) | 806 (14.6%) |
| 65 to 74 Years | 358 (26.1%) | 523 (35.0%) |
| 75 Years and over | 676 (61.1%) | 857 (46.0%) |
Disability Class by Sex by Age in Walla Walla
Disability Class: Hearing Difficulty
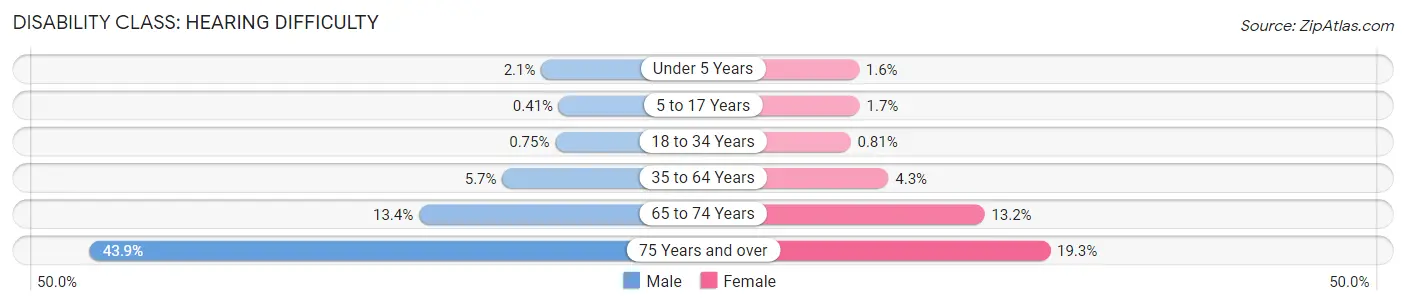
| Age Bracket | Male | Female |
| Under 5 Years | 13 (2.1%) | 11 (1.6%) |
| 5 to 17 Years | 11 (0.4%) | 40 (1.7%) |
| 18 to 34 Years | 31 (0.7%) | 34 (0.8%) |
| 35 to 64 Years | 292 (5.7%) | 238 (4.3%) |
| 65 to 74 Years | 184 (13.4%) | 198 (13.2%) |
| 75 Years and over | 486 (43.9%) | 360 (19.3%) |
Disability Class: Vision Difficulty
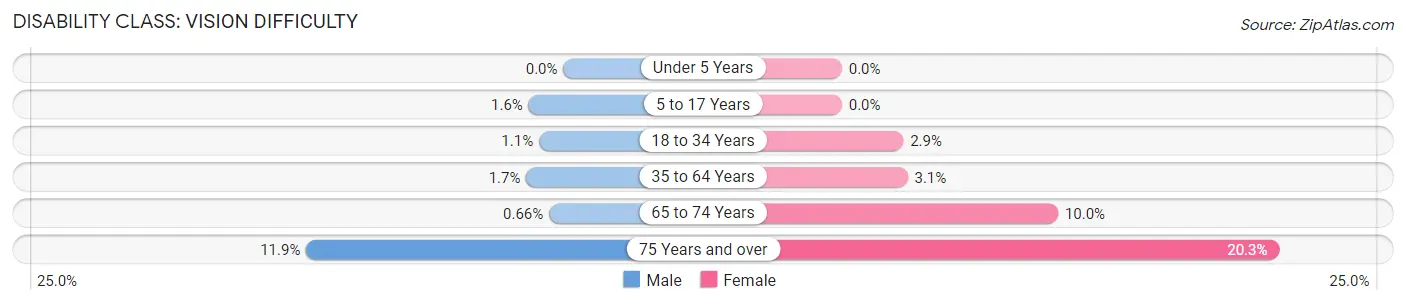
| Age Bracket | Male | Female |
| Under 5 Years | 0 (0.0%) | 0 (0.0%) |
| 5 to 17 Years | 43 (1.6%) | 0 (0.0%) |
| 18 to 34 Years | 47 (1.1%) | 120 (2.9%) |
| 35 to 64 Years | 89 (1.7%) | 168 (3.0%) |
| 65 to 74 Years | 9 (0.7%) | 150 (10.0%) |
| 75 Years and over | 132 (11.9%) | 378 (20.3%) |
Disability Class: Cognitive Difficulty
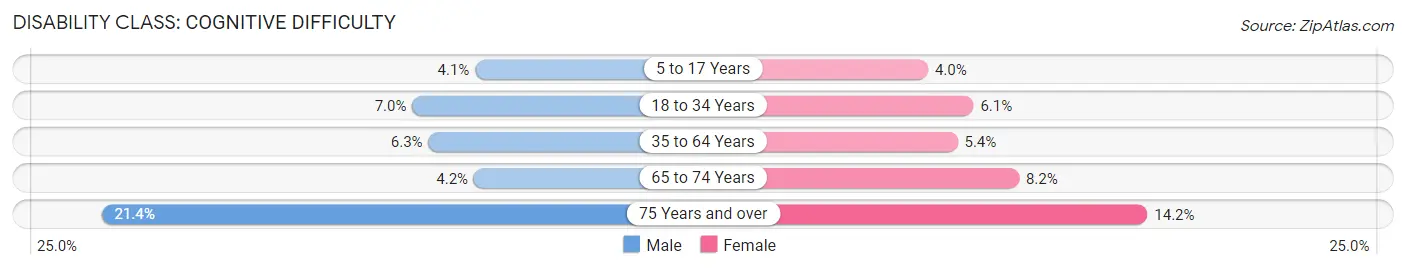
| Age Bracket | Male | Female |
| 5 to 17 Years | 109 (4.1%) | 97 (4.0%) |
| 18 to 34 Years | 291 (7.0%) | 257 (6.1%) |
| 35 to 64 Years | 323 (6.3%) | 296 (5.4%) |
| 65 to 74 Years | 57 (4.2%) | 123 (8.2%) |
| 75 Years and over | 237 (21.4%) | 264 (14.2%) |
Disability Class: Ambulatory Difficulty
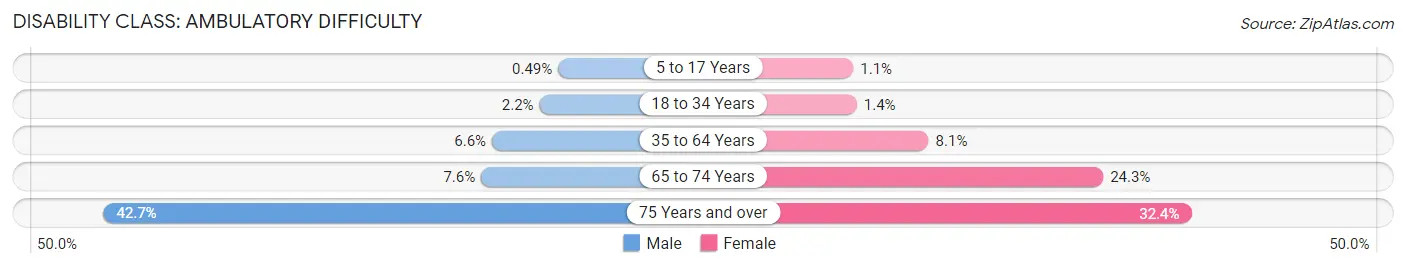
| Age Bracket | Male | Female |
| 5 to 17 Years | 13 (0.5%) | 26 (1.1%) |
| 18 to 34 Years | 92 (2.2%) | 59 (1.4%) |
| 35 to 64 Years | 342 (6.6%) | 444 (8.1%) |
| 65 to 74 Years | 105 (7.6%) | 363 (24.3%) |
| 75 Years and over | 472 (42.7%) | 604 (32.4%) |
Disability Class: Self-Care Difficulty
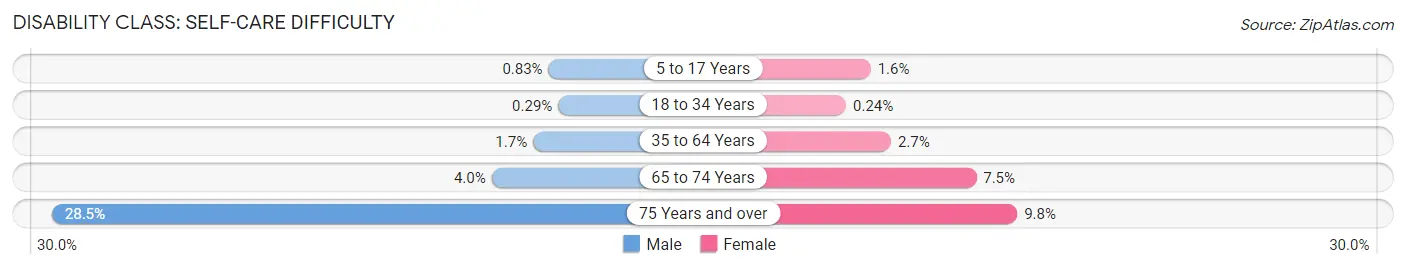
| Age Bracket | Male | Female |
| 5 to 17 Years | 22 (0.8%) | 39 (1.6%) |
| 18 to 34 Years | 12 (0.3%) | 10 (0.2%) |
| 35 to 64 Years | 87 (1.7%) | 151 (2.7%) |
| 65 to 74 Years | 55 (4.0%) | 112 (7.5%) |
| 75 Years and over | 315 (28.5%) | 182 (9.8%) |
Technology Access in Walla Walla
Computing Device Access in Walla Walla
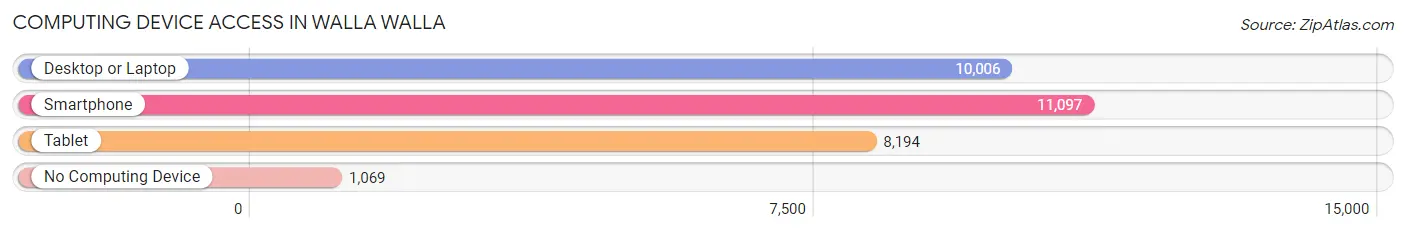
| Device Type | # Households | % Households |
| Desktop or Laptop | 10,006 | 77.8% |
| Smartphone | 11,097 | 86.3% |
| Tablet | 8,194 | 63.7% |
| No Computing Device | 1,069 | 8.3% |
| Total | 12,865 | 100.0% |
Internet Access in Walla Walla
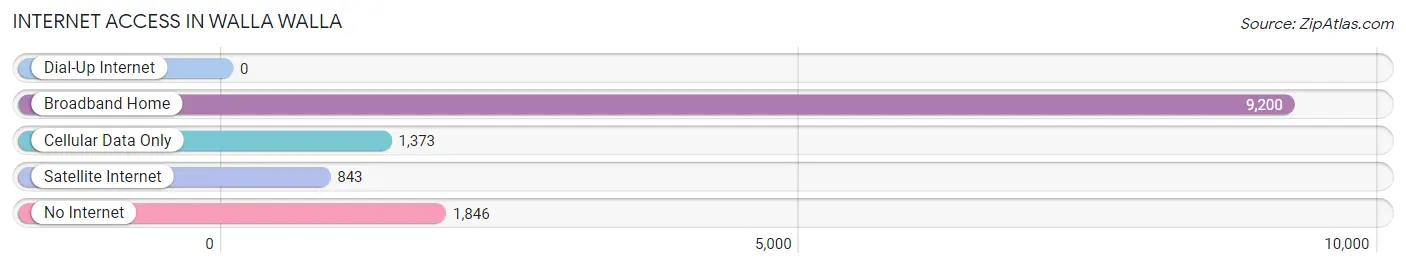
| Internet Type | # Households | % Households |
| Dial-Up Internet | 0 | 0.0% |
| Broadband Home | 9,200 | 71.5% |
| Cellular Data Only | 1,373 | 10.7% |
| Satellite Internet | 843 | 6.6% |
| No Internet | 1,846 | 14.3% |
| Total | 12,865 | 100.0% |
Walla Walla Summary
Walla Walla, Washington is a small city located in the southeastern corner of the state. It is the county seat of Walla Walla County and is the largest city in the county. The city is located on the banks of the Walla Walla River and is surrounded by the Blue Mountains to the east and the Columbia River to the west. The city has a population of approximately 32,000 people and is the home of Whitman College and Walla Walla University.
History
The area that is now Walla Walla was first inhabited by the Cayuse and Walla Walla Native American tribes. The first European settlers arrived in the area in 1836 and established a trading post. The city was officially incorporated in 1862 and was named after the Walla Walla tribe. The city quickly grew and became an important trading center for the region. During the late 19th century, the city was a major stop on the Oregon Trail and was home to many of the pioneers who traveled the trail.
In the early 20th century, Walla Walla became an important agricultural center. The city was home to many of the region’s wineries and was known for its production of wheat, apples, and other crops. The city also became an important center for the military during World War II, with several military bases located in the area.
Geography
Walla Walla is located in the southeastern corner of Washington State, near the border with Oregon. The city is situated on the banks of the Walla Walla River and is surrounded by the Blue Mountains to the east and the Columbia River to the west. The city has a total area of 8.7 square miles and has an elevation of 1,100 feet. The climate in Walla Walla is semi-arid, with hot summers and cold winters.
Economy
Walla Walla’s economy is largely based on agriculture and tourism. The city is home to many of the region’s wineries and is known for its production of wheat, apples, and other crops. The city is also home to several manufacturing companies, including a paper mill and a food processing plant. The city is also home to several military bases, which provide jobs for many of the city’s residents.
Demographics
As of the 2010 census, the population of Walla Walla was 31,731. The racial makeup of the city was 79.3% White, 0.7% African American, 0.7% Native American, 1.2% Asian, 0.2% Pacific Islander, and 17.1% from other races. The median household income in Walla Walla was $41,945, and the median family income was $50,945. The city’s population is largely made up of young adults, with the median age being 28.7 years.
Walla Walla is a small city with a rich history and a vibrant economy. The city is home to many of the region’s wineries and is known for its production of wheat, apples, and other crops. The city is also home to several military bases, which provide jobs for many of the city’s residents. The city has a diverse population and is a great place to live and work.
Common Questions
What is Per Capita Income in Walla Walla?
Per Capita income in Walla Walla is $31,801.
What is the Median Family Income in Walla Walla?
Median Family Income in Walla Walla is $82,032.
What is the Median Household income in Walla Walla?
Median Household Income in Walla Walla is $58,179.
What is Income or Wage Gap in Walla Walla?
Income or Wage Gap in Walla Walla is 34.8%.
Women in Walla Walla earn 65.2 cents for every dollar earned by a man.
What is Inequality or Gini Index in Walla Walla?
Inequality or Gini Index in Walla Walla is 0.46.
What is the Total Population of Walla Walla?
Total Population of Walla Walla is 33,842.
What is the Total Male Population of Walla Walla?
Total Male Population of Walla Walla is 17,468.
What is the Total Female Population of Walla Walla?
Total Female Population of Walla Walla is 16,374.
What is the Ratio of Males per 100 Females in Walla Walla?
There are 106.68 Males per 100 Females in Walla Walla.
What is the Ratio of Females per 100 Males in Walla Walla?
There are 93.74 Females per 100 Males in Walla Walla.
What is the Median Population Age in Walla Walla?
Median Population Age in Walla Walla is 37.2 Years.
What is the Average Family Size in Walla Walla
Average Family Size in Walla Walla is 3.1 People.
What is the Average Household Size in Walla Walla
Average Household Size in Walla Walla is 2.4 People.
How Large is the Labor Force in Walla Walla?
There are 16,057 People in the Labor Forcein in Walla Walla.
What is the Percentage of People in the Labor Force in Walla Walla?
56.8% of People are in the Labor Force in Walla Walla.
What is the Unemployment Rate in Walla Walla?
Unemployment Rate in Walla Walla is 6.1%.