Tukwila, WA Map & Demographics
Tukwila Map
Tukwila Overview
$36,258
PER CAPITA INCOME
$85,457
AVG FAMILY INCOME
$76,331
AVG HOUSEHOLD INCOME
7.5%
WAGE / INCOME GAP [ % ]
92.5¢/ $1
WAGE / INCOME GAP [ $ ]
0.39
INEQUALITY / GINI INDEX
21,569
TOTAL POPULATION
11,662
MALE POPULATION
9,907
FEMALE POPULATION
117.71
MALES / 100 FEMALES
84.95
FEMALES / 100 MALES
36.0
MEDIAN AGE
3.3
AVG FAMILY SIZE
2.6
AVG HOUSEHOLD SIZE
13,098
LABOR FORCE [ PEOPLE ]
72.7%
PERCENT IN LABOR FORCE
6.2%
UNEMPLOYMENT RATE
Income in Tukwila
Income Overview in Tukwila
Per Capita Income in Tukwila is $36,258, while median incomes of families and households are $85,457 and $76,331 respectively.
| Characteristic | Number | Measure |
| Per Capita Income | 21,569 | $36,258 |
| Median Family Income | 4,759 | $85,457 |
| Mean Family Income | 4,759 | $105,187 |
| Median Household Income | 8,098 | $76,331 |
| Mean Household Income | 8,098 | $94,749 |
| Income Deficit | 4,759 | $0 |
| Wage / Income Gap (%) | 21,569 | 7.55% |
| Wage / Income Gap ($) | 21,569 | 92.45¢ per $1 |
| Gini / Inequality Index | 21,569 | 0.39 |
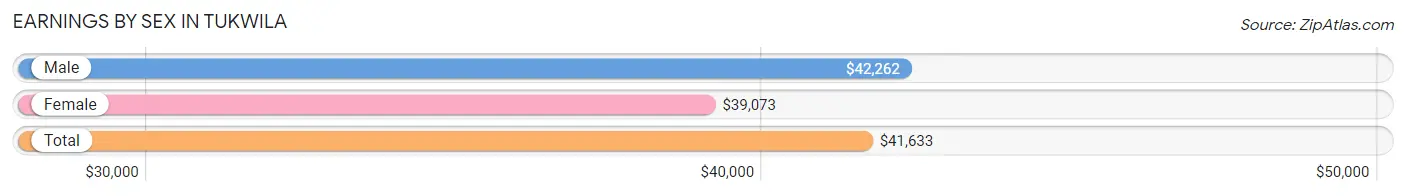
Earnings by Sex in Tukwila
Average Earnings in Tukwila are $41,633, $42,262 for men and $39,073 for women, a difference of 7.5%.
| Sex | Number | Average Earnings |
| Male | 8,019 (59.8%) | $42,262 |
| Female | 5,394 (40.2%) | $39,073 |
| Total | 13,413 (100.0%) | $41,633 |
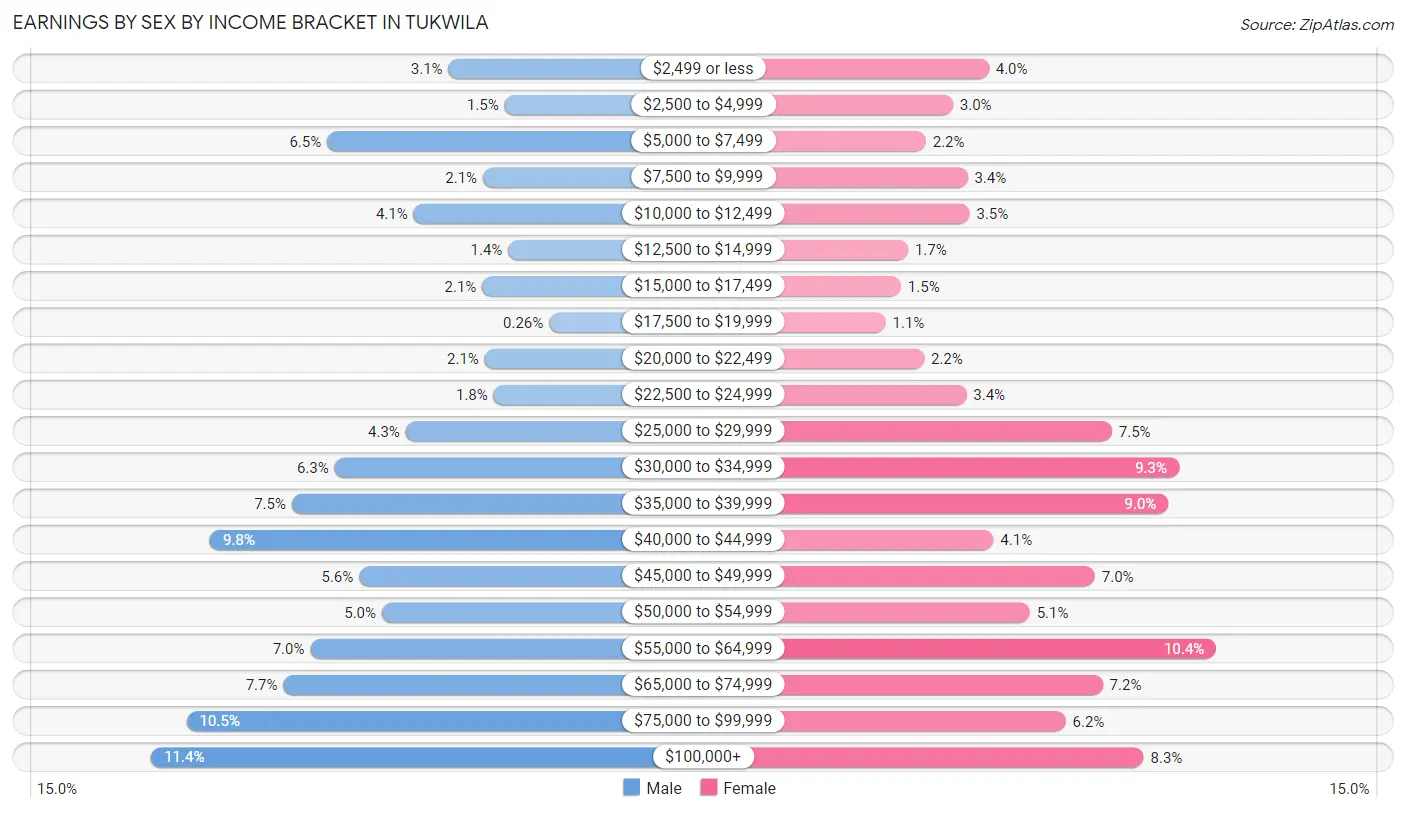
Earnings by Sex by Income Bracket in Tukwila
The most common earnings brackets in Tukwila are $100,000+ for men (917 | 11.4%) and $55,000 to $64,999 for women (560 | 10.4%).
| Income | Male | Female |
| $2,499 or less | 248 (3.1%) | 215 (4.0%) |
| $2,500 to $4,999 | 121 (1.5%) | 161 (3.0%) |
| $5,000 to $7,499 | 521 (6.5%) | 120 (2.2%) |
| $7,500 to $9,999 | 170 (2.1%) | 183 (3.4%) |
| $10,000 to $12,499 | 326 (4.1%) | 186 (3.5%) |
| $12,500 to $14,999 | 113 (1.4%) | 93 (1.7%) |
| $15,000 to $17,499 | 172 (2.1%) | 82 (1.5%) |
| $17,500 to $19,999 | 21 (0.3%) | 59 (1.1%) |
| $20,000 to $22,499 | 166 (2.1%) | 117 (2.2%) |
| $22,500 to $24,999 | 146 (1.8%) | 181 (3.4%) |
| $25,000 to $29,999 | 344 (4.3%) | 402 (7.4%) |
| $30,000 to $34,999 | 504 (6.3%) | 503 (9.3%) |
| $35,000 to $39,999 | 601 (7.5%) | 487 (9.0%) |
| $40,000 to $44,999 | 785 (9.8%) | 222 (4.1%) |
| $45,000 to $49,999 | 449 (5.6%) | 376 (7.0%) |
| $50,000 to $54,999 | 398 (5.0%) | 277 (5.1%) |
| $55,000 to $64,999 | 559 (7.0%) | 560 (10.4%) |
| $65,000 to $74,999 | 620 (7.7%) | 388 (7.2%) |
| $75,000 to $99,999 | 838 (10.4%) | 332 (6.1%) |
| $100,000+ | 917 (11.4%) | 450 (8.3%) |
| Total | 8,019 (100.0%) | 5,394 (100.0%) |
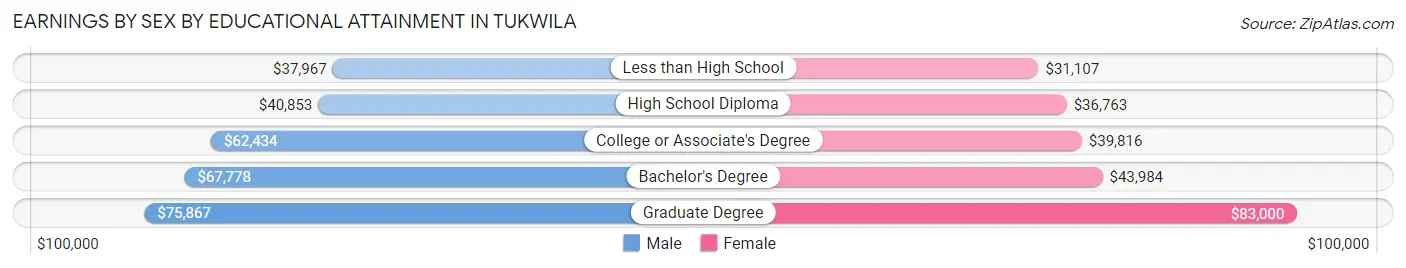
Earnings by Sex by Educational Attainment in Tukwila
Average earnings in Tukwila are $46,613 for men and $39,092 for women, a difference of 16.1%. Men with an educational attainment of graduate degree enjoy the highest average annual earnings of $75,867, while those with less than high school education earn the least with $37,967. Women with an educational attainment of graduate degree earn the most with the average annual earnings of $83,000, while those with less than high school education have the smallest earnings of $31,107.
| Educational Attainment | Male Income | Female Income |
| Less than High School | $37,967 | $31,107 |
| High School Diploma | $40,853 | $36,763 |
| College or Associate's Degree | $62,434 | $39,816 |
| Bachelor's Degree | $67,778 | $43,984 |
| Graduate Degree | $75,867 | $83,000 |
| Total | $46,613 | $39,092 |
Family Income in Tukwila
Family Income Brackets in Tukwila
According to the Tukwila family income data, there are 1,147 families falling into the $100,000 to $149,999 income range, which is the most common income bracket and makes up 24.1% of all families. Conversely, the $10,000 to $14,999 income bracket is the least frequent group with only 48 families (1.0%) belonging to this category.
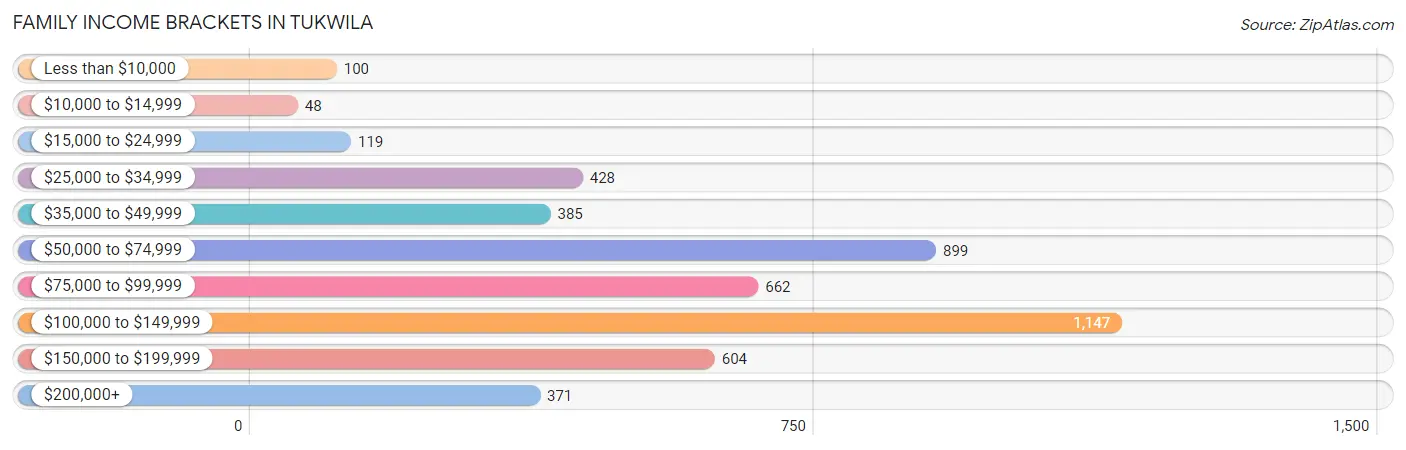
| Income Bracket | # Families | % Families |
| Less than $10,000 | 100 | 2.1% |
| $10,000 to $14,999 | 48 | 1.0% |
| $15,000 to $24,999 | 119 | 2.5% |
| $25,000 to $34,999 | 428 | 9.0% |
| $35,000 to $49,999 | 385 | 8.1% |
| $50,000 to $74,999 | 899 | 18.9% |
| $75,000 to $99,999 | 662 | 13.9% |
| $100,000 to $149,999 | 1,147 | 24.1% |
| $150,000 to $199,999 | 604 | 12.7% |
| $200,000+ | 371 | 7.8% |
Family Income by Famaliy Size in Tukwila
7+ person families (157 | 3.3%) account for the highest median family income in Tukwila with $140,038 per family, while 2-person families (2,023 | 42.5%) have the highest median income of $35,746 per family member.
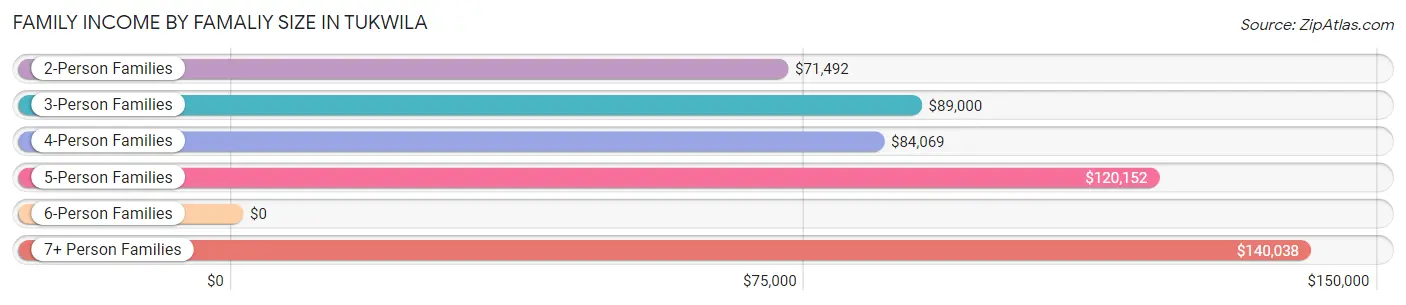
| Income Bracket | # Families | Median Income |
| 2-Person Families | 2,023 (42.5%) | $71,492 |
| 3-Person Families | 1,098 (23.1%) | $89,000 |
| 4-Person Families | 680 (14.3%) | $84,069 |
| 5-Person Families | 504 (10.6%) | $120,152 |
| 6-Person Families | 297 (6.2%) | $0 |
| 7+ Person Families | 157 (3.3%) | $140,038 |
| Total | 4,759 (100.0%) | $85,457 |
Family Income by Number of Earners in Tukwila
The median family income in Tukwila is $85,457, with families comprising 3+ earners (1,011) having the highest median family income of $139,804, while families with no earners (197) have the lowest median family income of $41,420, accounting for 21.2% and 4.1% of families, respectively.
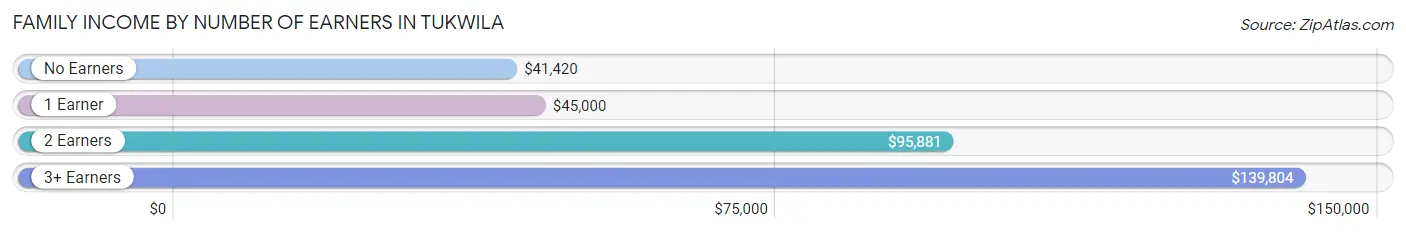
| Number of Earners | # Families | Median Income |
| No Earners | 197 (4.1%) | $41,420 |
| 1 Earner | 1,294 (27.2%) | $45,000 |
| 2 Earners | 2,257 (47.4%) | $95,881 |
| 3+ Earners | 1,011 (21.2%) | $139,804 |
| Total | 4,759 (100.0%) | $85,457 |
Household Income in Tukwila
Household Income Brackets in Tukwila
With 1,733 households falling in the category, the $50,000 to $74,999 income range is the most frequent in Tukwila, accounting for 21.4% of all households. In contrast, only 227 households (2.8%) fall into the $10,000 to $14,999 income bracket, making it the least populous group.
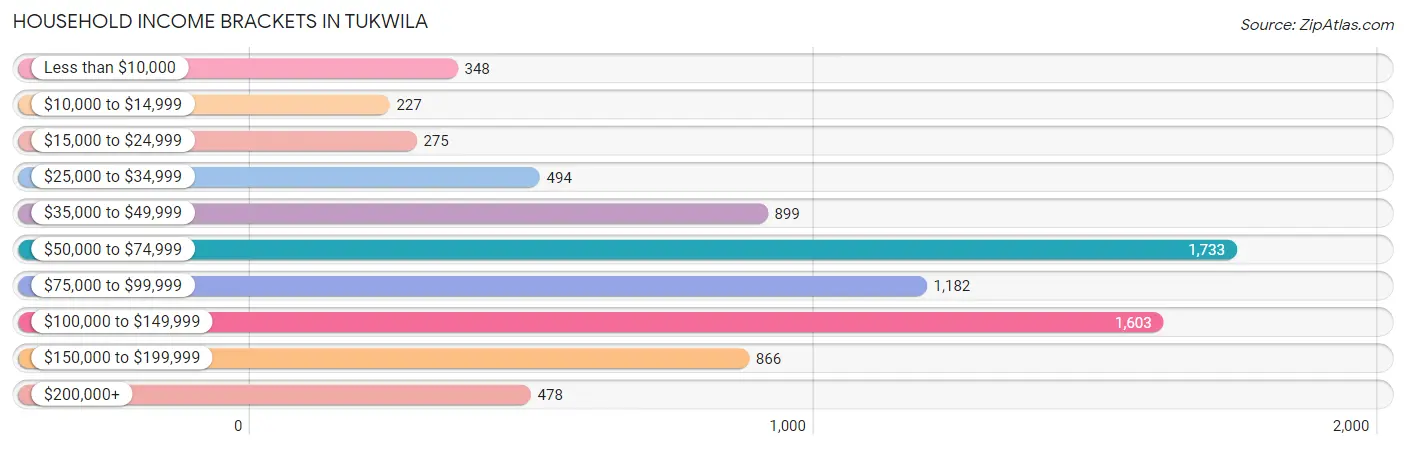
| Income Bracket | # Households | % Households |
| Less than $10,000 | 348 | 4.3% |
| $10,000 to $14,999 | 227 | 2.8% |
| $15,000 to $24,999 | 275 | 3.4% |
| $25,000 to $34,999 | 494 | 6.1% |
| $35,000 to $49,999 | 899 | 11.1% |
| $50,000 to $74,999 | 1,733 | 21.4% |
| $75,000 to $99,999 | 1,182 | 14.6% |
| $100,000 to $149,999 | 1,603 | 19.8% |
| $150,000 to $199,999 | 866 | 10.7% |
| $200,000+ | 478 | 5.9% |
Household Income by Householder Age in Tukwila
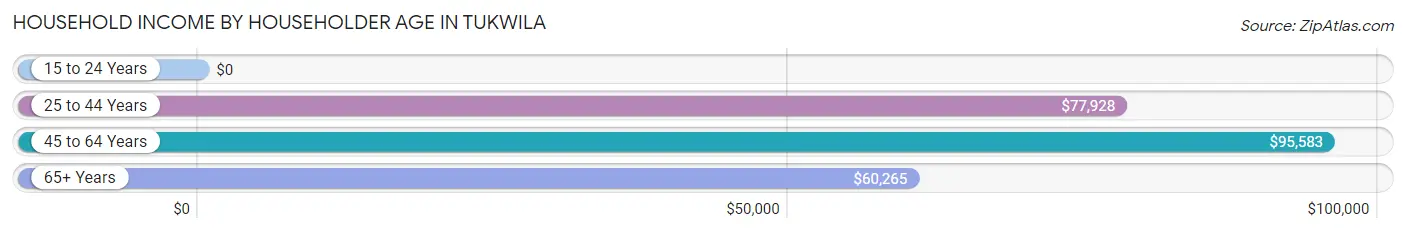
The median household income in Tukwila is $76,331, with the highest median household income of $95,583 found in the 45 to 64 years age bracket for the primary householder. A total of 2,785 households (34.4%) fall into this category. Meanwhile, the 15 to 24 years age bracket for the primary householder has the lowest median household income of $0, with 235 households (2.9%) in this group.
| Income Bracket | # Households | Median Income |
| 15 to 24 Years | 235 (2.9%) | $0 |
| 25 to 44 Years | 3,697 (45.7%) | $77,928 |
| 45 to 64 Years | 2,785 (34.4%) | $95,583 |
| 65+ Years | 1,381 (17.1%) | $60,265 |
| Total | 8,098 (100.0%) | $76,331 |
Poverty in Tukwila
Income Below Poverty by Sex and Age in Tukwila
With 11.4% poverty level for males and 15.5% for females among the residents of Tukwila, 12 to 14 year old males and 65 to 74 year old females are the most vulnerable to poverty, with 82 males (30.3%) and 226 females (31.7%) in their respective age groups living below the poverty level.
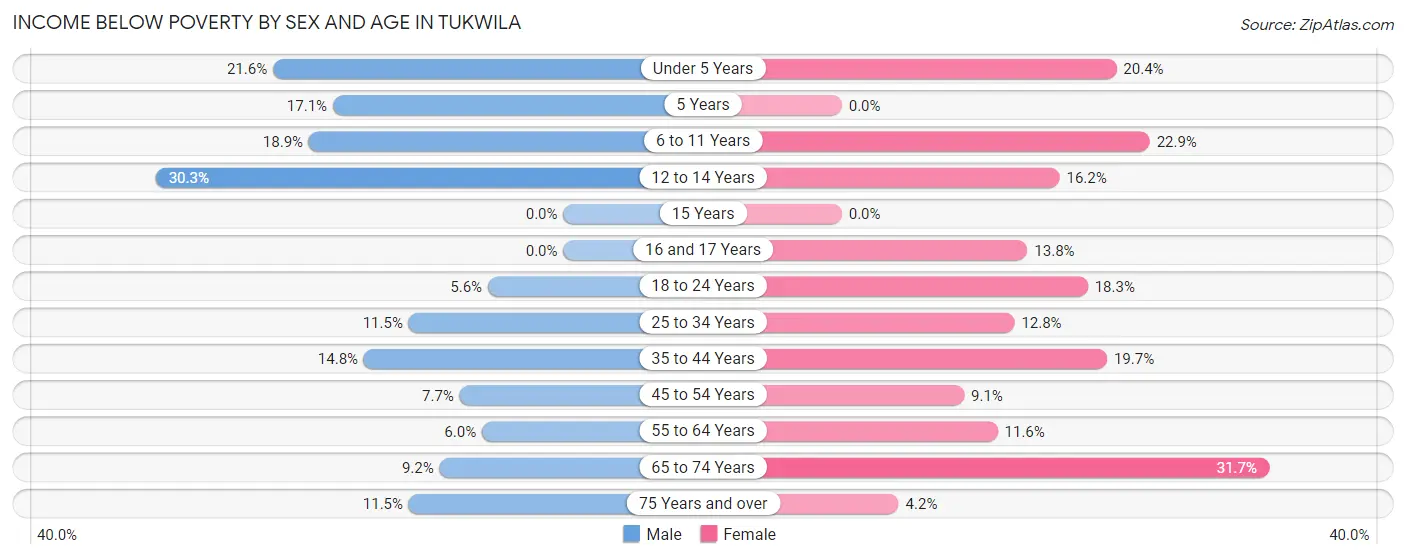
| Age Bracket | Male | Female |
| Under 5 Years | 144 (21.6%) | 63 (20.4%) |
| 5 Years | 13 (17.1%) | 0 (0.0%) |
| 6 to 11 Years | 95 (18.9%) | 174 (22.9%) |
| 12 to 14 Years | 82 (30.3%) | 81 (16.2%) |
| 15 Years | 0 (0.0%) | 0 (0.0%) |
| 16 and 17 Years | 0 (0.0%) | 27 (13.8%) |
| 18 to 24 Years | 67 (5.6%) | 136 (18.3%) |
| 25 to 34 Years | 267 (11.5%) | 281 (12.8%) |
| 35 to 44 Years | 323 (14.8%) | 251 (19.7%) |
| 45 to 54 Years | 126 (7.7%) | 113 (9.1%) |
| 55 to 64 Years | 74 (6.0%) | 140 (11.6%) |
| 65 to 74 Years | 58 (9.2%) | 226 (31.7%) |
| 75 Years and over | 64 (11.5%) | 16 (4.2%) |
| Total | 1,313 (11.4%) | 1,508 (15.5%) |
Income Above Poverty by Sex and Age in Tukwila
According to the poverty statistics in Tukwila, males aged 15 years and females aged 5 years are the age groups that are most secure financially, with 100.0% of males and 100.0% of females in these age groups living above the poverty line.
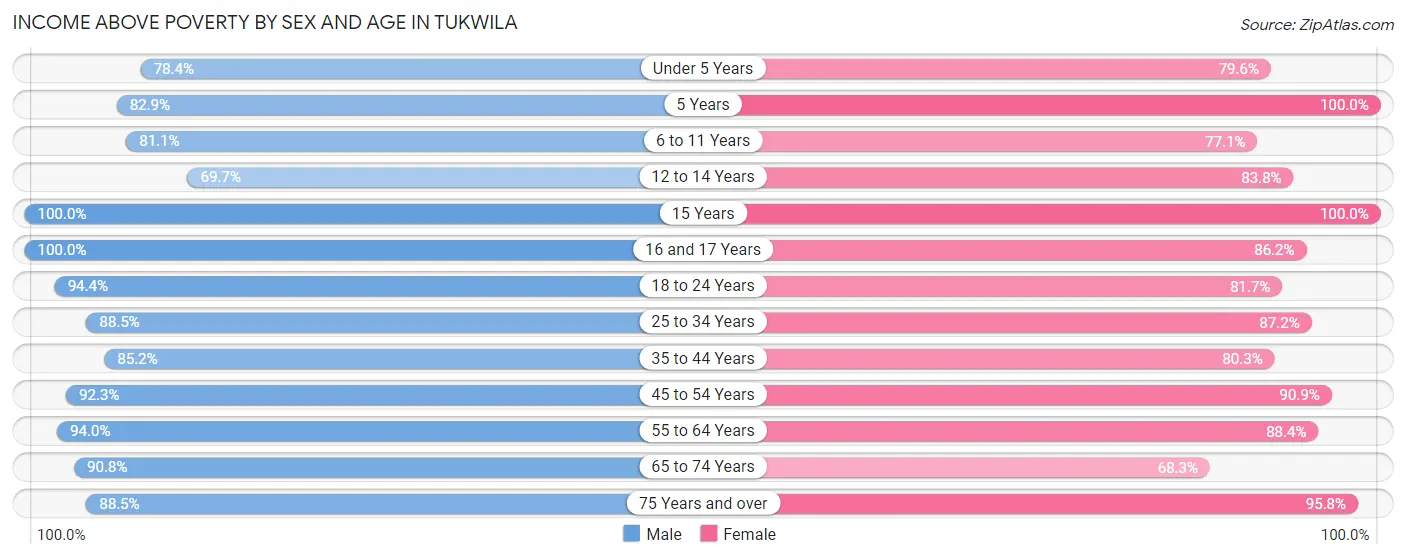
| Age Bracket | Male | Female |
| Under 5 Years | 524 (78.4%) | 246 (79.6%) |
| 5 Years | 63 (82.9%) | 128 (100.0%) |
| 6 to 11 Years | 408 (81.1%) | 587 (77.1%) |
| 12 to 14 Years | 189 (69.7%) | 420 (83.8%) |
| 15 Years | 83 (100.0%) | 56 (100.0%) |
| 16 and 17 Years | 136 (100.0%) | 169 (86.2%) |
| 18 to 24 Years | 1,130 (94.4%) | 609 (81.7%) |
| 25 to 34 Years | 2,058 (88.5%) | 1,911 (87.2%) |
| 35 to 44 Years | 1,858 (85.2%) | 1,024 (80.3%) |
| 45 to 54 Years | 1,510 (92.3%) | 1,131 (90.9%) |
| 55 to 64 Years | 1,152 (94.0%) | 1,070 (88.4%) |
| 65 to 74 Years | 573 (90.8%) | 487 (68.3%) |
| 75 Years and over | 494 (88.5%) | 363 (95.8%) |
| Total | 10,178 (88.6%) | 8,201 (84.5%) |
Income Below Poverty Among Married-Couple Families in Tukwila
The poverty statistics for married-couple families in Tukwila show that 4.6% or 147 of the total 3,217 families live below the poverty line. Families with 3 or 4 children have the highest poverty rate of 49.7%, comprising of 87 families. On the other hand, families with 5 or more children have the lowest poverty rate of 0.0%, which includes 0 families.
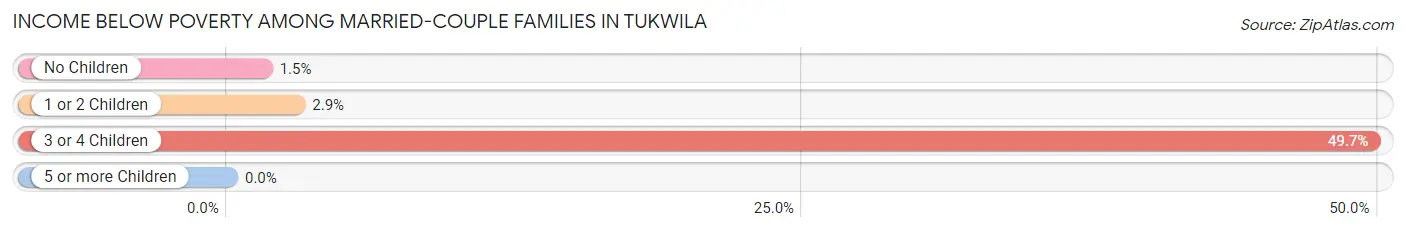
| Children | Above Poverty | Below Poverty |
| No Children | 1,958 (98.5%) | 30 (1.5%) |
| 1 or 2 Children | 994 (97.1%) | 30 (2.9%) |
| 3 or 4 Children | 88 (50.3%) | 87 (49.7%) |
| 5 or more Children | 30 (100.0%) | 0 (0.0%) |
| Total | 3,070 (95.4%) | 147 (4.6%) |
Income Below Poverty Among Single-Parent Households in Tukwila
According to the poverty data in Tukwila, 10.1% or 83 single-father households and 22.1% or 159 single-mother households are living below the poverty line. Among single-father households, those with 1 or 2 children have the highest poverty rate, with 83 households (22.0%) experiencing poverty. Likewise, among single-mother households, those with 5 or more children have the highest poverty rate, with 21 households (100.0%) falling below the poverty line.
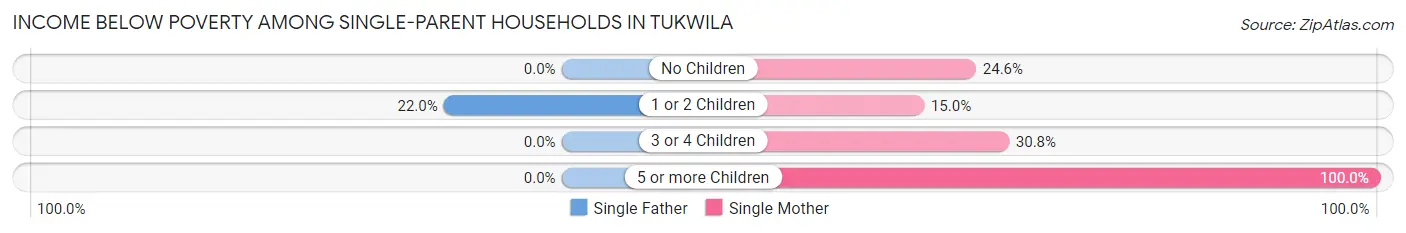
| Children | Single Father | Single Mother |
| No Children | 0 (0.0%) | 80 (24.6%) |
| 1 or 2 Children | 83 (22.0%) | 54 (15.0%) |
| 3 or 4 Children | 0 (0.0%) | 4 (30.8%) |
| 5 or more Children | 0 (0.0%) | 21 (100.0%) |
| Total | 83 (10.1%) | 159 (22.1%) |
Income Below Poverty Among Married-Couple vs Single-Parent Households in Tukwila
The poverty data for Tukwila shows that 147 of the married-couple family households (4.6%) and 242 of the single-parent households (15.7%) are living below the poverty level. Within the married-couple family households, those with 3 or 4 children have the highest poverty rate, with 87 households (49.7%) falling below the poverty line. Among the single-parent households, those with 5 or more children have the highest poverty rate, with 21 household (75.0%) living below poverty.
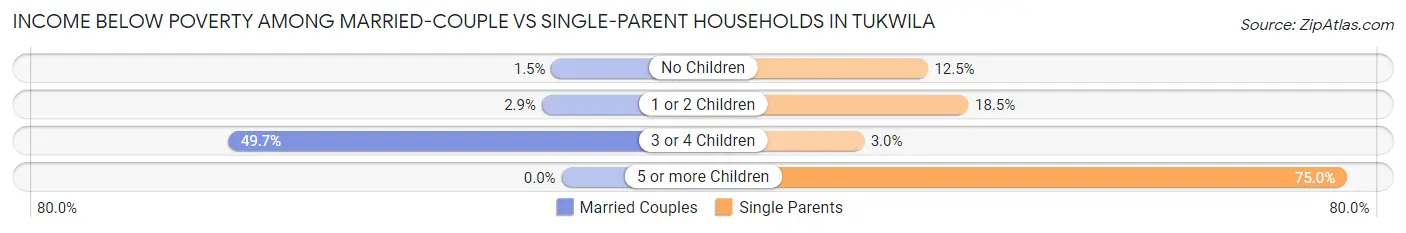
| Children | Married-Couple Families | Single-Parent Households |
| No Children | 30 (1.5%) | 80 (12.5%) |
| 1 or 2 Children | 30 (2.9%) | 137 (18.5%) |
| 3 or 4 Children | 87 (49.7%) | 4 (3.0%) |
| 5 or more Children | 0 (0.0%) | 21 (75.0%) |
| Total | 147 (4.6%) | 242 (15.7%) |
Race in Tukwila
The most populous races in Tukwila are White / Caucasian (6,862 | 31.8%), Asian (5,258 | 24.4%), and Hispanic or Latino (4,793 | 22.2%).
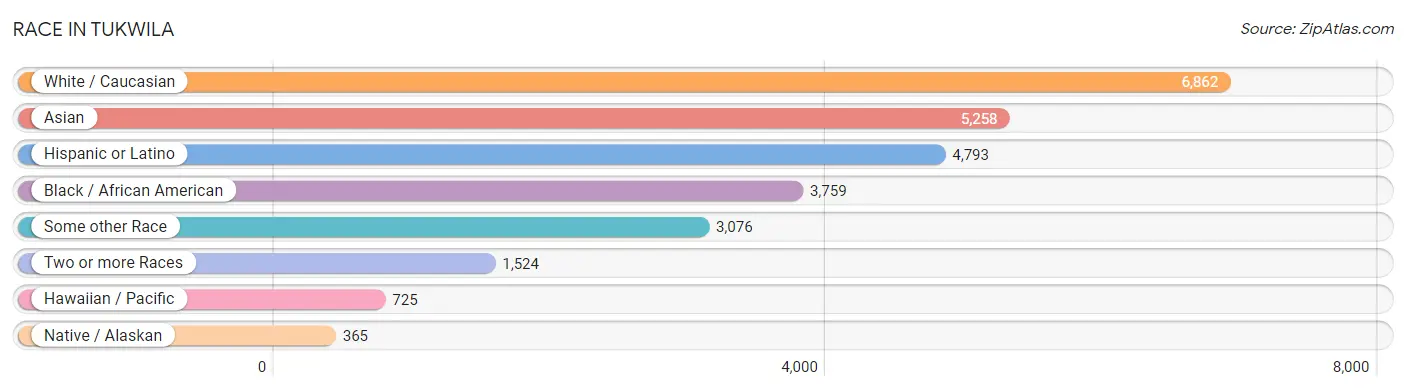
| Race | # Population | % Population |
| Asian | 5,258 | 24.4% |
| Black / African American | 3,759 | 17.4% |
| Hawaiian / Pacific | 725 | 3.4% |
| Hispanic or Latino | 4,793 | 22.2% |
| Native / Alaskan | 365 | 1.7% |
| White / Caucasian | 6,862 | 31.8% |
| Two or more Races | 1,524 | 7.1% |
| Some other Race | 3,076 | 14.3% |
| Total | 21,569 | 100.0% |
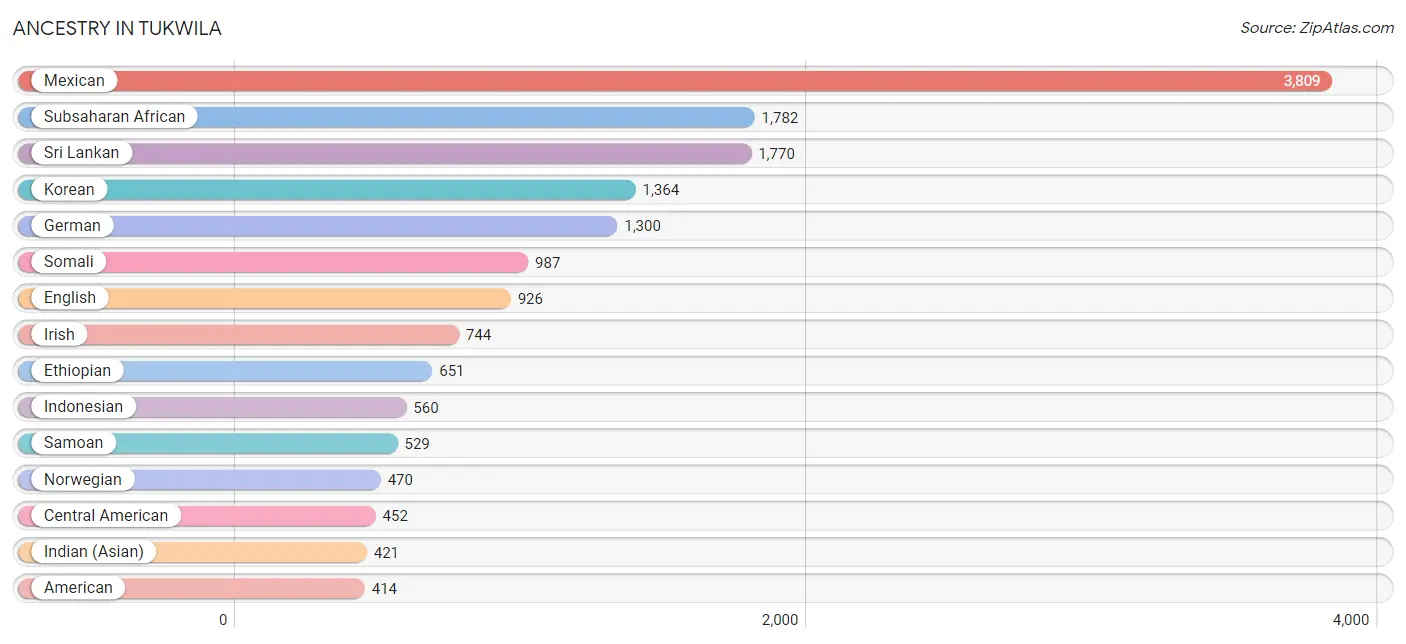
Ancestry in Tukwila
The most populous ancestries reported in Tukwila are Mexican (3,809 | 17.7%), Subsaharan African (1,782 | 8.3%), Sri Lankan (1,770 | 8.2%), Korean (1,364 | 6.3%), and German (1,300 | 6.0%), together accounting for 46.5% of all Tukwila residents.
| Ancestry | # Population | % Population |
| Afghan | 114 | 0.5% |
| African | 66 | 0.3% |
| American | 414 | 1.9% |
| Arab | 165 | 0.8% |
| Austrian | 26 | 0.1% |
| Belgian | 14 | 0.1% |
| Bhutanese | 131 | 0.6% |
| British | 38 | 0.2% |
| British West Indian | 15 | 0.1% |
| Burmese | 85 | 0.4% |
| Canadian | 102 | 0.5% |
| Central American | 452 | 2.1% |
| Central American Indian | 7 | 0.0% |
| Cherokee | 6 | 0.0% |
| Chippewa | 21 | 0.1% |
| Colombian | 2 | 0.0% |
| Colville | 27 | 0.1% |
| Croatian | 41 | 0.2% |
| Cuban | 23 | 0.1% |
| Czech | 57 | 0.3% |
| Danish | 44 | 0.2% |
| Dutch | 195 | 0.9% |
| Eastern European | 48 | 0.2% |
| Ecuadorian | 56 | 0.3% |
| Egyptian | 41 | 0.2% |
| English | 926 | 4.3% |
| Ethiopian | 651 | 3.0% |
| European | 296 | 1.4% |
| Finnish | 52 | 0.2% |
| French | 304 | 1.4% |
| French American Indian | 10 | 0.1% |
| French Canadian | 43 | 0.2% |
| German | 1,300 | 6.0% |
| German Russian | 92 | 0.4% |
| Greek | 12 | 0.1% |
| Guamanian / Chamorro | 111 | 0.5% |
| Guatemalan | 36 | 0.2% |
| Honduran | 110 | 0.5% |
| Hungarian | 13 | 0.1% |
| Indian (Asian) | 421 | 1.9% |
| Indonesian | 560 | 2.6% |
| Inupiat | 7 | 0.0% |
| Iranian | 26 | 0.1% |
| Iraqi | 22 | 0.1% |
| Irish | 744 | 3.5% |
| Iroquois | 19 | 0.1% |
| Italian | 267 | 1.2% |
| Jamaican | 197 | 0.9% |
| Japanese | 310 | 1.4% |
| Kenyan | 78 | 0.4% |
| Korean | 1,364 | 6.3% |
| Malaysian | 106 | 0.5% |
| Mexican | 3,809 | 17.7% |
| Mexican American Indian | 170 | 0.8% |
| Moroccan | 102 | 0.5% |
| Native Hawaiian | 23 | 0.1% |
| Nepalese | 27 | 0.1% |
| Northern European | 36 | 0.2% |
| Norwegian | 470 | 2.2% |
| Pakistani | 106 | 0.5% |
| Peruvian | 132 | 0.6% |
| Polish | 102 | 0.5% |
| Puerto Rican | 181 | 0.8% |
| Russian | 31 | 0.1% |
| Salvadoran | 306 | 1.4% |
| Samoan | 529 | 2.5% |
| Scandinavian | 120 | 0.6% |
| Scotch-Irish | 66 | 0.3% |
| Scottish | 362 | 1.7% |
| Seminole | 14 | 0.1% |
| Serbian | 15 | 0.1% |
| Sioux | 31 | 0.1% |
| Slovak | 8 | 0.0% |
| Somali | 987 | 4.6% |
| South American | 190 | 0.9% |
| South American Indian | 10 | 0.1% |
| Spaniard | 4 | 0.0% |
| Spanish | 65 | 0.3% |
| Sri Lankan | 1,770 | 8.2% |
| Subsaharan African | 1,782 | 8.3% |
| Swedish | 322 | 1.5% |
| Swiss | 71 | 0.3% |
| Thai | 241 | 1.1% |
| Tlingit-Haida | 40 | 0.2% |
| Ukrainian | 44 | 0.2% |
| Welsh | 100 | 0.5% |
| Yakama | 129 | 0.6% |
| Yugoslavian | 357 | 1.7% |
| Yup'ik | 5 | 0.0% | View All 89 Rows |
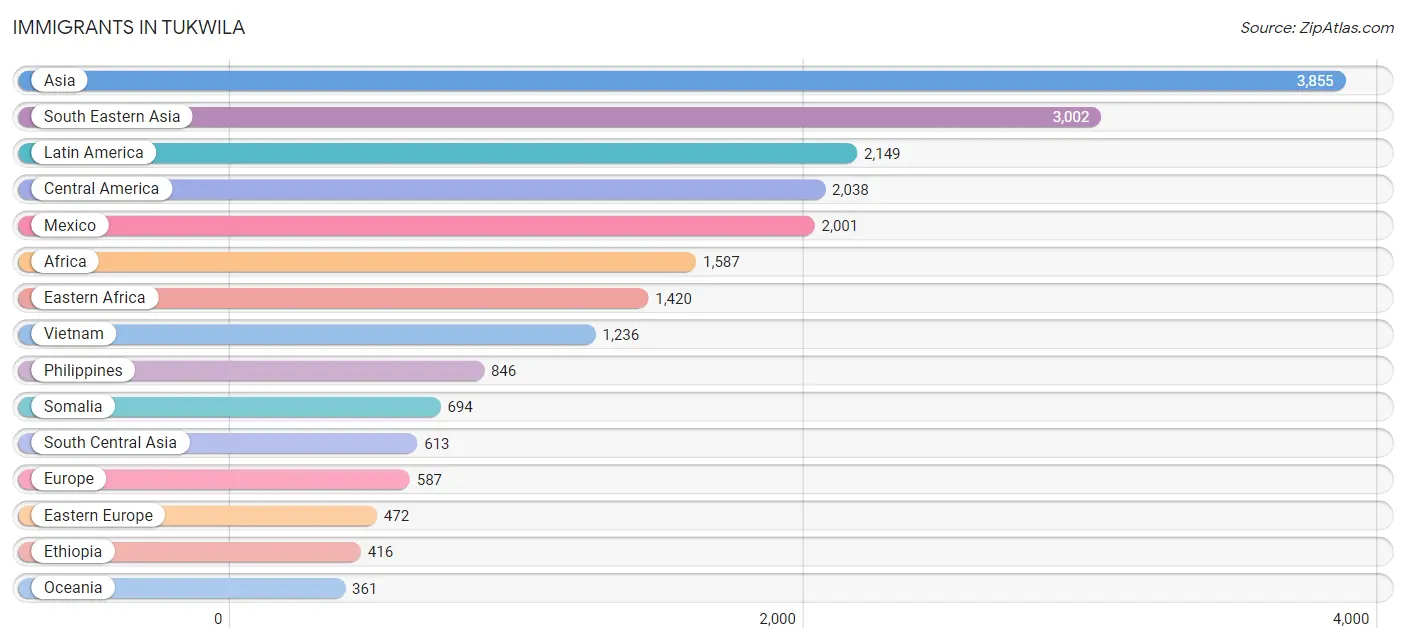
Immigrants in Tukwila
The most numerous immigrant groups reported in Tukwila came from Asia (3,855 | 17.9%), South Eastern Asia (3,002 | 13.9%), Latin America (2,149 | 10.0%), Central America (2,038 | 9.5%), and Mexico (2,001 | 9.3%), together accounting for 60.5% of all Tukwila residents.
| Immigration Origin | # Population | % Population |
| Afghanistan | 189 | 0.9% |
| Africa | 1,587 | 7.4% |
| Asia | 3,855 | 17.9% |
| Belarus | 61 | 0.3% |
| Bosnia and Herzegovina | 357 | 1.7% |
| Cambodia | 222 | 1.0% |
| Canada | 92 | 0.4% |
| Caribbean | 38 | 0.2% |
| Central America | 2,038 | 9.5% |
| China | 156 | 0.7% |
| Colombia | 2 | 0.0% |
| Denmark | 6 | 0.0% |
| Eastern Africa | 1,420 | 6.6% |
| Eastern Asia | 195 | 0.9% |
| Eastern Europe | 472 | 2.2% |
| El Salvador | 24 | 0.1% |
| Eritrea | 142 | 0.7% |
| Ethiopia | 416 | 1.9% |
| Europe | 587 | 2.7% |
| Fiji | 11 | 0.1% |
| France | 24 | 0.1% |
| Germany | 3 | 0.0% |
| Guatemala | 13 | 0.1% |
| Hong Kong | 18 | 0.1% |
| India | 182 | 0.8% |
| Indonesia | 80 | 0.4% |
| Iran | 74 | 0.3% |
| Iraq | 22 | 0.1% |
| Italy | 63 | 0.3% |
| Jamaica | 27 | 0.1% |
| Japan | 21 | 0.1% |
| Kenya | 168 | 0.8% |
| Korea | 18 | 0.1% |
| Laos | 120 | 0.6% |
| Latin America | 2,149 | 10.0% |
| Mexico | 2,001 | 9.3% |
| Micronesia | 89 | 0.4% |
| Morocco | 35 | 0.2% |
| Nepal | 52 | 0.2% |
| Northern Africa | 103 | 0.5% |
| Northern Europe | 15 | 0.1% |
| Oceania | 361 | 1.7% |
| Pakistan | 7 | 0.0% |
| Peru | 71 | 0.3% |
| Philippines | 846 | 3.9% |
| Poland | 20 | 0.1% |
| Russia | 6 | 0.0% |
| Somalia | 694 | 3.2% |
| South America | 73 | 0.3% |
| South Central Asia | 613 | 2.8% |
| South Eastern Asia | 3,002 | 13.9% |
| Southern Europe | 63 | 0.3% |
| Sudan | 68 | 0.3% |
| Sweden | 4 | 0.0% |
| Switzerland | 10 | 0.1% |
| Taiwan | 8 | 0.0% |
| Thailand | 125 | 0.6% |
| Ukraine | 28 | 0.1% |
| Vietnam | 1,236 | 5.7% |
| Western Africa | 52 | 0.2% |
| Western Asia | 45 | 0.2% |
| Western Europe | 37 | 0.2% | View All 62 Rows |
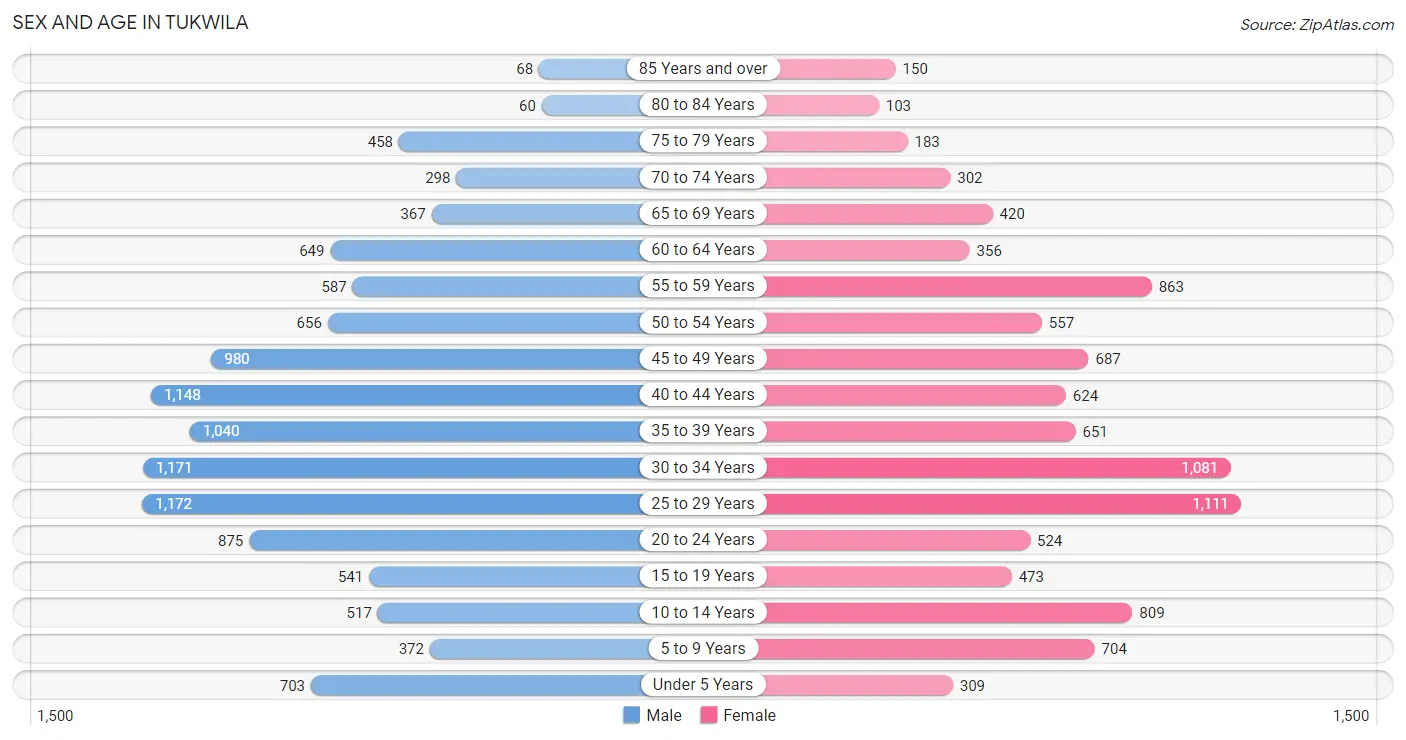
Sex and Age in Tukwila
Sex and Age in Tukwila
The most populous age groups in Tukwila are 25 to 29 Years (1,172 | 10.1%) for men and 25 to 29 Years (1,111 | 11.2%) for women.
| Age Bracket | Male | Female |
| Under 5 Years | 703 (6.0%) | 309 (3.1%) |
| 5 to 9 Years | 372 (3.2%) | 704 (7.1%) |
| 10 to 14 Years | 517 (4.4%) | 809 (8.2%) |
| 15 to 19 Years | 541 (4.6%) | 473 (4.8%) |
| 20 to 24 Years | 875 (7.5%) | 524 (5.3%) |
| 25 to 29 Years | 1,172 (10.1%) | 1,111 (11.2%) |
| 30 to 34 Years | 1,171 (10.0%) | 1,081 (10.9%) |
| 35 to 39 Years | 1,040 (8.9%) | 651 (6.6%) |
| 40 to 44 Years | 1,148 (9.8%) | 624 (6.3%) |
| 45 to 49 Years | 980 (8.4%) | 687 (6.9%) |
| 50 to 54 Years | 656 (5.6%) | 557 (5.6%) |
| 55 to 59 Years | 587 (5.0%) | 863 (8.7%) |
| 60 to 64 Years | 649 (5.6%) | 356 (3.6%) |
| 65 to 69 Years | 367 (3.2%) | 420 (4.2%) |
| 70 to 74 Years | 298 (2.6%) | 302 (3.0%) |
| 75 to 79 Years | 458 (3.9%) | 183 (1.8%) |
| 80 to 84 Years | 60 (0.5%) | 103 (1.0%) |
| 85 Years and over | 68 (0.6%) | 150 (1.5%) |
| Total | 11,662 (100.0%) | 9,907 (100.0%) |
Families and Households in Tukwila
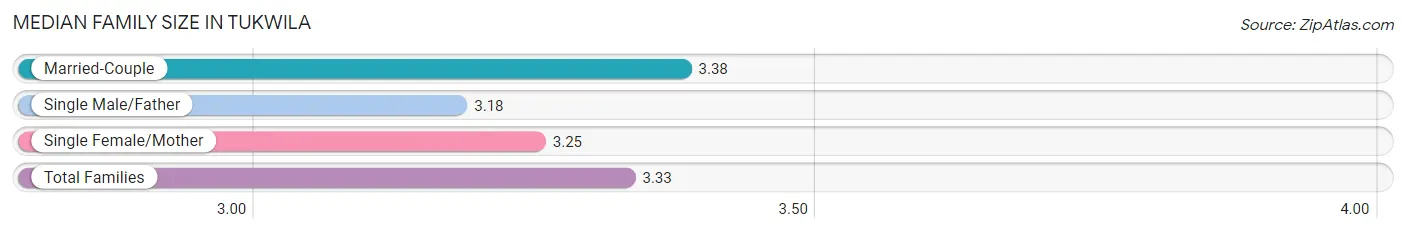
Median Family Size in Tukwila
The median family size in Tukwila is 3.33 persons per family, with married-couple families (3,217 | 67.6%) accounting for the largest median family size of 3.38 persons per family. On the other hand, single male/father families (822 | 17.3%) represent the smallest median family size with 3.18 persons per family.
| Family Type | # Families | Family Size |
| Married-Couple | 3,217 (67.6%) | 3.38 |
| Single Male/Father | 822 (17.3%) | 3.18 |
| Single Female/Mother | 720 (15.1%) | 3.25 |
| Total Families | 4,759 (100.0%) | 3.33 |
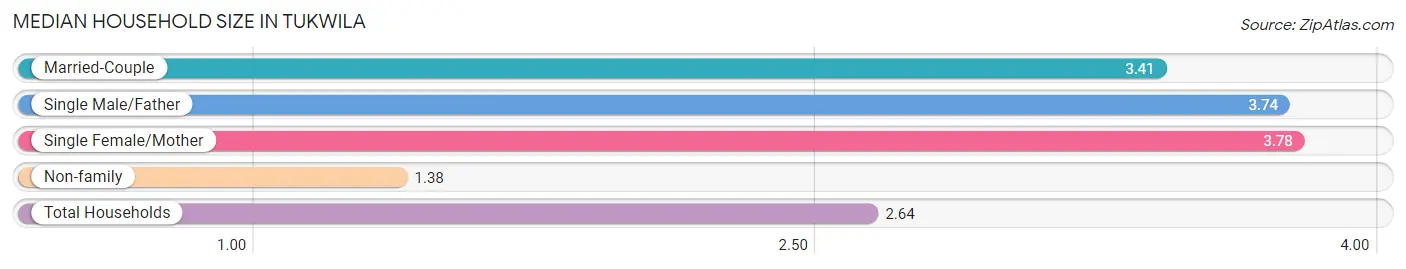
Median Household Size in Tukwila
The median household size in Tukwila is 2.64 persons per household, with single female/mother households (720 | 8.9%) accounting for the largest median household size of 3.78 persons per household. non-family households (3,339 | 41.2%) represent the smallest median household size with 1.38 persons per household.
| Household Type | # Households | Household Size |
| Married-Couple | 3,217 (39.7%) | 3.41 |
| Single Male/Father | 822 (10.2%) | 3.74 |
| Single Female/Mother | 720 (8.9%) | 3.78 |
| Non-family | 3,339 (41.2%) | 1.38 |
| Total Households | 8,098 (100.0%) | 2.64 |
Household Size by Marriage Status in Tukwila
Out of a total of 8,098 households in Tukwila, 4,759 (58.8%) are family households, while 3,339 (41.2%) are nonfamily households. The most numerous type of family households are 2-person households, comprising 1,786, and the most common type of nonfamily households are 1-person households, comprising 2,421.
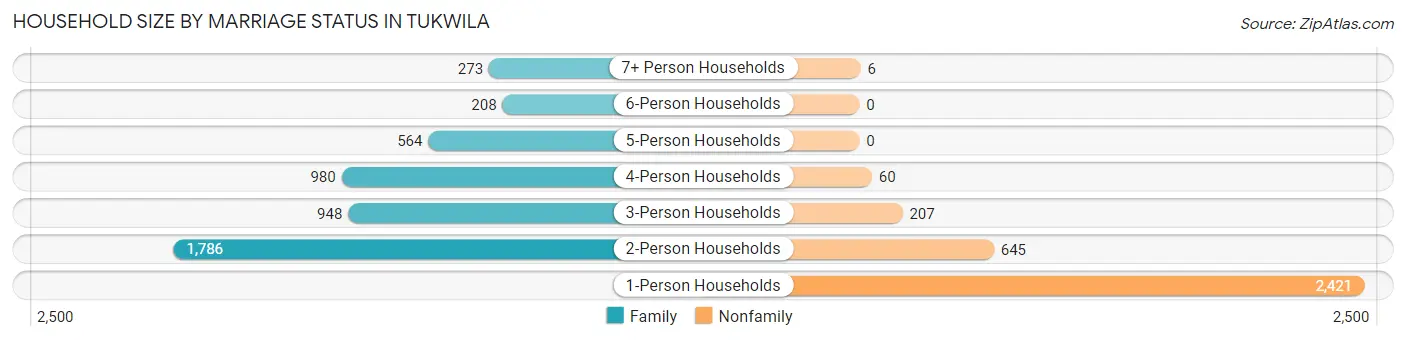
| Household Size | Family Households | Nonfamily Households |
| 1-Person Households | - | 2,421 (29.9%) |
| 2-Person Households | 1,786 (22.1%) | 645 (8.0%) |
| 3-Person Households | 948 (11.7%) | 207 (2.6%) |
| 4-Person Households | 980 (12.1%) | 60 (0.7%) |
| 5-Person Households | 564 (7.0%) | 0 (0.0%) |
| 6-Person Households | 208 (2.6%) | 0 (0.0%) |
| 7+ Person Households | 273 (3.4%) | 6 (0.1%) |
| Total | 4,759 (58.8%) | 3,339 (41.2%) |
Female Fertility in Tukwila
Fertility by Age in Tukwila
Average fertility rate in Tukwila is 46.0 births per 1,000 women. Women in the age bracket of 20 to 34 years have the highest fertility rate with 70.0 births per 1,000 women. Women in the age bracket of 20 to 34 years acount for 78.3% of all women with births.
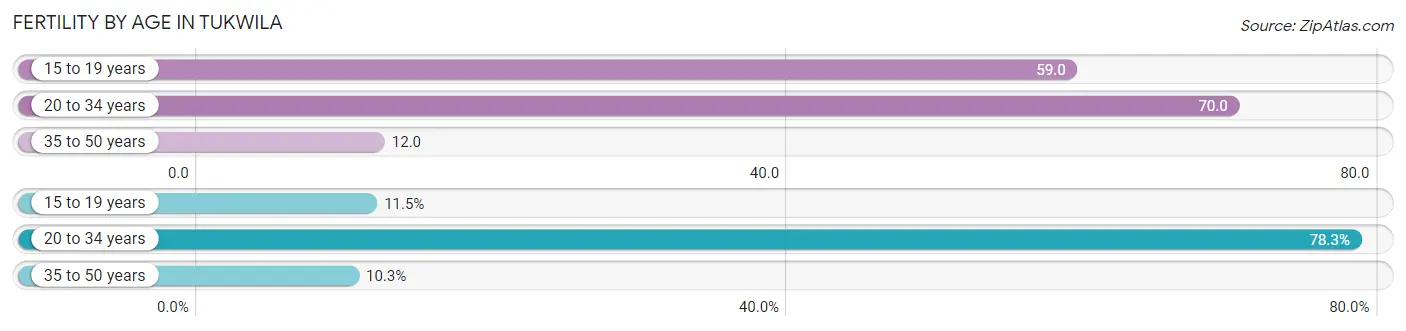
| Age Bracket | Women with Births | Births / 1,000 Women |
| 15 to 19 years | 28 (11.5%) | 59.0 |
| 20 to 34 years | 191 (78.3%) | 70.0 |
| 35 to 50 years | 25 (10.2%) | 12.0 |
| Total | 244 (100.0%) | 46.0 |
Fertility by Age by Marriage Status in Tukwila
59.8% of women with births (244) in Tukwila are married. The highest percentage of unmarried women with births falls into 15 to 19 years age bracket with 100.0% of them unmarried at the time of birth, while the lowest percentage of unmarried women with births belong to 20 to 34 years age bracket with 31.9% of them unmarried.
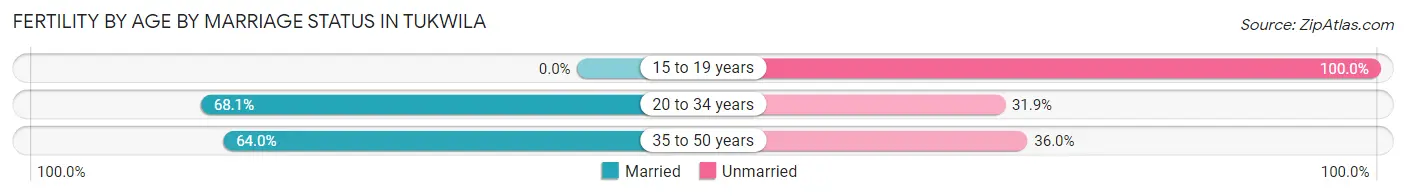
| Age Bracket | Married | Unmarried |
| 15 to 19 years | 0 (0.0%) | 28 (100.0%) |
| 20 to 34 years | 130 (68.1%) | 61 (31.9%) |
| 35 to 50 years | 16 (64.0%) | 9 (36.0%) |
| Total | 146 (59.8%) | 98 (40.2%) |
Fertility by Education in Tukwila
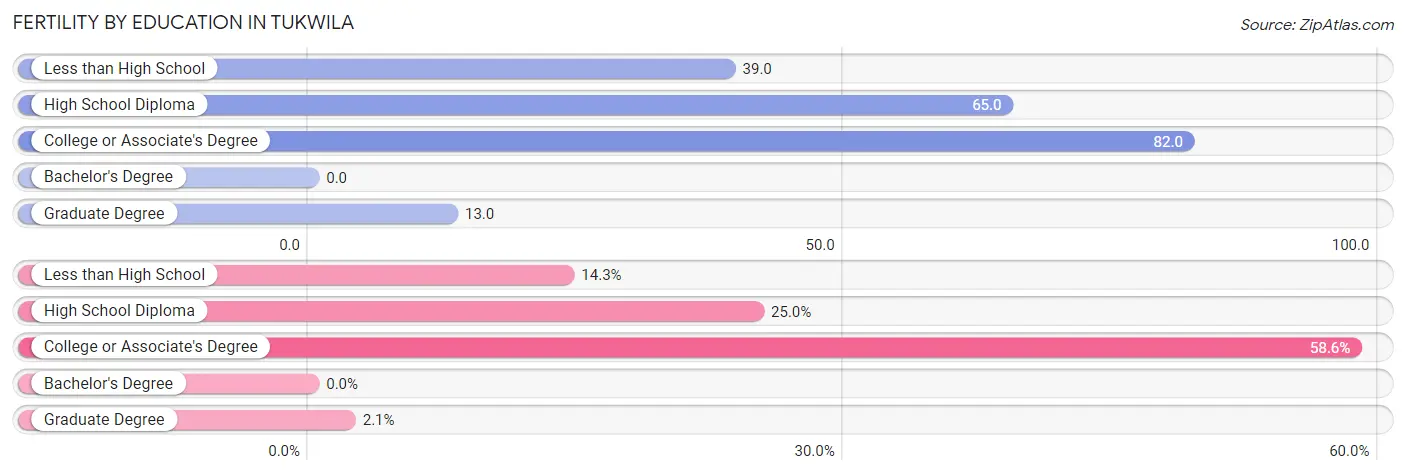
| Educational Attainment | Women with Births | Births / 1,000 Women |
| Less than High School | 35 (14.3%) | 39.0 |
| High School Diploma | 61 (25.0%) | 65.0 |
| College or Associate's Degree | 143 (58.6%) | 82.0 |
| Bachelor's Degree | 0 (0.0%) | 0.0 |
| Graduate Degree | 5 (2.1%) | 13.0 |
| Total | 244 (100.0%) | 46.0 |
Fertility by Education by Marriage Status in Tukwila
40.2% of women with births in Tukwila are unmarried. Women with the educational attainment of graduate degree are most likely to be married with 100.0% of them married at childbirth, while women with the educational attainment of less than high school are least likely to be married with 100.0% of them unmarried at childbirth.
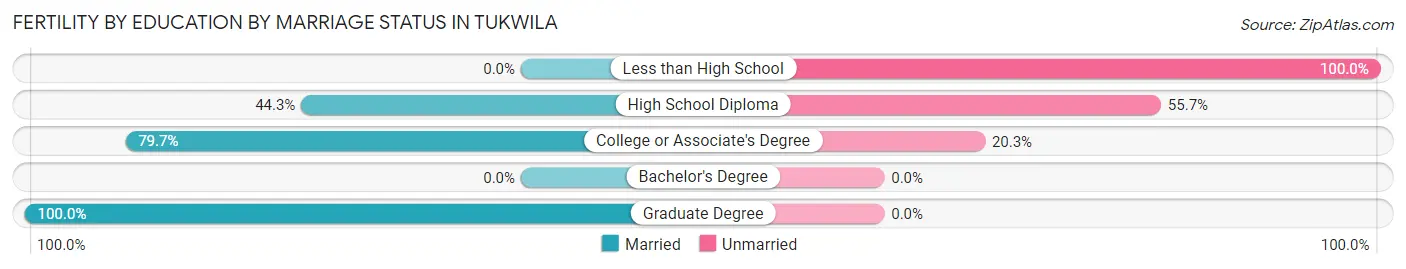
| Educational Attainment | Married | Unmarried |
| Less than High School | 0 (0.0%) | 35 (100.0%) |
| High School Diploma | 27 (44.3%) | 34 (55.7%) |
| College or Associate's Degree | 114 (79.7%) | 29 (20.3%) |
| Bachelor's Degree | 0 (0.0%) | 0 (0.0%) |
| Graduate Degree | 5 (100.0%) | 0 (0.0%) |
| Total | 146 (59.8%) | 98 (40.2%) |
Employment Characteristics in Tukwila
Employment by Class of Employer in Tukwila
Among the 12,014 employed individuals in Tukwila, private company employees (8,829 | 73.5%), not-for-profit organizations (1,020 | 8.5%), and self-employed (not incorporated) (622 | 5.2%) make up the most common classes of employment.
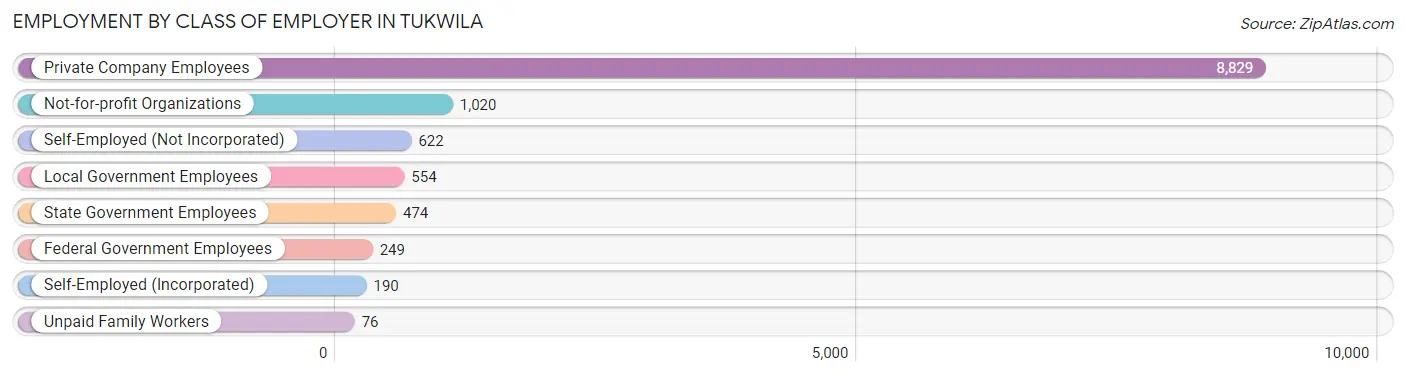
| Employer Class | # Employees | % Employees |
| Private Company Employees | 8,829 | 73.5% |
| Self-Employed (Incorporated) | 190 | 1.6% |
| Self-Employed (Not Incorporated) | 622 | 5.2% |
| Not-for-profit Organizations | 1,020 | 8.5% |
| Local Government Employees | 554 | 4.6% |
| State Government Employees | 474 | 4.0% |
| Federal Government Employees | 249 | 2.1% |
| Unpaid Family Workers | 76 | 0.6% |
| Total | 12,014 | 100.0% |
Employment Status by Age in Tukwila
According to the labor force statistics for Tukwila, out of the total population over 16 years of age (18,016), 72.7% or 13,098 individuals are in the labor force, with 6.2% or 812 of them unemployed. The age group with the highest labor force participation rate is 45 to 54 years, with 87.1% or 2,508 individuals in the labor force. Within the labor force, the 65 to 74 years age range has the highest percentage of unemployed individuals, with 17.1% or 73 of them being unemployed.
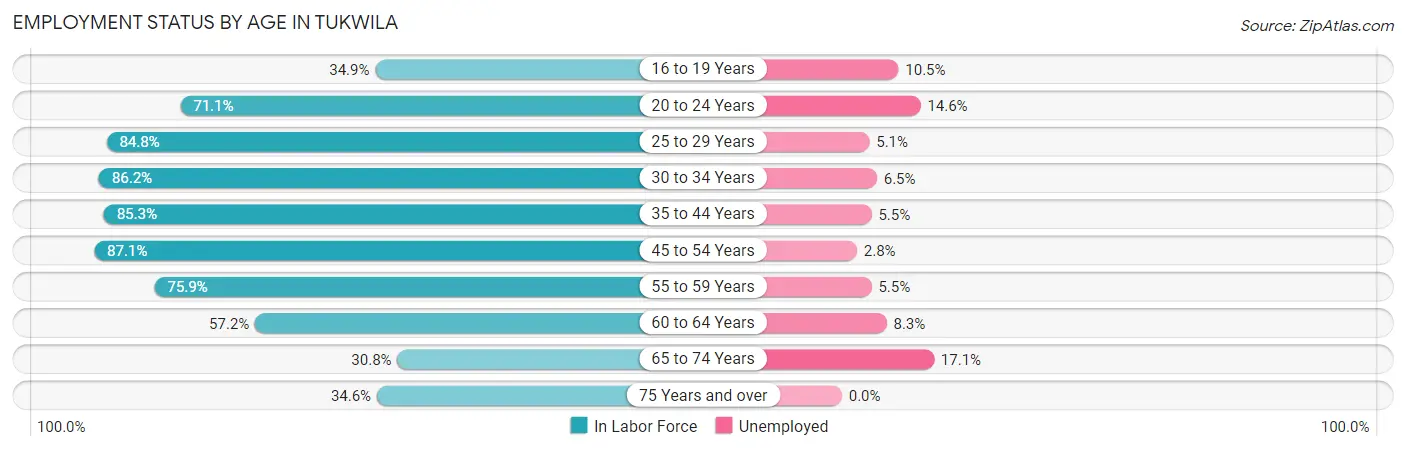
| Age Bracket | In Labor Force | Unemployed |
| 16 to 19 Years | 305 (34.9%) | 32 (10.5%) |
| 20 to 24 Years | 995 (71.1%) | 145 (14.6%) |
| 25 to 29 Years | 1,936 (84.8%) | 99 (5.1%) |
| 30 to 34 Years | 1,941 (86.2%) | 126 (6.5%) |
| 35 to 44 Years | 2,954 (85.3%) | 162 (5.5%) |
| 45 to 54 Years | 2,508 (87.1%) | 70 (2.8%) |
| 55 to 59 Years | 1,101 (75.9%) | 61 (5.5%) |
| 60 to 64 Years | 575 (57.2%) | 48 (8.3%) |
| 65 to 74 Years | 427 (30.8%) | 73 (17.1%) |
| 75 Years and over | 354 (34.6%) | 0 (0.0%) |
| Total | 13,098 (72.7%) | 812 (6.2%) |
Employment Status by Educational Attainment in Tukwila
According to labor force statistics for Tukwila, 82.6% of individuals (11,013) out of the total population between 25 and 64 years of age (13,333) are in the labor force, with 5.2% or 573 of them being unemployed. The group with the highest labor force participation rate are those with the educational attainment of bachelor's degree or higher, with 89.5% or 3,272 individuals in the labor force. Within the labor force, individuals with college / associate degree education have the highest percentage of unemployment, with 7.0% or 241 of them being unemployed.
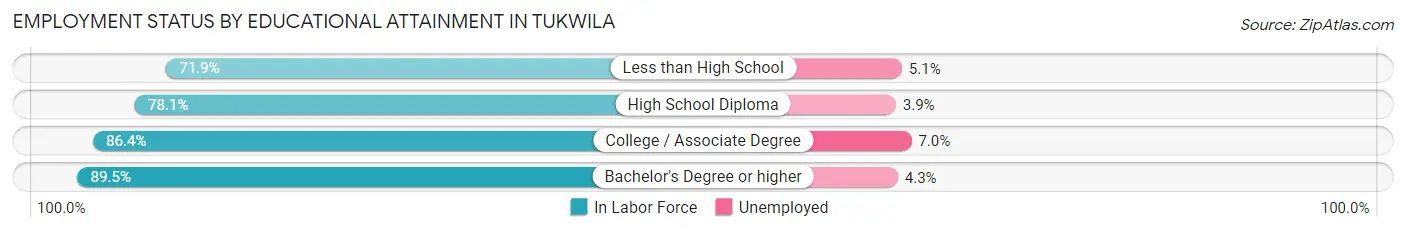
| Educational Attainment | In Labor Force | Unemployed |
| Less than High School | 1,647 (71.9%) | 117 (5.1%) |
| High School Diploma | 2,661 (78.1%) | 133 (3.9%) |
| College / Associate Degree | 3,439 (86.4%) | 279 (7.0%) |
| Bachelor's Degree or higher | 3,272 (89.5%) | 157 (4.3%) |
| Total | 11,013 (82.6%) | 693 (5.2%) |
Employment Occupations by Sex in Tukwila
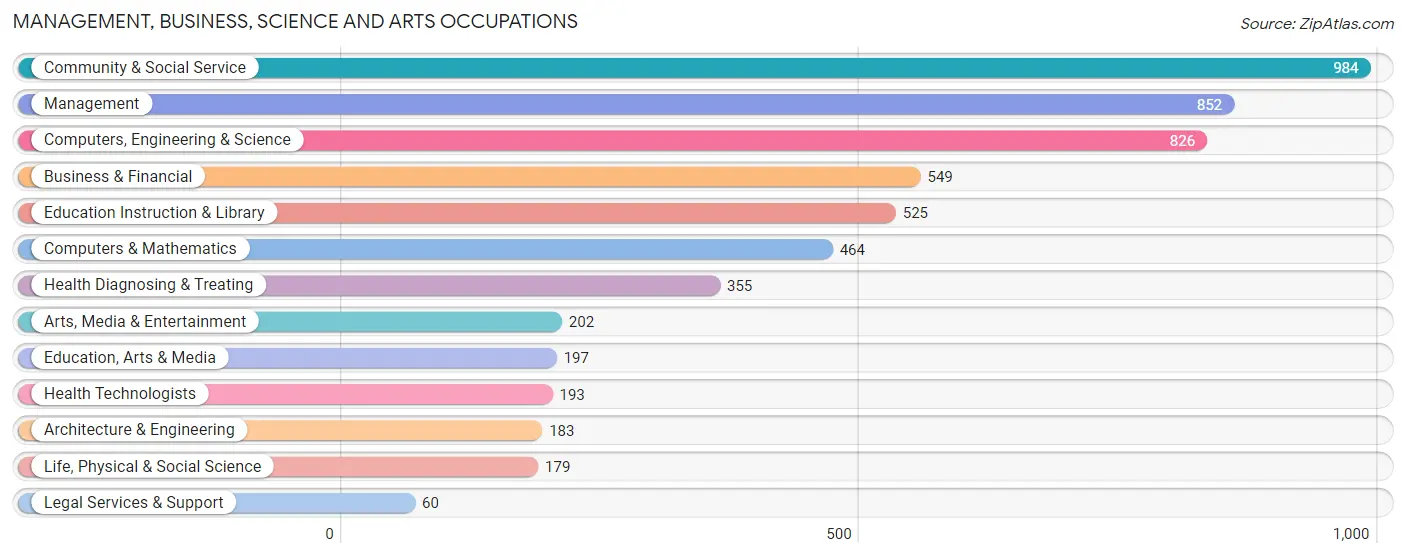
Management, Business, Science and Arts Occupations
The most common Management, Business, Science and Arts occupations in Tukwila are Community & Social Service (984 | 8.1%), Management (852 | 7.0%), Computers, Engineering & Science (826 | 6.8%), Business & Financial (549 | 4.5%), and Education Instruction & Library (525 | 4.3%).
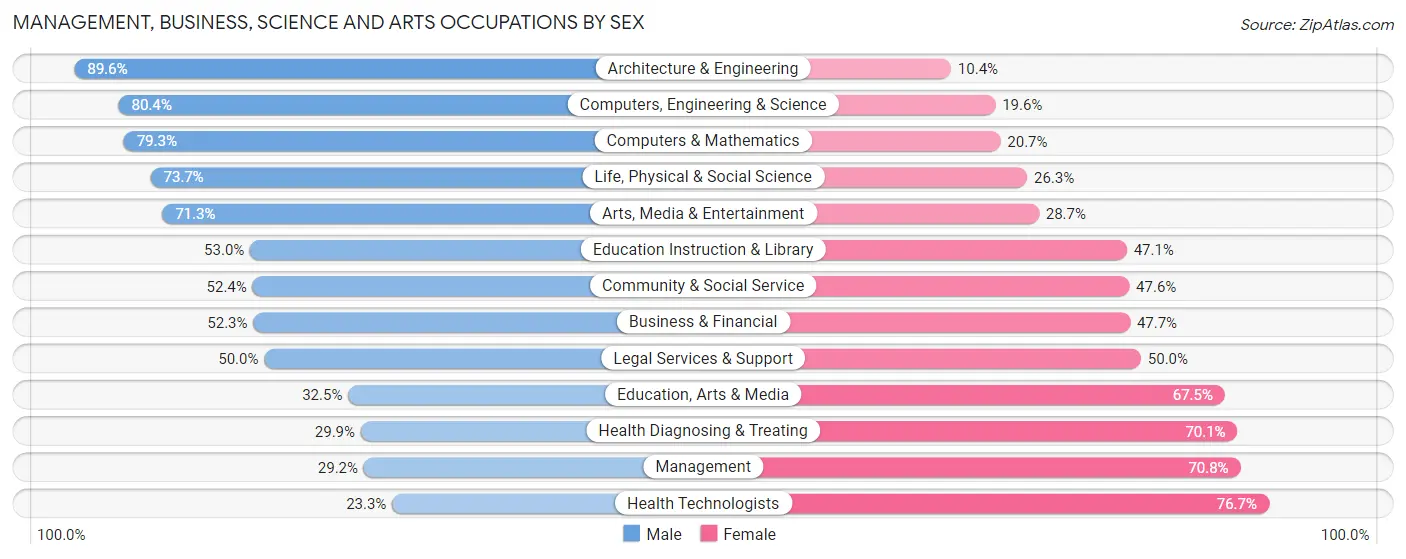
Management, Business, Science and Arts Occupations by Sex
Within the Management, Business, Science and Arts occupations in Tukwila, the most male-oriented occupations are Architecture & Engineering (89.6%), Computers, Engineering & Science (80.4%), and Computers & Mathematics (79.3%), while the most female-oriented occupations are Health Technologists (76.7%), Management (70.8%), and Health Diagnosing & Treating (70.1%).
| Occupation | Male | Female |
| Management | 249 (29.2%) | 603 (70.8%) |
| Business & Financial | 287 (52.3%) | 262 (47.7%) |
| Computers, Engineering & Science | 664 (80.4%) | 162 (19.6%) |
| Computers & Mathematics | 368 (79.3%) | 96 (20.7%) |
| Architecture & Engineering | 164 (89.6%) | 19 (10.4%) |
| Life, Physical & Social Science | 132 (73.7%) | 47 (26.3%) |
| Community & Social Service | 516 (52.4%) | 468 (47.6%) |
| Education, Arts & Media | 64 (32.5%) | 133 (67.5%) |
| Legal Services & Support | 30 (50.0%) | 30 (50.0%) |
| Education Instruction & Library | 278 (52.9%) | 247 (47.0%) |
| Arts, Media & Entertainment | 144 (71.3%) | 58 (28.7%) |
| Health Diagnosing & Treating | 106 (29.9%) | 249 (70.1%) |
| Health Technologists | 45 (23.3%) | 148 (76.7%) |
| Total (Category) | 1,822 (51.1%) | 1,744 (48.9%) |
| Total (Overall) | 7,132 (58.3%) | 5,097 (41.7%) |
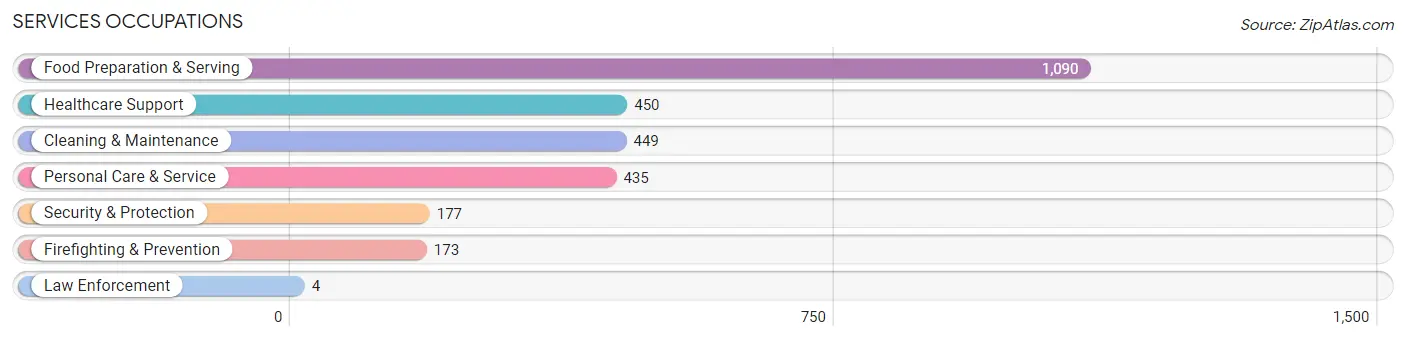
Services Occupations
The most common Services occupations in Tukwila are Food Preparation & Serving (1,090 | 8.9%), Healthcare Support (450 | 3.7%), Cleaning & Maintenance (449 | 3.7%), Personal Care & Service (435 | 3.6%), and Security & Protection (177 | 1.5%).
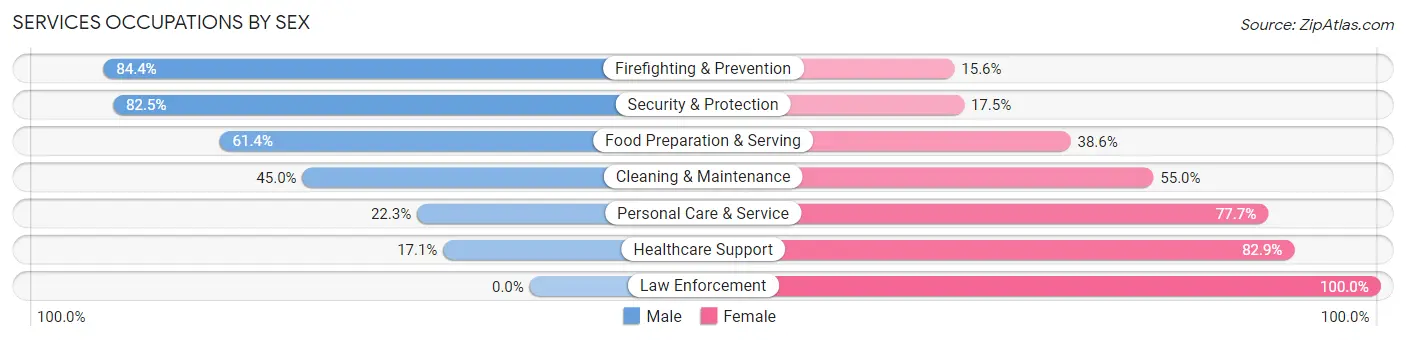
Services Occupations by Sex
Within the Services occupations in Tukwila, the most male-oriented occupations are Firefighting & Prevention (84.4%), Security & Protection (82.5%), and Food Preparation & Serving (61.4%), while the most female-oriented occupations are Law Enforcement (100.0%), Healthcare Support (82.9%), and Personal Care & Service (77.7%).
| Occupation | Male | Female |
| Healthcare Support | 77 (17.1%) | 373 (82.9%) |
| Security & Protection | 146 (82.5%) | 31 (17.5%) |
| Firefighting & Prevention | 146 (84.4%) | 27 (15.6%) |
| Law Enforcement | 0 (0.0%) | 4 (100.0%) |
| Food Preparation & Serving | 669 (61.4%) | 421 (38.6%) |
| Cleaning & Maintenance | 202 (45.0%) | 247 (55.0%) |
| Personal Care & Service | 97 (22.3%) | 338 (77.7%) |
| Total (Category) | 1,191 (45.8%) | 1,410 (54.2%) |
| Total (Overall) | 7,132 (58.3%) | 5,097 (41.7%) |
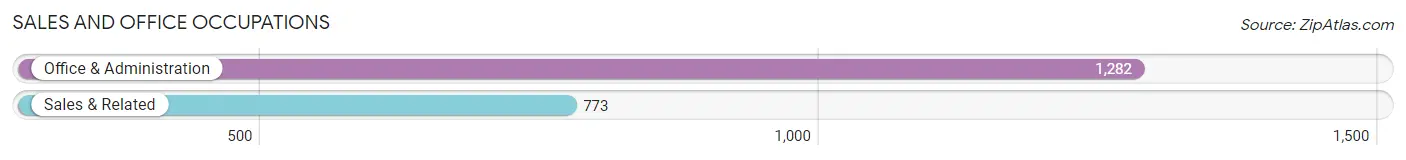
Sales and Office Occupations
The most common Sales and Office occupations in Tukwila are Office & Administration (1,282 | 10.5%), and Sales & Related (773 | 6.3%).
Sales and Office Occupations by Sex
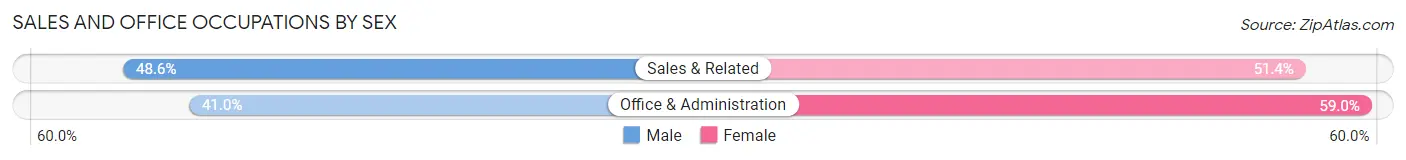
| Occupation | Male | Female |
| Sales & Related | 376 (48.6%) | 397 (51.4%) |
| Office & Administration | 526 (41.0%) | 756 (59.0%) |
| Total (Category) | 902 (43.9%) | 1,153 (56.1%) |
| Total (Overall) | 7,132 (58.3%) | 5,097 (41.7%) |
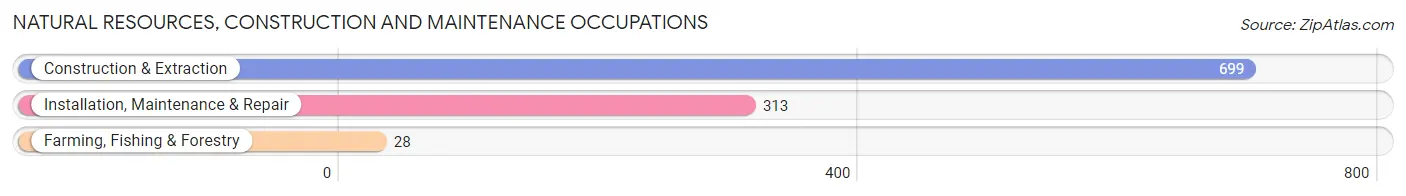
Natural Resources, Construction and Maintenance Occupations
The most common Natural Resources, Construction and Maintenance occupations in Tukwila are Construction & Extraction (699 | 5.7%), Installation, Maintenance & Repair (313 | 2.6%), and Farming, Fishing & Forestry (28 | 0.2%).
Natural Resources, Construction and Maintenance Occupations by Sex
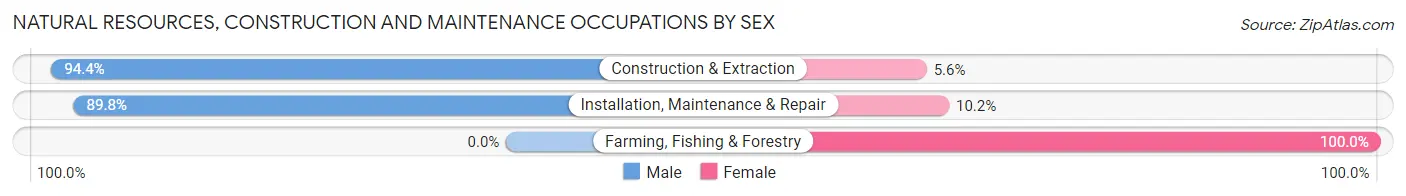
| Occupation | Male | Female |
| Farming, Fishing & Forestry | 0 (0.0%) | 28 (100.0%) |
| Construction & Extraction | 660 (94.4%) | 39 (5.6%) |
| Installation, Maintenance & Repair | 281 (89.8%) | 32 (10.2%) |
| Total (Category) | 941 (90.5%) | 99 (9.5%) |
| Total (Overall) | 7,132 (58.3%) | 5,097 (41.7%) |
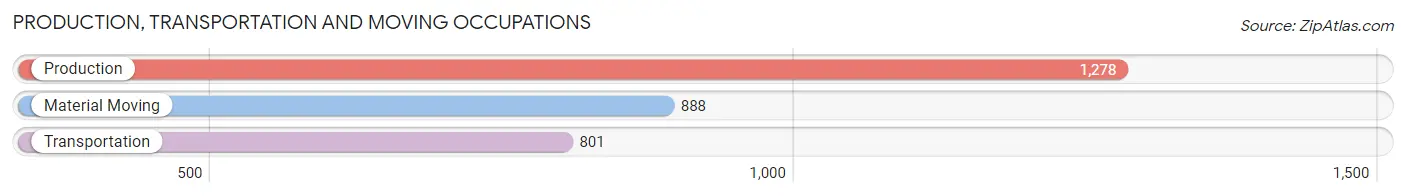
Production, Transportation and Moving Occupations
The most common Production, Transportation and Moving occupations in Tukwila are Production (1,278 | 10.4%), Material Moving (888 | 7.3%), and Transportation (801 | 6.6%).
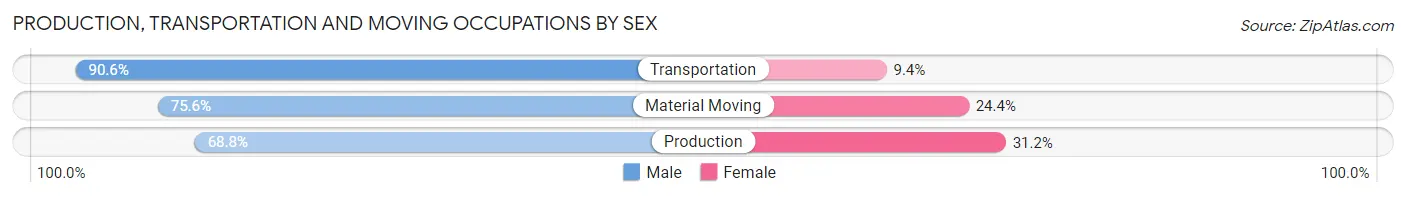
Production, Transportation and Moving Occupations by Sex
| Occupation | Male | Female |
| Production | 879 (68.8%) | 399 (31.2%) |
| Transportation | 726 (90.6%) | 75 (9.4%) |
| Material Moving | 671 (75.6%) | 217 (24.4%) |
| Total (Category) | 2,276 (76.7%) | 691 (23.3%) |
| Total (Overall) | 7,132 (58.3%) | 5,097 (41.7%) |
Employment Industries by Sex in Tukwila
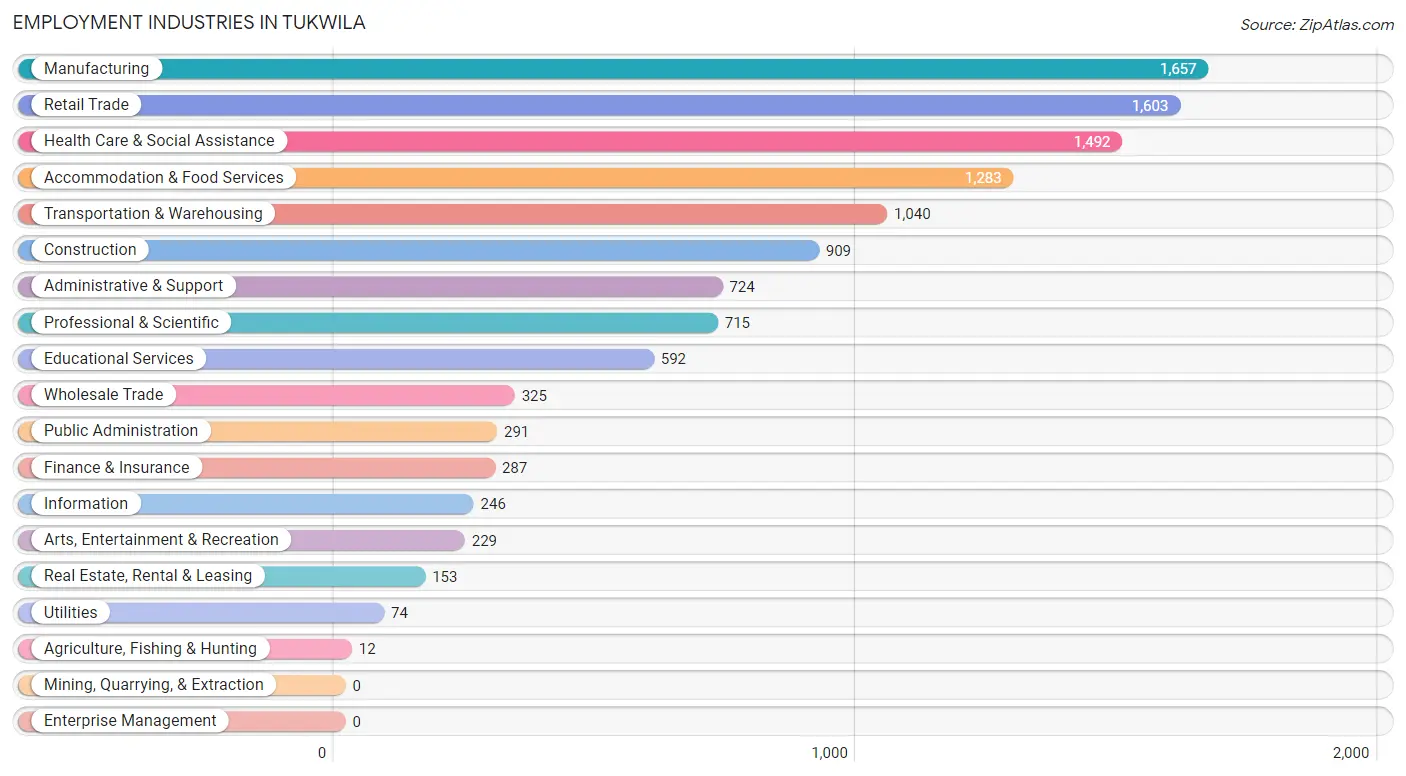
Employment Industries in Tukwila
The major employment industries in Tukwila include Manufacturing (1,657 | 13.6%), Retail Trade (1,603 | 13.1%), Health Care & Social Assistance (1,492 | 12.2%), Accommodation & Food Services (1,283 | 10.5%), and Transportation & Warehousing (1,040 | 8.5%).
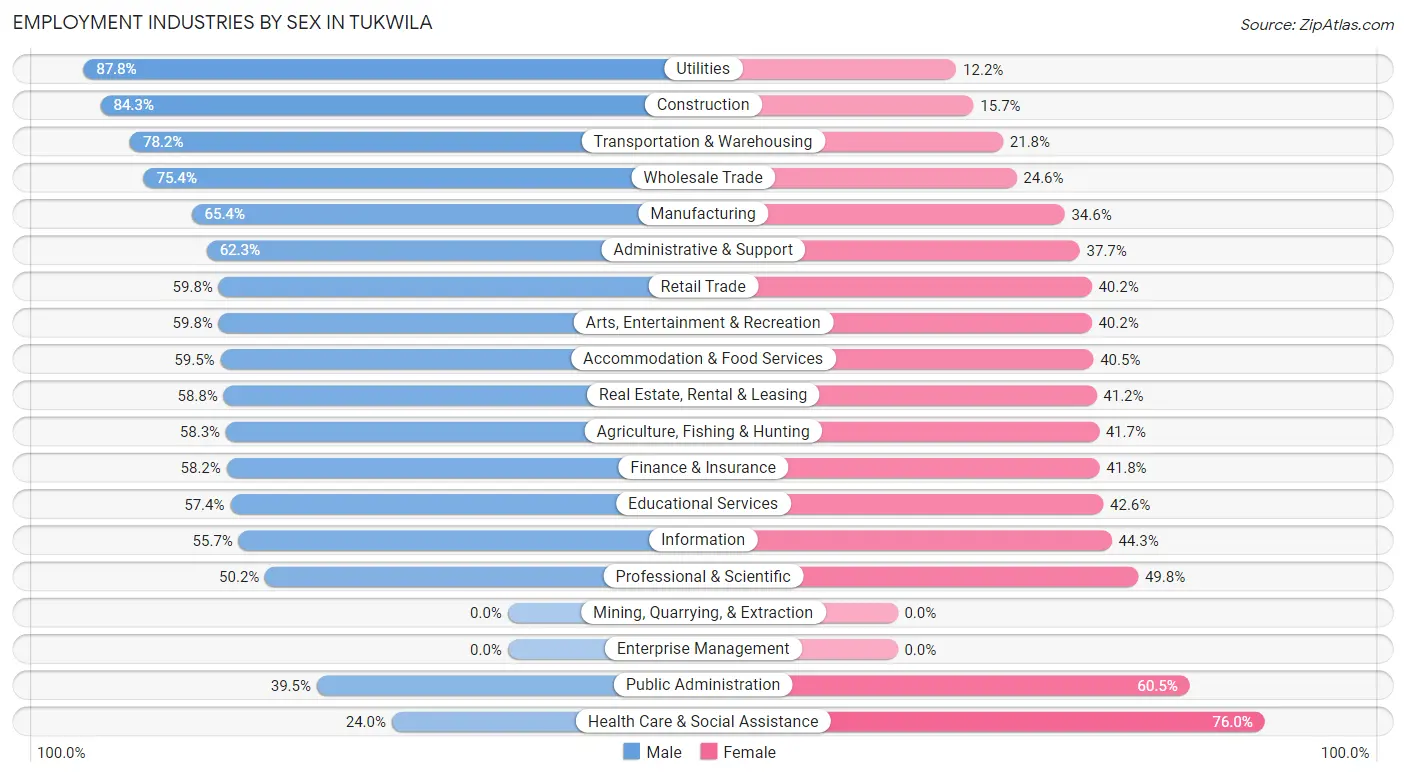
Employment Industries by Sex in Tukwila
The Tukwila industries that see more men than women are Utilities (87.8%), Construction (84.3%), and Transportation & Warehousing (78.2%), whereas the industries that tend to have a higher number of women are Health Care & Social Assistance (76.0%), Public Administration (60.5%), and Professional & Scientific (49.8%).
| Industry | Male | Female |
| Agriculture, Fishing & Hunting | 7 (58.3%) | 5 (41.7%) |
| Mining, Quarrying, & Extraction | 0 (0.0%) | 0 (0.0%) |
| Construction | 766 (84.3%) | 143 (15.7%) |
| Manufacturing | 1,084 (65.4%) | 573 (34.6%) |
| Wholesale Trade | 245 (75.4%) | 80 (24.6%) |
| Retail Trade | 959 (59.8%) | 644 (40.2%) |
| Transportation & Warehousing | 813 (78.2%) | 227 (21.8%) |
| Utilities | 65 (87.8%) | 9 (12.2%) |
| Information | 137 (55.7%) | 109 (44.3%) |
| Finance & Insurance | 167 (58.2%) | 120 (41.8%) |
| Real Estate, Rental & Leasing | 90 (58.8%) | 63 (41.2%) |
| Professional & Scientific | 359 (50.2%) | 356 (49.8%) |
| Enterprise Management | 0 (0.0%) | 0 (0.0%) |
| Administrative & Support | 451 (62.3%) | 273 (37.7%) |
| Educational Services | 340 (57.4%) | 252 (42.6%) |
| Health Care & Social Assistance | 358 (24.0%) | 1,134 (76.0%) |
| Arts, Entertainment & Recreation | 137 (59.8%) | 92 (40.2%) |
| Accommodation & Food Services | 763 (59.5%) | 520 (40.5%) |
| Public Administration | 115 (39.5%) | 176 (60.5%) |
| Total | 7,132 (58.3%) | 5,097 (41.7%) |
Education in Tukwila
School Enrollment in Tukwila
The most common levels of schooling among the 4,661 students in Tukwila are middle school (1,097 | 23.5%), college / undergraduate (1,054 | 22.6%), and elementary school (771 | 16.5%).
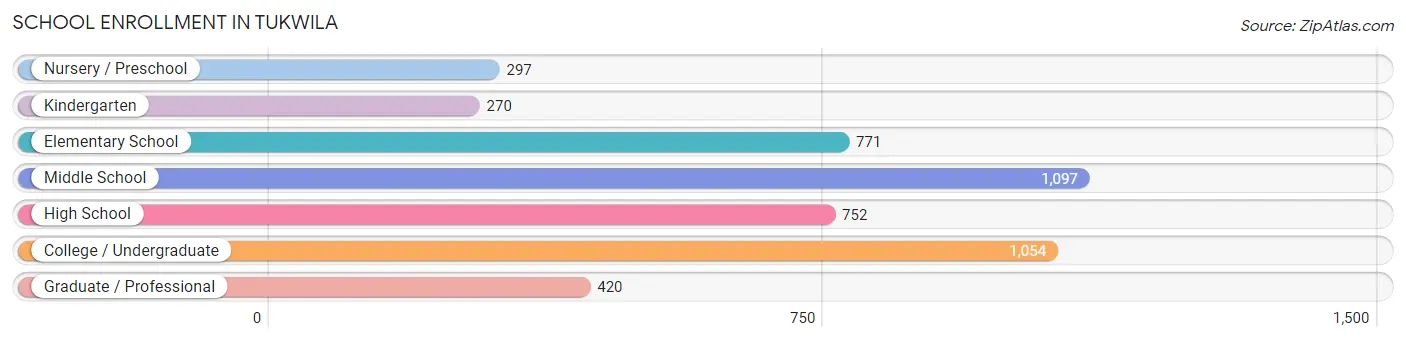
| School Level | # Students | % Students |
| Nursery / Preschool | 297 | 6.4% |
| Kindergarten | 270 | 5.8% |
| Elementary School | 771 | 16.5% |
| Middle School | 1,097 | 23.5% |
| High School | 752 | 16.1% |
| College / Undergraduate | 1,054 | 22.6% |
| Graduate / Professional | 420 | 9.0% |
| Total | 4,661 | 100.0% |
School Enrollment by Age by Funding Source in Tukwila
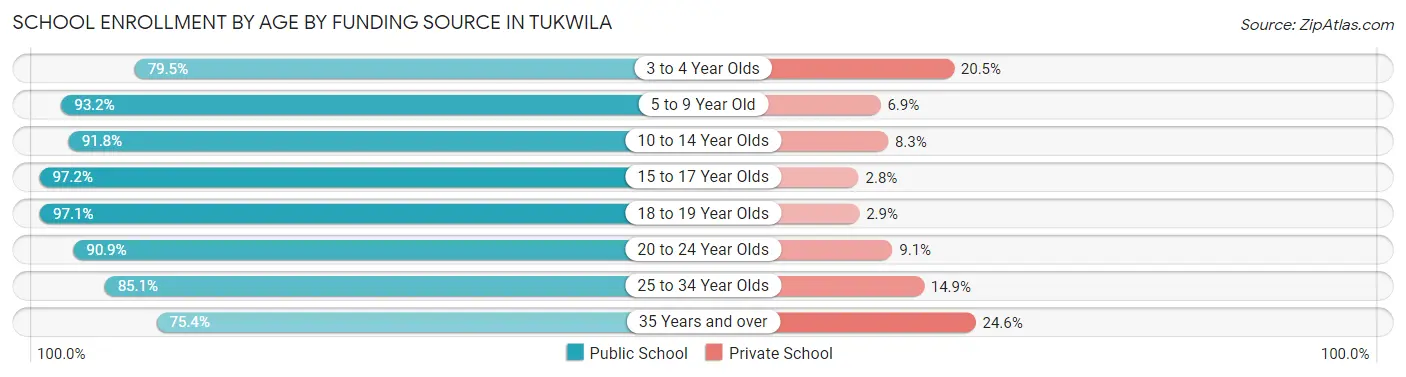
Out of a total of 4,661 students who are enrolled in schools in Tukwila, 452 (9.7%) attend a private institution, while the remaining 4,209 (90.3%) are enrolled in public schools. The age group of 35 years and over has the highest likelihood of being enrolled in private schools, with 85 (24.6% in the age bracket) enrolled. Conversely, the age group of 15 to 17 year olds has the lowest likelihood of being enrolled in a private school, with 419 (97.2% in the age bracket) attending a public institution.
| Age Bracket | Public School | Private School |
| 3 to 4 Year Olds | 182 (79.5%) | 47 (20.5%) |
| 5 to 9 Year Old | 965 (93.1%) | 71 (6.9%) |
| 10 to 14 Year Olds | 1,212 (91.7%) | 109 (8.3%) |
| 15 to 17 Year Olds | 419 (97.2%) | 12 (2.8%) |
| 18 to 19 Year Olds | 335 (97.1%) | 10 (2.9%) |
| 20 to 24 Year Olds | 361 (90.9%) | 36 (9.1%) |
| 25 to 34 Year Olds | 473 (85.1%) | 83 (14.9%) |
| 35 Years and over | 261 (75.4%) | 85 (24.6%) |
| Total | 4,209 (90.3%) | 452 (9.7%) |
Educational Attainment by Field of Study in Tukwila
Business (935 | 20.7%), engineering (540 | 12.0%), science & technology (406 | 9.0%), social sciences (387 | 8.6%), and education (293 | 6.5%) are the most common fields of study among 4,514 individuals in Tukwila who have obtained a bachelor's degree or higher.
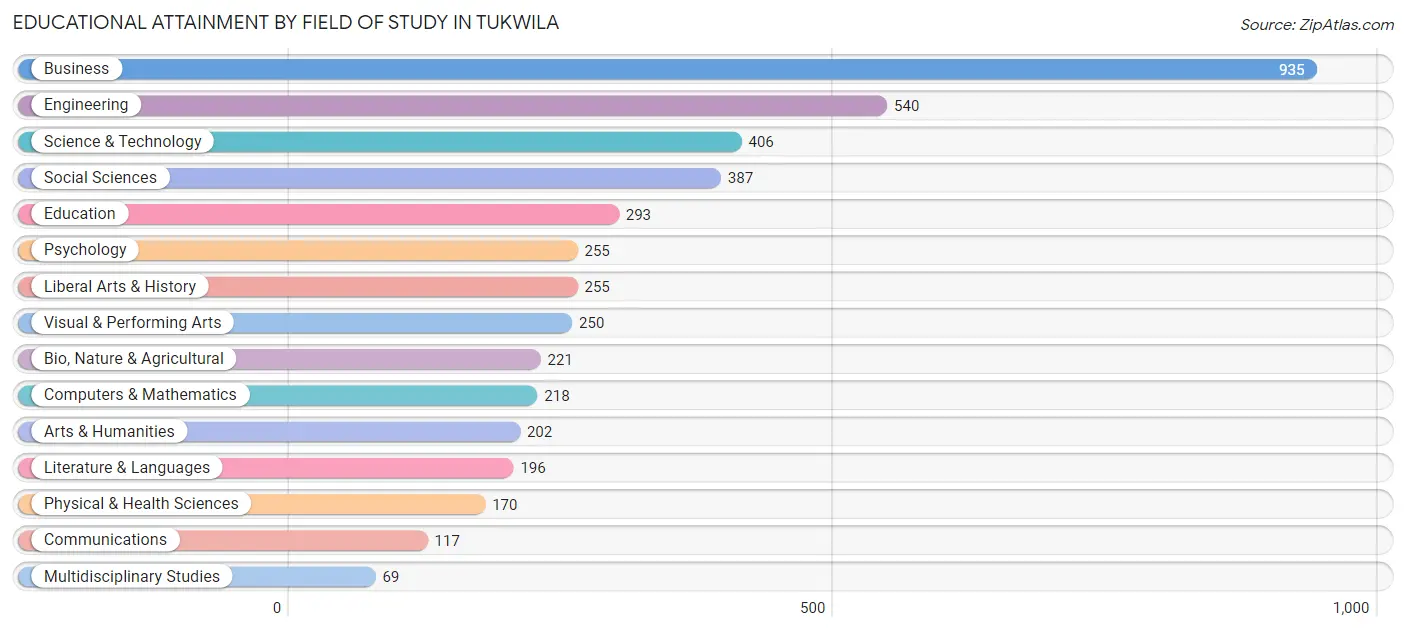
| Field of Study | # Graduates | % Graduates |
| Computers & Mathematics | 218 | 4.8% |
| Bio, Nature & Agricultural | 221 | 4.9% |
| Physical & Health Sciences | 170 | 3.8% |
| Psychology | 255 | 5.7% |
| Social Sciences | 387 | 8.6% |
| Engineering | 540 | 12.0% |
| Multidisciplinary Studies | 69 | 1.5% |
| Science & Technology | 406 | 9.0% |
| Business | 935 | 20.7% |
| Education | 293 | 6.5% |
| Literature & Languages | 196 | 4.3% |
| Liberal Arts & History | 255 | 5.7% |
| Visual & Performing Arts | 250 | 5.5% |
| Communications | 117 | 2.6% |
| Arts & Humanities | 202 | 4.5% |
| Total | 4,514 | 100.0% |
Transportation & Commute in Tukwila
Vehicle Availability by Sex in Tukwila
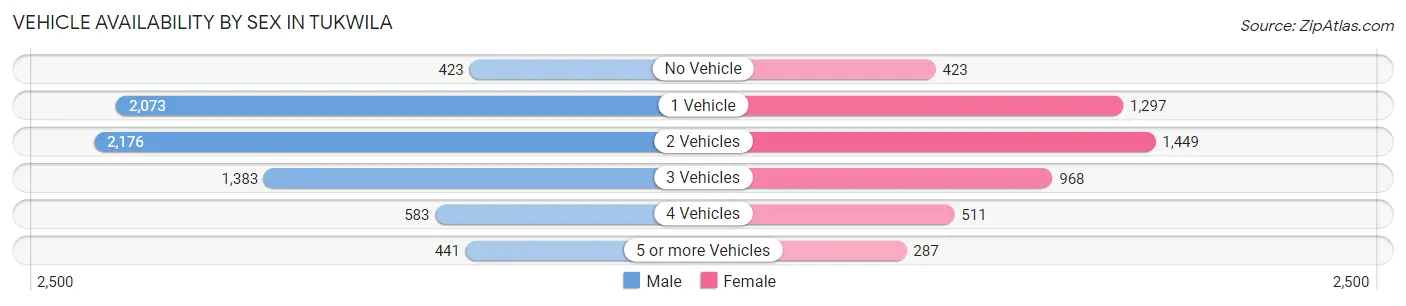
The most prevalent vehicle ownership categories in Tukwila are males with 2 vehicles (2,176, accounting for 30.7%) and females with 2 vehicles (1,449, making up 44.1%).
| Vehicles Available | Male | Female |
| No Vehicle | 423 (6.0%) | 423 (8.6%) |
| 1 Vehicle | 2,073 (29.3%) | 1,297 (26.3%) |
| 2 Vehicles | 2,176 (30.7%) | 1,449 (29.4%) |
| 3 Vehicles | 1,383 (19.5%) | 968 (19.6%) |
| 4 Vehicles | 583 (8.2%) | 511 (10.3%) |
| 5 or more Vehicles | 441 (6.2%) | 287 (5.8%) |
| Total | 7,079 (100.0%) | 4,935 (100.0%) |
Commute Time in Tukwila
The most frequently occuring commute durations in Tukwila are 15 to 19 minutes (2,137 commuters, 19.5%), 30 to 34 minutes (1,675 commuters, 15.3%), and 10 to 14 minutes (1,535 commuters, 14.0%).
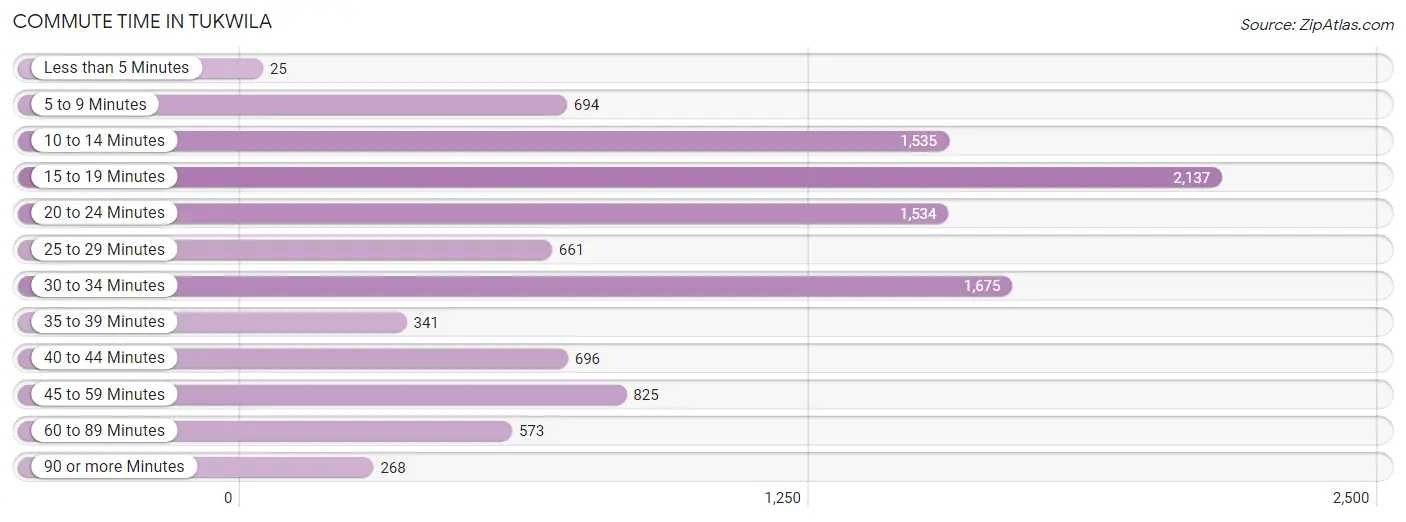
| Commute Time | # Commuters | % Commuters |
| Less than 5 Minutes | 25 | 0.2% |
| 5 to 9 Minutes | 694 | 6.3% |
| 10 to 14 Minutes | 1,535 | 14.0% |
| 15 to 19 Minutes | 2,137 | 19.5% |
| 20 to 24 Minutes | 1,534 | 14.0% |
| 25 to 29 Minutes | 661 | 6.0% |
| 30 to 34 Minutes | 1,675 | 15.3% |
| 35 to 39 Minutes | 341 | 3.1% |
| 40 to 44 Minutes | 696 | 6.4% |
| 45 to 59 Minutes | 825 | 7.5% |
| 60 to 89 Minutes | 573 | 5.2% |
| 90 or more Minutes | 268 | 2.4% |
Commute Time by Sex in Tukwila
The most common commute times in Tukwila are 15 to 19 minutes (1,186 commuters, 18.3%) for males and 15 to 19 minutes (951 commuters, 21.1%) for females.
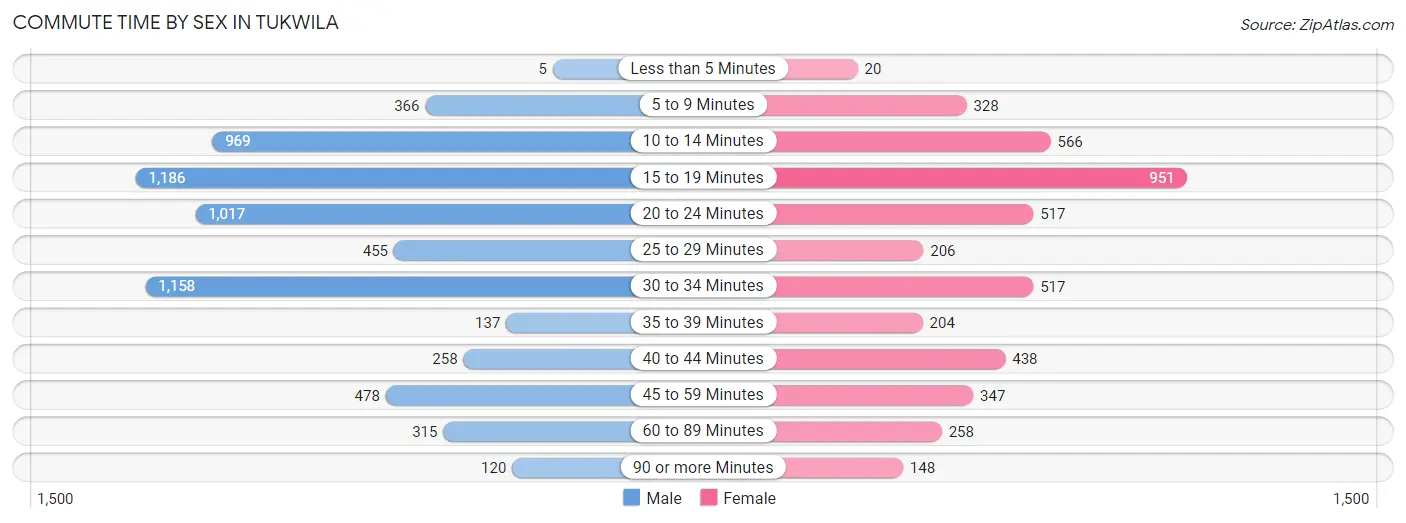
| Commute Time | Male | Female |
| Less than 5 Minutes | 5 (0.1%) | 20 (0.4%) |
| 5 to 9 Minutes | 366 (5.7%) | 328 (7.3%) |
| 10 to 14 Minutes | 969 (15.0%) | 566 (12.6%) |
| 15 to 19 Minutes | 1,186 (18.3%) | 951 (21.1%) |
| 20 to 24 Minutes | 1,017 (15.7%) | 517 (11.5%) |
| 25 to 29 Minutes | 455 (7.0%) | 206 (4.6%) |
| 30 to 34 Minutes | 1,158 (17.9%) | 517 (11.5%) |
| 35 to 39 Minutes | 137 (2.1%) | 204 (4.5%) |
| 40 to 44 Minutes | 258 (4.0%) | 438 (9.7%) |
| 45 to 59 Minutes | 478 (7.4%) | 347 (7.7%) |
| 60 to 89 Minutes | 315 (4.9%) | 258 (5.7%) |
| 90 or more Minutes | 120 (1.9%) | 148 (3.3%) |
Time of Departure to Work by Sex in Tukwila
The most frequent times of departure to work in Tukwila are 6:00 AM to 6:29 AM (1,032, 16.0%) for males and 7:00 AM to 7:29 AM (648, 14.4%) for females.
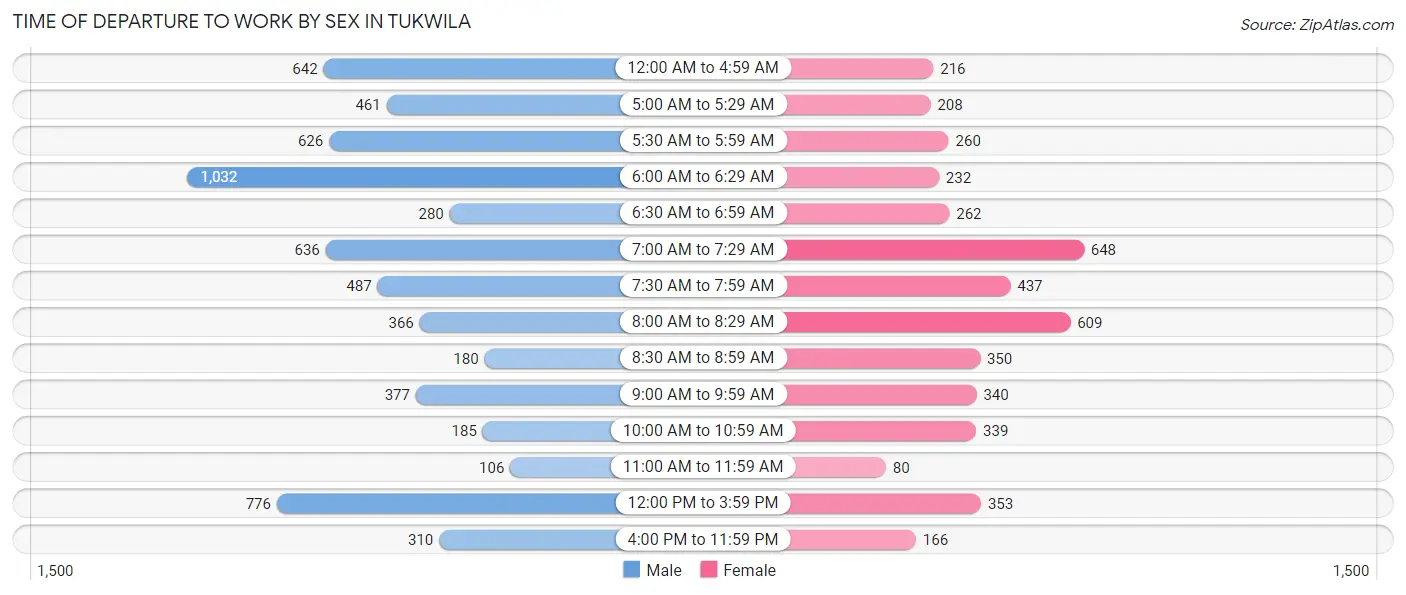
| Time of Departure | Male | Female |
| 12:00 AM to 4:59 AM | 642 (9.9%) | 216 (4.8%) |
| 5:00 AM to 5:29 AM | 461 (7.1%) | 208 (4.6%) |
| 5:30 AM to 5:59 AM | 626 (9.7%) | 260 (5.8%) |
| 6:00 AM to 6:29 AM | 1,032 (16.0%) | 232 (5.2%) |
| 6:30 AM to 6:59 AM | 280 (4.3%) | 262 (5.8%) |
| 7:00 AM to 7:29 AM | 636 (9.8%) | 648 (14.4%) |
| 7:30 AM to 7:59 AM | 487 (7.5%) | 437 (9.7%) |
| 8:00 AM to 8:29 AM | 366 (5.7%) | 609 (13.5%) |
| 8:30 AM to 8:59 AM | 180 (2.8%) | 350 (7.8%) |
| 9:00 AM to 9:59 AM | 377 (5.8%) | 340 (7.6%) |
| 10:00 AM to 10:59 AM | 185 (2.9%) | 339 (7.5%) |
| 11:00 AM to 11:59 AM | 106 (1.6%) | 80 (1.8%) |
| 12:00 PM to 3:59 PM | 776 (12.0%) | 353 (7.8%) |
| 4:00 PM to 11:59 PM | 310 (4.8%) | 166 (3.7%) |
| Total | 6,464 (100.0%) | 4,500 (100.0%) |
Housing Occupancy in Tukwila
Occupancy by Ownership in Tukwila
Of the total 8,098 dwellings in Tukwila, owner-occupied units account for 3,435 (42.4%), while renter-occupied units make up 4,663 (57.6%).
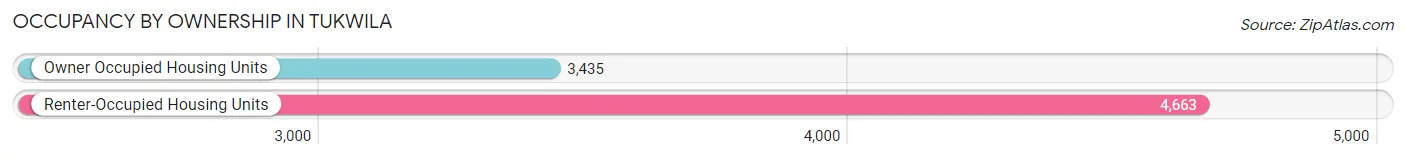
| Occupancy | # Housing Units | % Housing Units |
| Owner Occupied Housing Units | 3,435 | 42.4% |
| Renter-Occupied Housing Units | 4,663 | 57.6% |
| Total Occupied Housing Units | 8,098 | 100.0% |
Occupancy by Household Size in Tukwila
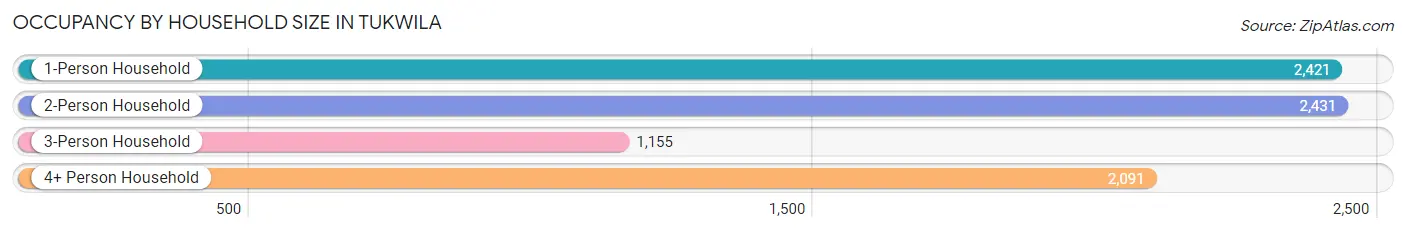
| Household Size | # Housing Units | % Housing Units |
| 1-Person Household | 2,421 | 29.9% |
| 2-Person Household | 2,431 | 30.0% |
| 3-Person Household | 1,155 | 14.3% |
| 4+ Person Household | 2,091 | 25.8% |
| Total Housing Units | 8,098 | 100.0% |
Occupancy by Ownership by Household Size in Tukwila
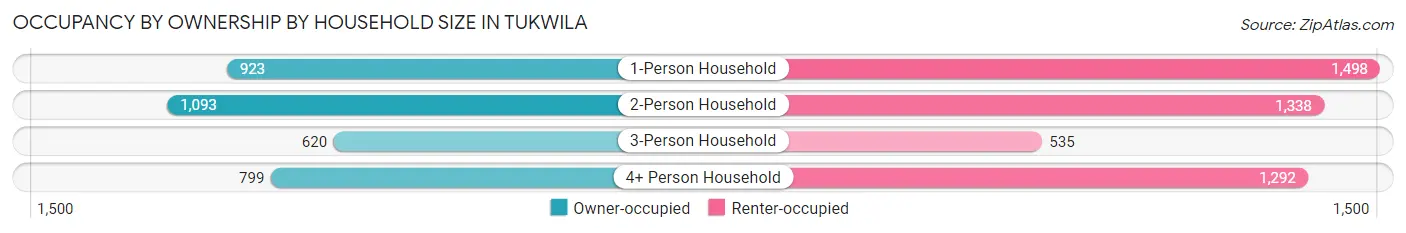
| Household Size | Owner-occupied | Renter-occupied |
| 1-Person Household | 923 (38.1%) | 1,498 (61.9%) |
| 2-Person Household | 1,093 (45.0%) | 1,338 (55.0%) |
| 3-Person Household | 620 (53.7%) | 535 (46.3%) |
| 4+ Person Household | 799 (38.2%) | 1,292 (61.8%) |
| Total Housing Units | 3,435 (42.4%) | 4,663 (57.6%) |
Occupancy by Educational Attainment in Tukwila
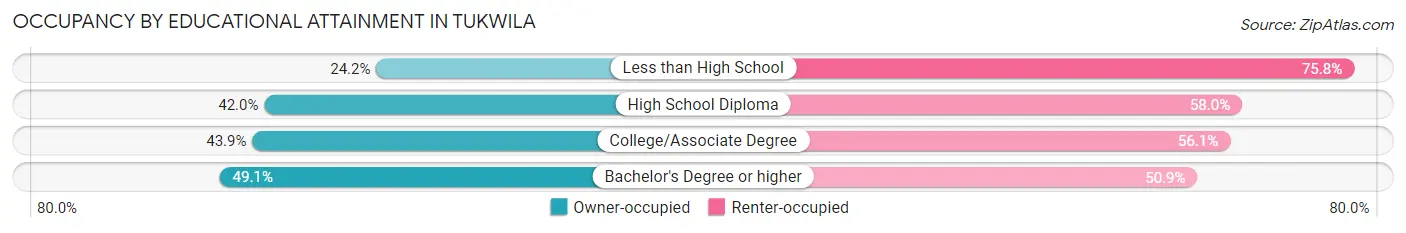
| Household Size | Owner-occupied | Renter-occupied |
| Less than High School | 249 (24.2%) | 779 (75.8%) |
| High School Diploma | 947 (42.0%) | 1,309 (58.0%) |
| College/Associate Degree | 1,039 (43.9%) | 1,329 (56.1%) |
| Bachelor's Degree or higher | 1,200 (49.1%) | 1,246 (50.9%) |
Occupancy by Age of Householder in Tukwila
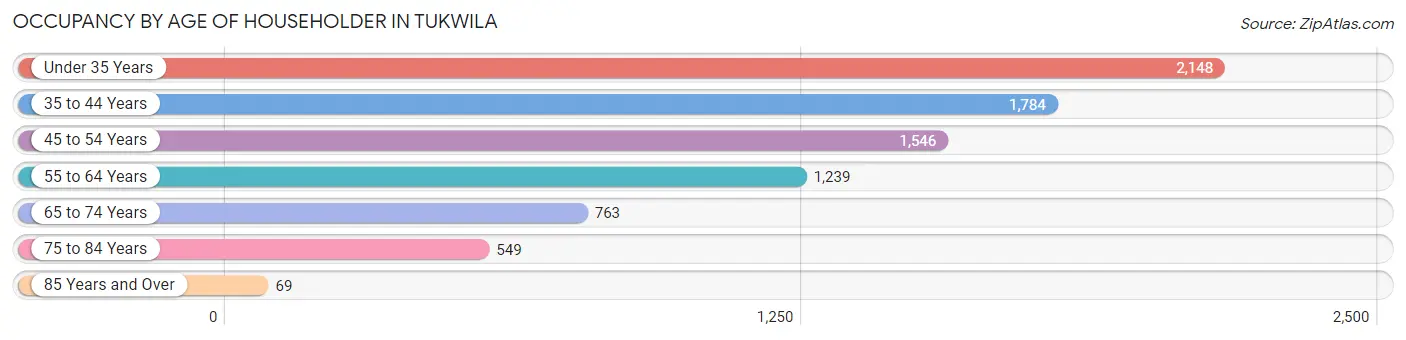
| Age Bracket | # Households | % Households |
| Under 35 Years | 2,148 | 26.5% |
| 35 to 44 Years | 1,784 | 22.0% |
| 45 to 54 Years | 1,546 | 19.1% |
| 55 to 64 Years | 1,239 | 15.3% |
| 65 to 74 Years | 763 | 9.4% |
| 75 to 84 Years | 549 | 6.8% |
| 85 Years and Over | 69 | 0.9% |
| Total | 8,098 | 100.0% |
Housing Finances in Tukwila
Median Income by Occupancy in Tukwila
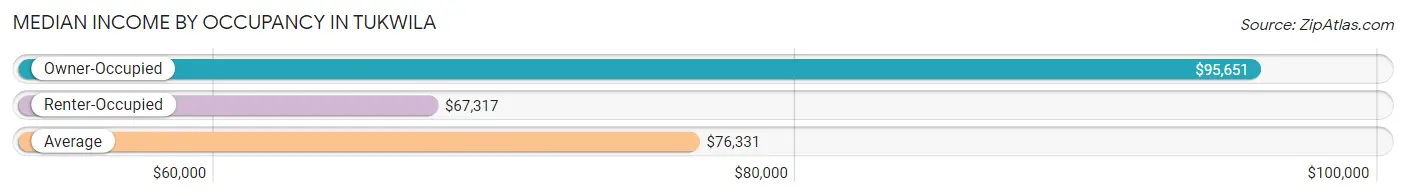
| Occupancy Type | # Households | Median Income |
| Owner-Occupied | 3,435 (42.4%) | $95,651 |
| Renter-Occupied | 4,663 (57.6%) | $67,317 |
| Average | 8,098 (100.0%) | $76,331 |
Occupancy by Householder Income Bracket in Tukwila
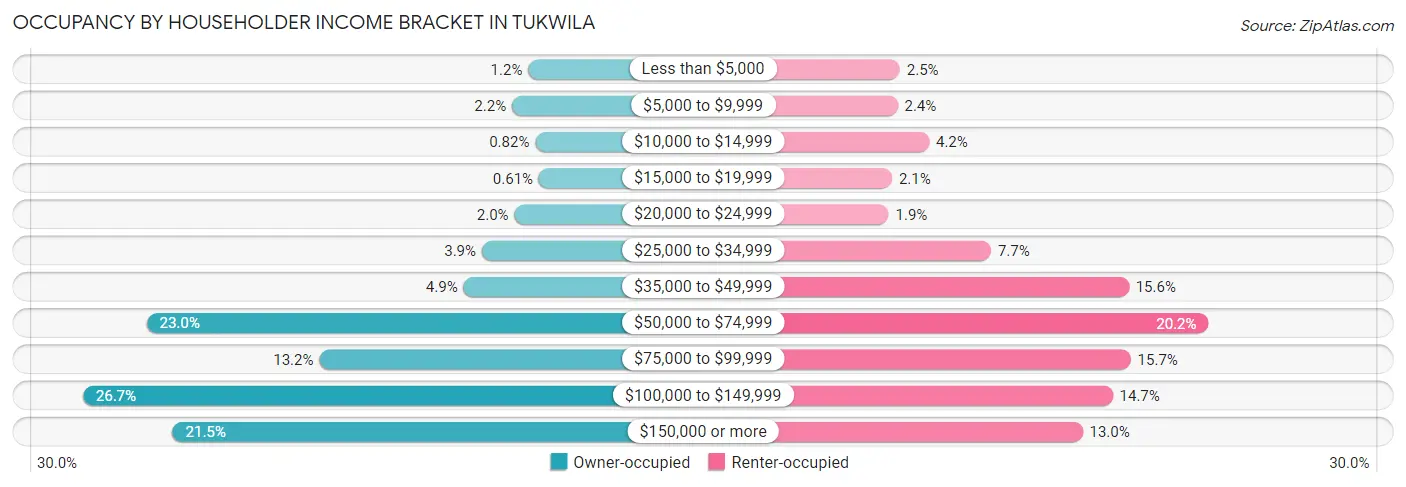
| Income Bracket | Owner-occupied | Renter-occupied |
| Less than $5,000 | 42 (1.2%) | 118 (2.5%) |
| $5,000 to $9,999 | 74 (2.1%) | 112 (2.4%) |
| $10,000 to $14,999 | 28 (0.8%) | 196 (4.2%) |
| $15,000 to $19,999 | 21 (0.6%) | 97 (2.1%) |
| $20,000 to $24,999 | 69 (2.0%) | 88 (1.9%) |
| $25,000 to $34,999 | 133 (3.9%) | 361 (7.7%) |
| $35,000 to $49,999 | 169 (4.9%) | 728 (15.6%) |
| $50,000 to $74,999 | 791 (23.0%) | 940 (20.2%) |
| $75,000 to $99,999 | 452 (13.2%) | 733 (15.7%) |
| $100,000 to $149,999 | 916 (26.7%) | 685 (14.7%) |
| $150,000 or more | 740 (21.5%) | 605 (13.0%) |
| Total | 3,435 (100.0%) | 4,663 (100.0%) |
Monthly Housing Cost Tiers in Tukwila
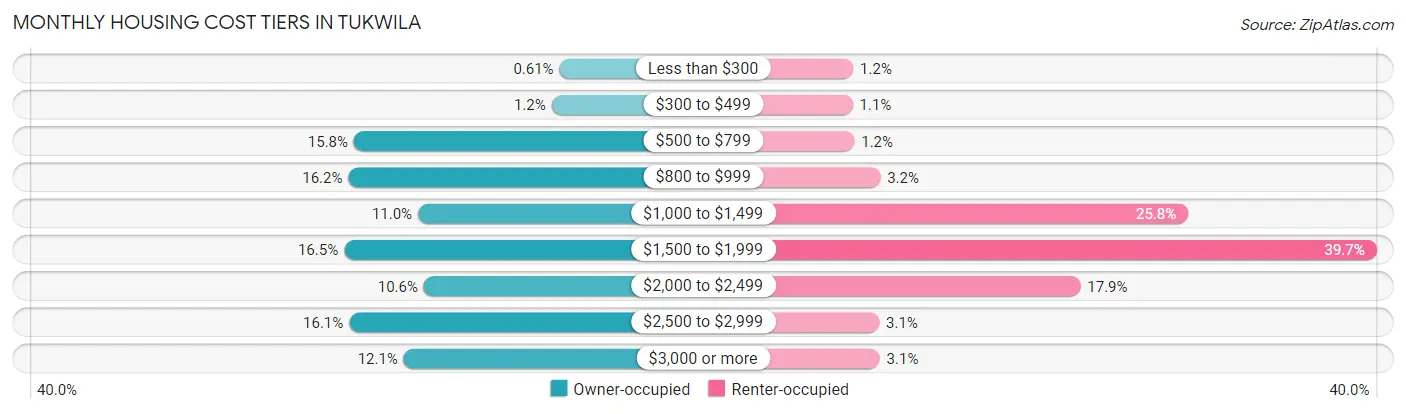
| Monthly Cost | Owner-occupied | Renter-occupied |
| Less than $300 | 21 (0.6%) | 54 (1.2%) |
| $300 to $499 | 41 (1.2%) | 52 (1.1%) |
| $500 to $799 | 541 (15.8%) | 58 (1.2%) |
| $800 to $999 | 555 (16.2%) | 147 (3.2%) |
| $1,000 to $1,499 | 379 (11.0%) | 1,204 (25.8%) |
| $1,500 to $1,999 | 566 (16.5%) | 1,851 (39.7%) |
| $2,000 to $2,499 | 364 (10.6%) | 834 (17.9%) |
| $2,500 to $2,999 | 553 (16.1%) | 143 (3.1%) |
| $3,000 or more | 415 (12.1%) | 145 (3.1%) |
| Total | 3,435 (100.0%) | 4,663 (100.0%) |
Physical Housing Characteristics in Tukwila
Housing Structures in Tukwila
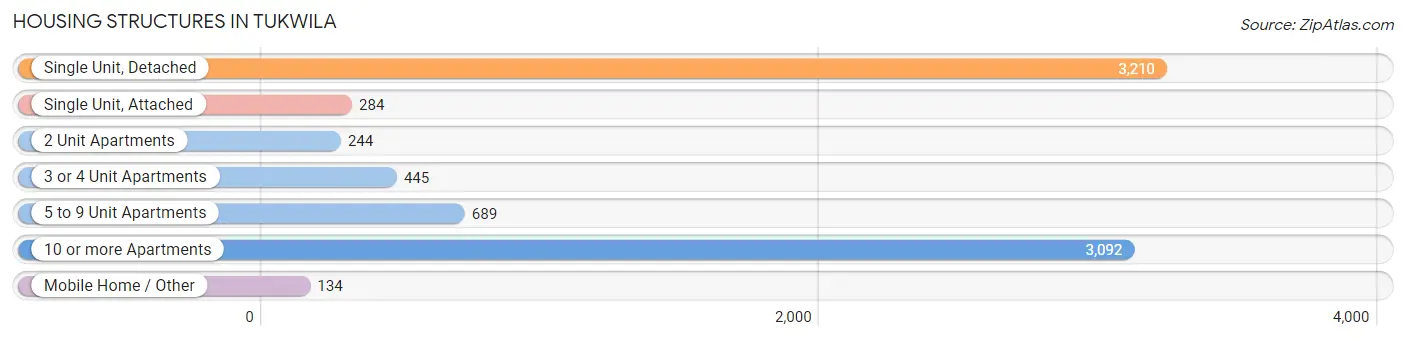
| Structure Type | # Housing Units | % Housing Units |
| Single Unit, Detached | 3,210 | 39.6% |
| Single Unit, Attached | 284 | 3.5% |
| 2 Unit Apartments | 244 | 3.0% |
| 3 or 4 Unit Apartments | 445 | 5.5% |
| 5 to 9 Unit Apartments | 689 | 8.5% |
| 10 or more Apartments | 3,092 | 38.2% |
| Mobile Home / Other | 134 | 1.7% |
| Total | 8,098 | 100.0% |
Housing Structures by Occupancy in Tukwila
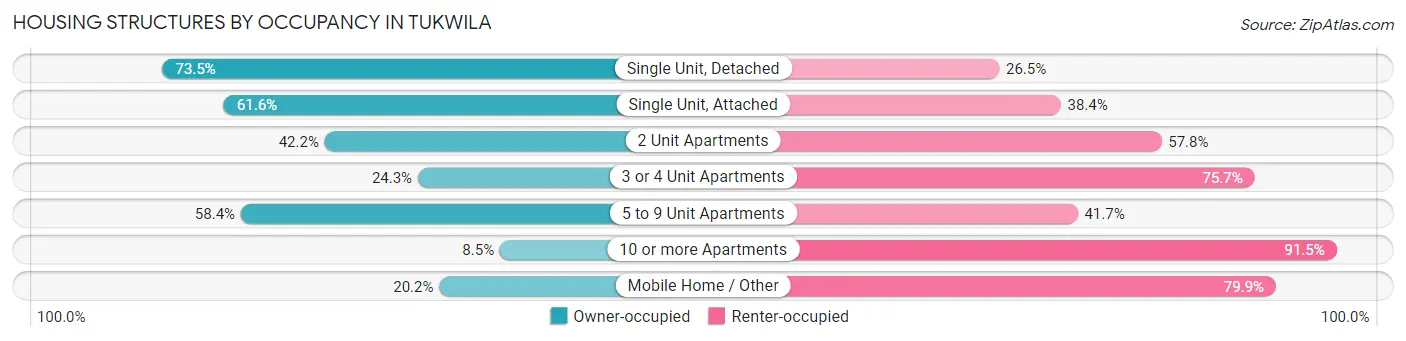
| Structure Type | Owner-occupied | Renter-occupied |
| Single Unit, Detached | 2,358 (73.5%) | 852 (26.5%) |
| Single Unit, Attached | 175 (61.6%) | 109 (38.4%) |
| 2 Unit Apartments | 103 (42.2%) | 141 (57.8%) |
| 3 or 4 Unit Apartments | 108 (24.3%) | 337 (75.7%) |
| 5 to 9 Unit Apartments | 402 (58.4%) | 287 (41.6%) |
| 10 or more Apartments | 262 (8.5%) | 2,830 (91.5%) |
| Mobile Home / Other | 27 (20.2%) | 107 (79.8%) |
| Total | 3,435 (42.4%) | 4,663 (57.6%) |
Housing Structures by Number of Rooms in Tukwila
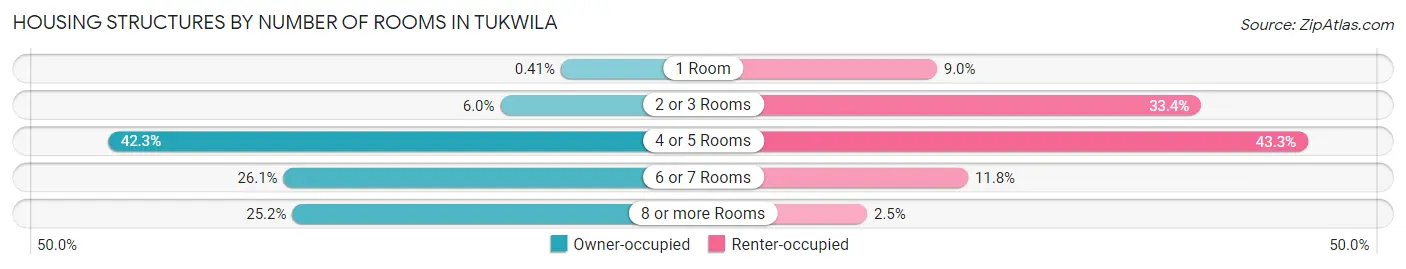
| Number of Rooms | Owner-occupied | Renter-occupied |
| 1 Room | 14 (0.4%) | 418 (9.0%) |
| 2 or 3 Rooms | 206 (6.0%) | 1,558 (33.4%) |
| 4 or 5 Rooms | 1,453 (42.3%) | 2,018 (43.3%) |
| 6 or 7 Rooms | 895 (26.1%) | 552 (11.8%) |
| 8 or more Rooms | 867 (25.2%) | 117 (2.5%) |
| Total | 3,435 (100.0%) | 4,663 (100.0%) |
Housing Structure by Heating Type in Tukwila
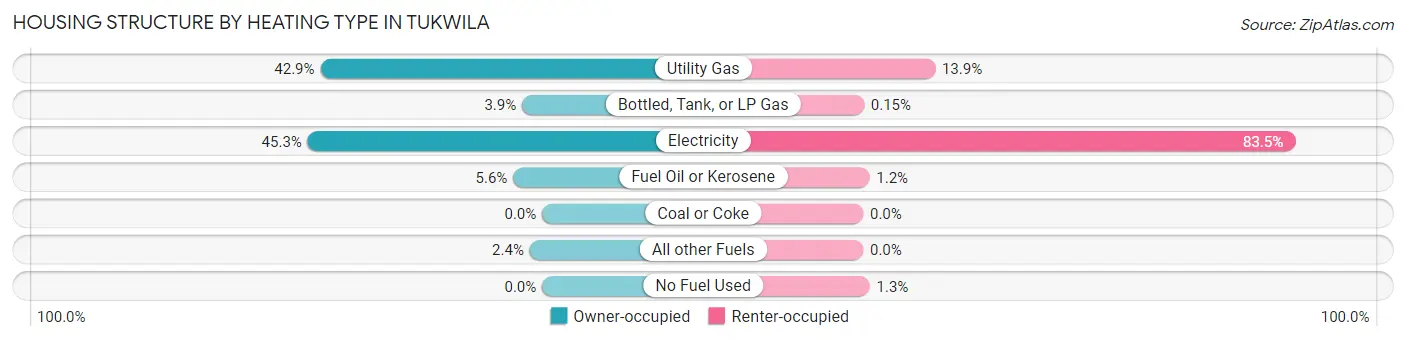
| Heating Type | Owner-occupied | Renter-occupied |
| Utility Gas | 1,472 (42.8%) | 648 (13.9%) |
| Bottled, Tank, or LP Gas | 133 (3.9%) | 7 (0.2%) |
| Electricity | 1,556 (45.3%) | 3,892 (83.5%) |
| Fuel Oil or Kerosene | 192 (5.6%) | 57 (1.2%) |
| Coal or Coke | 0 (0.0%) | 0 (0.0%) |
| All other Fuels | 82 (2.4%) | 0 (0.0%) |
| No Fuel Used | 0 (0.0%) | 59 (1.3%) |
| Total | 3,435 (100.0%) | 4,663 (100.0%) |
Household Vehicle Usage in Tukwila
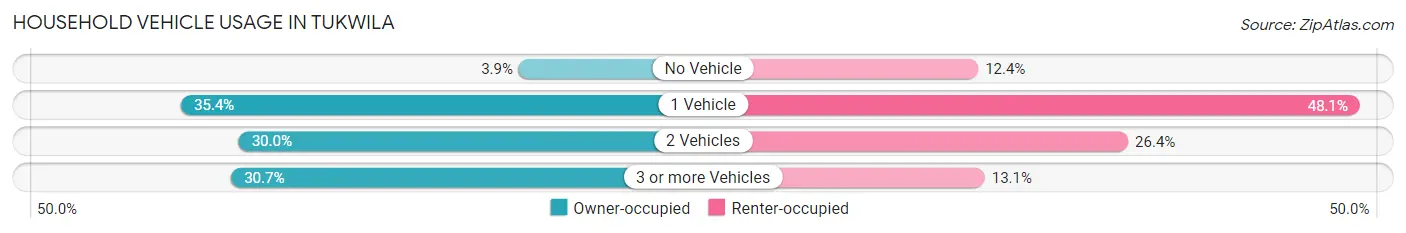
| Vehicles per Household | Owner-occupied | Renter-occupied |
| No Vehicle | 133 (3.9%) | 580 (12.4%) |
| 1 Vehicle | 1,216 (35.4%) | 2,241 (48.1%) |
| 2 Vehicles | 1,031 (30.0%) | 1,233 (26.4%) |
| 3 or more Vehicles | 1,055 (30.7%) | 609 (13.1%) |
| Total | 3,435 (100.0%) | 4,663 (100.0%) |
Real Estate & Mortgages in Tukwila
Real Estate and Mortgage Overview in Tukwila
| Characteristic | Without Mortgage | With Mortgage |
| Housing Units | 1,260 | 2,175 |
| Median Property Value | $386,800 | $461,400 |
| Median Household Income | $62,716 | $579 |
| Monthly Housing Costs | $811 | $415 |
| Real Estate Taxes | $4,066 | $60 |
Property Value by Mortgage Status in Tukwila
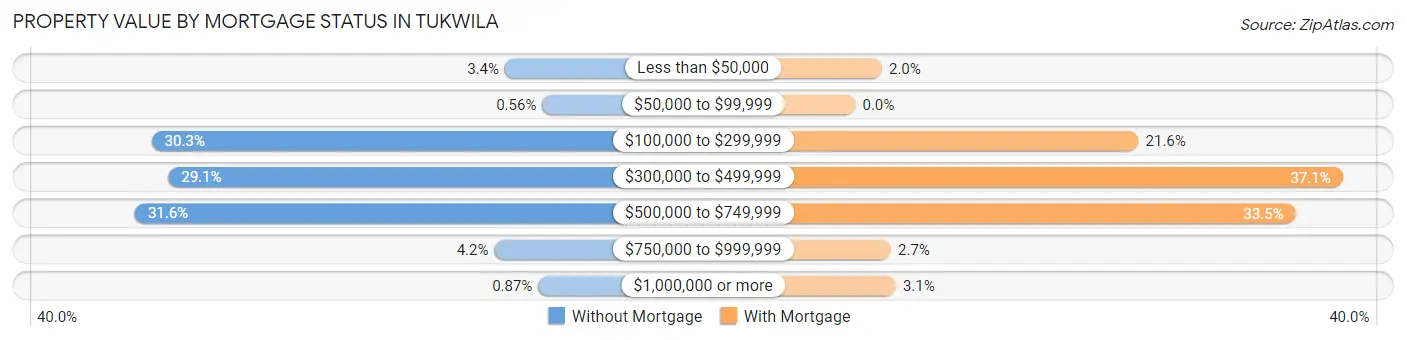
| Property Value | Without Mortgage | With Mortgage |
| Less than $50,000 | 43 (3.4%) | 44 (2.0%) |
| $50,000 to $99,999 | 7 (0.6%) | 0 (0.0%) |
| $100,000 to $299,999 | 382 (30.3%) | 469 (21.6%) |
| $300,000 to $499,999 | 366 (29.0%) | 807 (37.1%) |
| $500,000 to $749,999 | 398 (31.6%) | 729 (33.5%) |
| $750,000 to $999,999 | 53 (4.2%) | 59 (2.7%) |
| $1,000,000 or more | 11 (0.9%) | 67 (3.1%) |
| Total | 1,260 (100.0%) | 2,175 (100.0%) |
Household Income by Mortgage Status in Tukwila
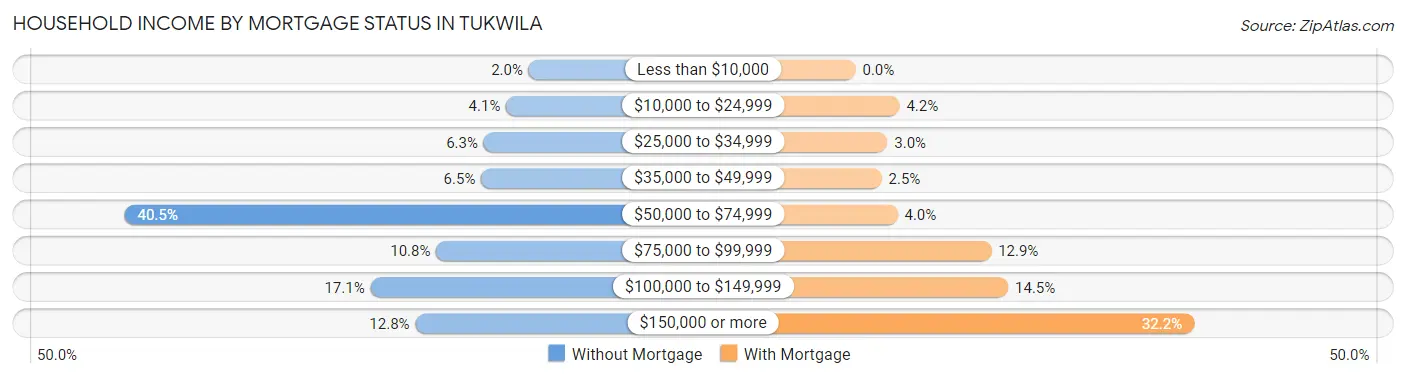
| Household Income | Without Mortgage | With Mortgage |
| Less than $10,000 | 25 (2.0%) | 0 (0.0%) |
| $10,000 to $24,999 | 52 (4.1%) | 91 (4.2%) |
| $25,000 to $34,999 | 79 (6.3%) | 66 (3.0%) |
| $35,000 to $49,999 | 82 (6.5%) | 54 (2.5%) |
| $50,000 to $74,999 | 510 (40.5%) | 87 (4.0%) |
| $75,000 to $99,999 | 136 (10.8%) | 281 (12.9%) |
| $100,000 to $149,999 | 215 (17.1%) | 316 (14.5%) |
| $150,000 or more | 161 (12.8%) | 701 (32.2%) |
| Total | 1,260 (100.0%) | 2,175 (100.0%) |
Property Value to Household Income Ratio in Tukwila
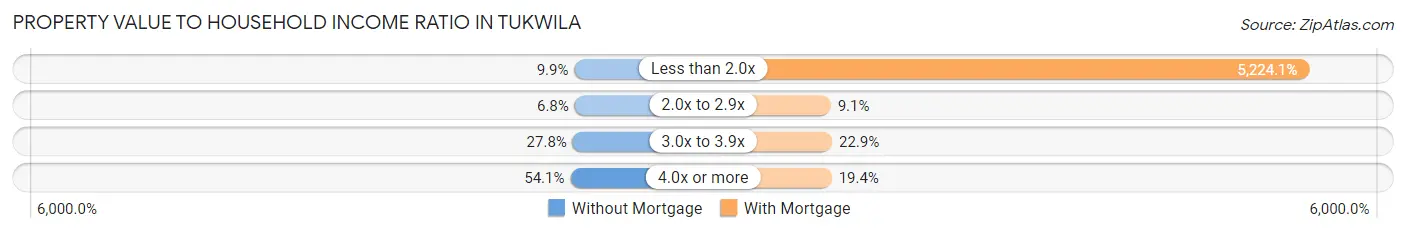
| Value-to-Income Ratio | Without Mortgage | With Mortgage |
| Less than 2.0x | 125 (9.9%) | 113,625 (5,224.1%) |
| 2.0x to 2.9x | 86 (6.8%) | 197 (9.1%) |
| 3.0x to 3.9x | 350 (27.8%) | 497 (22.9%) |
| 4.0x or more | 681 (54.0%) | 422 (19.4%) |
| Total | 1,260 (100.0%) | 2,175 (100.0%) |
Real Estate Taxes by Mortgage Status in Tukwila
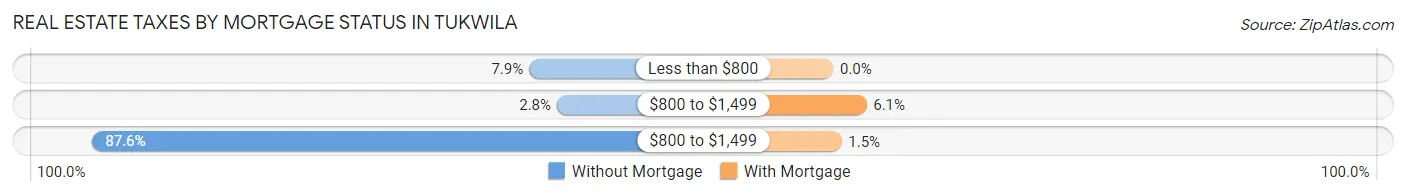
| Property Taxes | Without Mortgage | With Mortgage |
| Less than $800 | 99 (7.9%) | 0 (0.0%) |
| $800 to $1,499 | 35 (2.8%) | 132 (6.1%) |
| $800 to $1,499 | 1,104 (87.6%) | 33 (1.5%) |
| Total | 1,260 (100.0%) | 2,175 (100.0%) |
Health & Disability in Tukwila
Health Insurance Coverage by Age in Tukwila
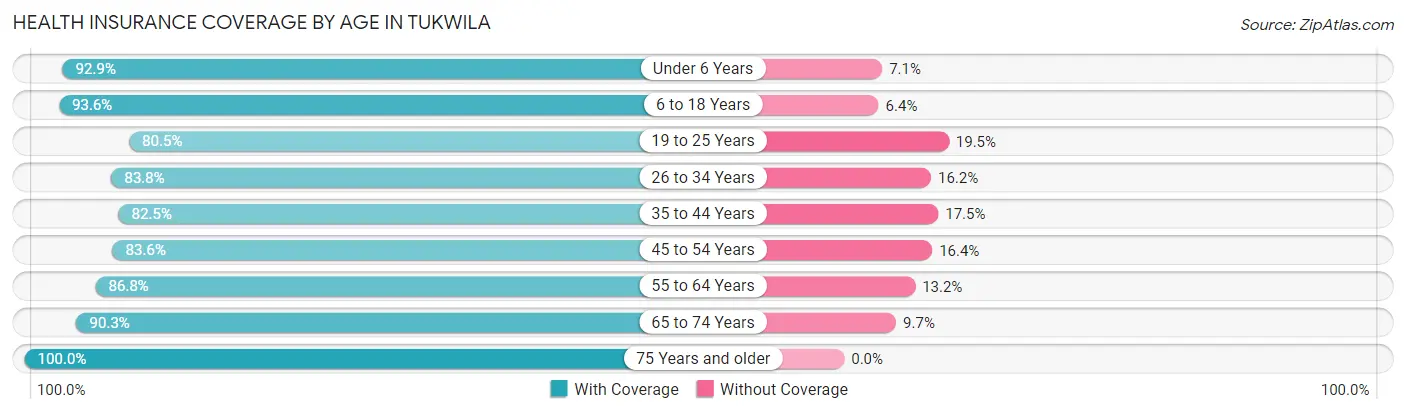
| Age Bracket | With Coverage | Without Coverage |
| Under 6 Years | 1,130 (92.9%) | 86 (7.1%) |
| 6 to 18 Years | 2,773 (93.6%) | 190 (6.4%) |
| 19 to 25 Years | 1,759 (80.5%) | 426 (19.5%) |
| 26 to 34 Years | 3,289 (83.8%) | 635 (16.2%) |
| 35 to 44 Years | 2,850 (82.5%) | 606 (17.5%) |
| 45 to 54 Years | 2,408 (83.6%) | 472 (16.4%) |
| 55 to 64 Years | 2,114 (86.8%) | 322 (13.2%) |
| 65 to 74 Years | 1,214 (90.3%) | 130 (9.7%) |
| 75 Years and older | 937 (100.0%) | 0 (0.0%) |
| Total | 18,474 (86.6%) | 2,867 (13.4%) |
Health Insurance Coverage by Citizenship Status in Tukwila
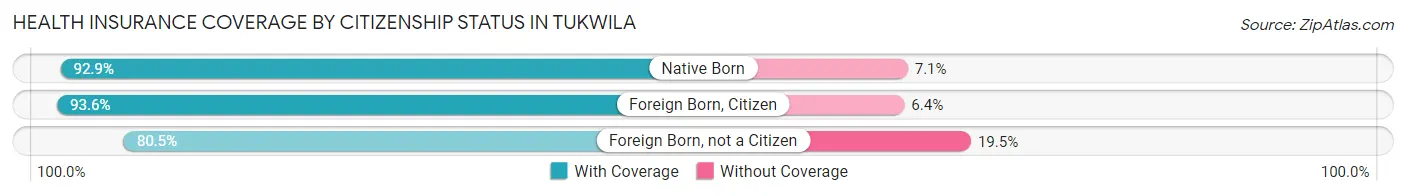
| Citizenship Status | With Coverage | Without Coverage |
| Native Born | 1,130 (92.9%) | 86 (7.1%) |
| Foreign Born, Citizen | 2,773 (93.6%) | 190 (6.4%) |
| Foreign Born, not a Citizen | 1,759 (80.5%) | 426 (19.5%) |
Health Insurance Coverage by Household Income in Tukwila
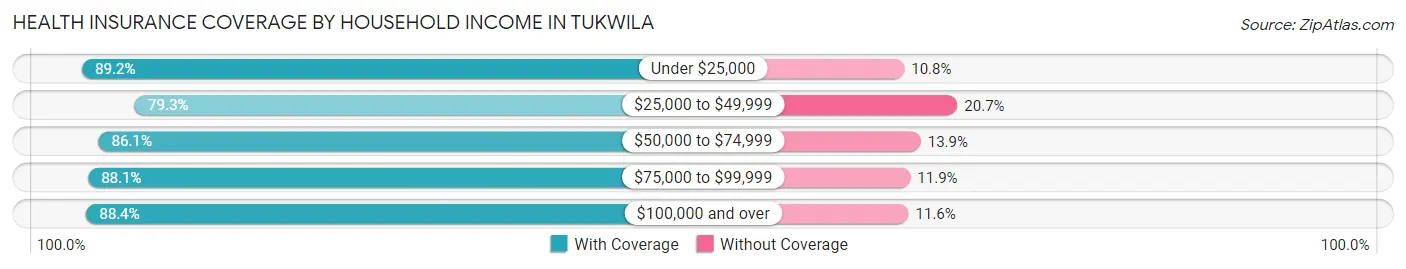
| Household Income | With Coverage | Without Coverage |
| Under $25,000 | 1,192 (89.2%) | 144 (10.8%) |
| $25,000 to $49,999 | 2,712 (79.3%) | 709 (20.7%) |
| $50,000 to $74,999 | 3,237 (86.1%) | 521 (13.9%) |
| $75,000 to $99,999 | 2,764 (88.1%) | 374 (11.9%) |
| $100,000 and over | 8,541 (88.4%) | 1,119 (11.6%) |
Public vs Private Health Insurance Coverage by Age in Tukwila
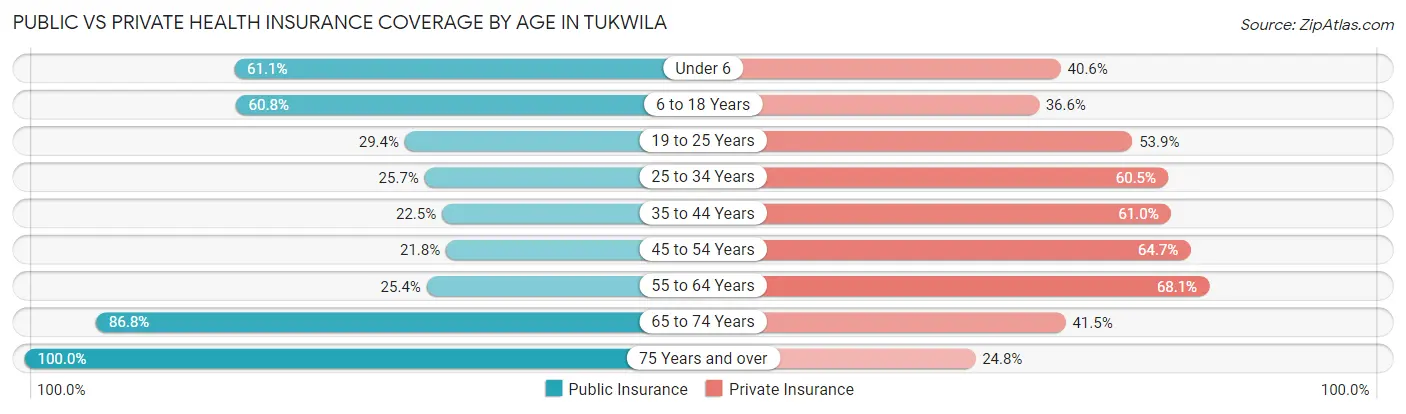
| Age Bracket | Public Insurance | Private Insurance |
| Under 6 | 743 (61.1%) | 494 (40.6%) |
| 6 to 18 Years | 1,802 (60.8%) | 1,083 (36.5%) |
| 19 to 25 Years | 643 (29.4%) | 1,178 (53.9%) |
| 25 to 34 Years | 1,010 (25.7%) | 2,375 (60.5%) |
| 35 to 44 Years | 778 (22.5%) | 2,108 (61.0%) |
| 45 to 54 Years | 627 (21.8%) | 1,862 (64.6%) |
| 55 to 64 Years | 618 (25.4%) | 1,660 (68.1%) |
| 65 to 74 Years | 1,166 (86.8%) | 558 (41.5%) |
| 75 Years and over | 937 (100.0%) | 232 (24.8%) |
| Total | 8,324 (39.0%) | 11,550 (54.1%) |
Disability Status by Sex by Age in Tukwila
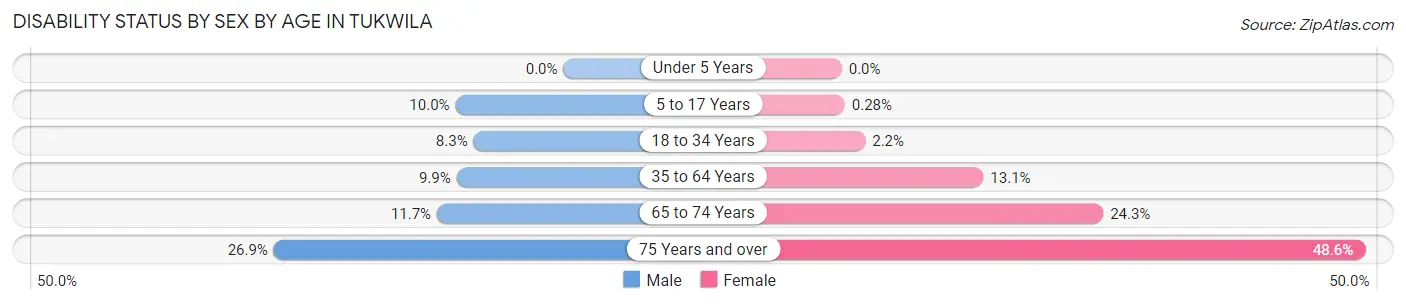
| Age Bracket | Male | Female |
| Under 5 Years | 0 (0.0%) | 0 (0.0%) |
| 5 to 17 Years | 111 (10.0%) | 5 (0.3%) |
| 18 to 34 Years | 289 (8.3%) | 64 (2.2%) |
| 35 to 64 Years | 500 (9.9%) | 490 (13.1%) |
| 65 to 74 Years | 74 (11.7%) | 173 (24.3%) |
| 75 Years and over | 150 (26.9%) | 184 (48.5%) |
Disability Class by Sex by Age in Tukwila
Disability Class: Hearing Difficulty
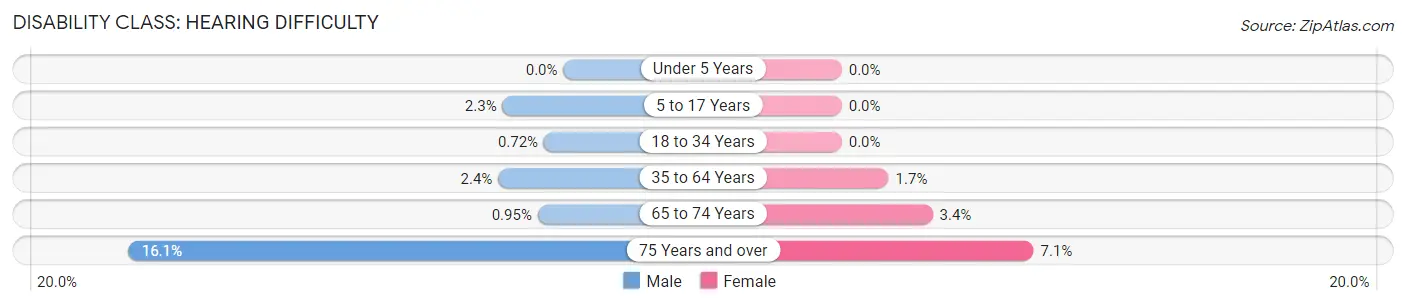
| Age Bracket | Male | Female |
| Under 5 Years | 0 (0.0%) | 0 (0.0%) |
| 5 to 17 Years | 25 (2.3%) | 0 (0.0%) |
| 18 to 34 Years | 25 (0.7%) | 0 (0.0%) |
| 35 to 64 Years | 122 (2.4%) | 65 (1.7%) |
| 65 to 74 Years | 6 (0.9%) | 24 (3.4%) |
| 75 Years and over | 90 (16.1%) | 27 (7.1%) |
Disability Class: Vision Difficulty
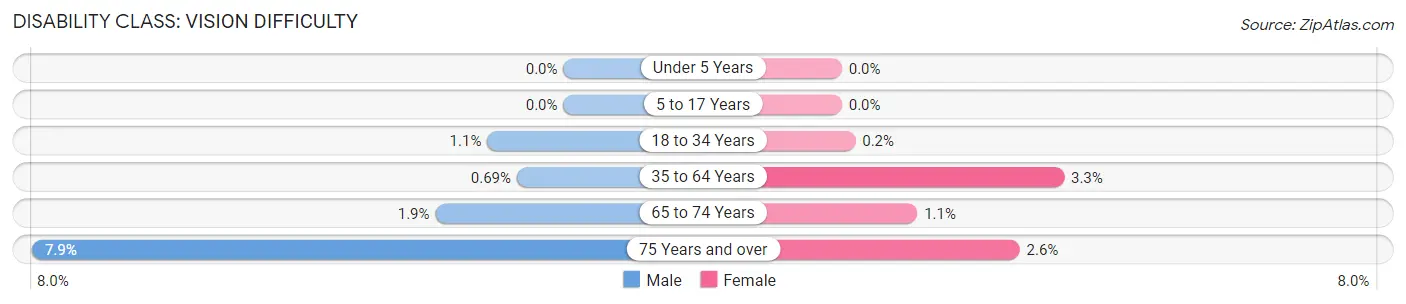
| Age Bracket | Male | Female |
| Under 5 Years | 0 (0.0%) | 0 (0.0%) |
| 5 to 17 Years | 0 (0.0%) | 0 (0.0%) |
| 18 to 34 Years | 39 (1.1%) | 6 (0.2%) |
| 35 to 64 Years | 35 (0.7%) | 123 (3.3%) |
| 65 to 74 Years | 12 (1.9%) | 8 (1.1%) |
| 75 Years and over | 44 (7.9%) | 10 (2.6%) |
Disability Class: Cognitive Difficulty
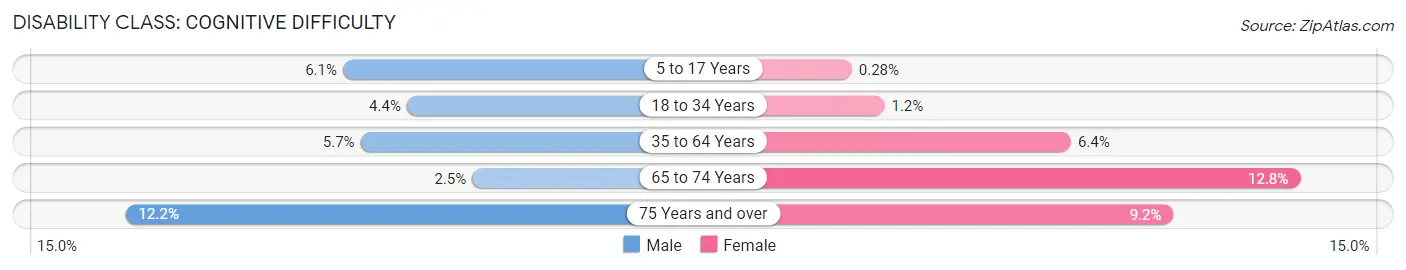
| Age Bracket | Male | Female |
| 5 to 17 Years | 68 (6.1%) | 5 (0.3%) |
| 18 to 34 Years | 151 (4.4%) | 35 (1.2%) |
| 35 to 64 Years | 285 (5.7%) | 238 (6.4%) |
| 65 to 74 Years | 16 (2.5%) | 91 (12.8%) |
| 75 Years and over | 68 (12.2%) | 35 (9.2%) |
Disability Class: Ambulatory Difficulty
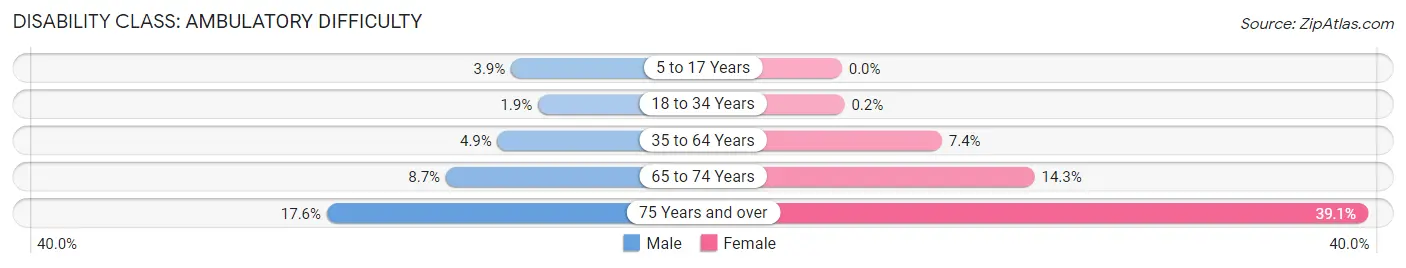
| Age Bracket | Male | Female |
| 5 to 17 Years | 43 (3.9%) | 0 (0.0%) |
| 18 to 34 Years | 65 (1.9%) | 6 (0.2%) |
| 35 to 64 Years | 246 (4.9%) | 277 (7.4%) |
| 65 to 74 Years | 55 (8.7%) | 102 (14.3%) |
| 75 Years and over | 98 (17.6%) | 148 (39.1%) |
Disability Class: Self-Care Difficulty
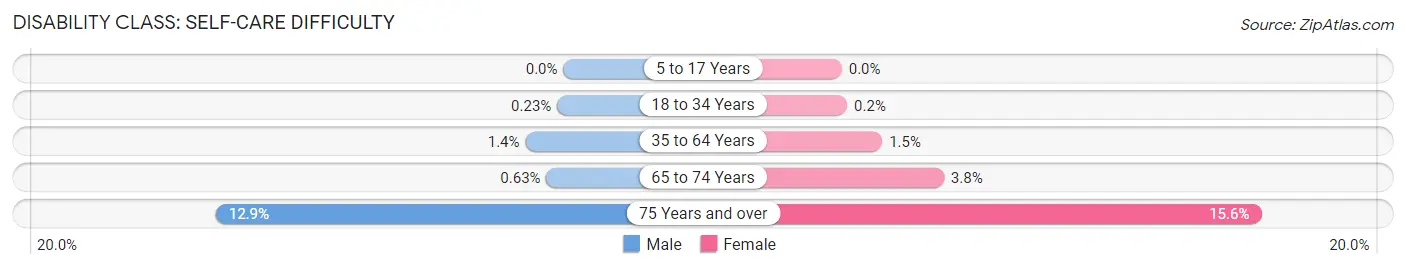
| Age Bracket | Male | Female |
| 5 to 17 Years | 0 (0.0%) | 0 (0.0%) |
| 18 to 34 Years | 8 (0.2%) | 6 (0.2%) |
| 35 to 64 Years | 71 (1.4%) | 56 (1.5%) |
| 65 to 74 Years | 4 (0.6%) | 27 (3.8%) |
| 75 Years and over | 72 (12.9%) | 59 (15.6%) |
Technology Access in Tukwila
Computing Device Access in Tukwila
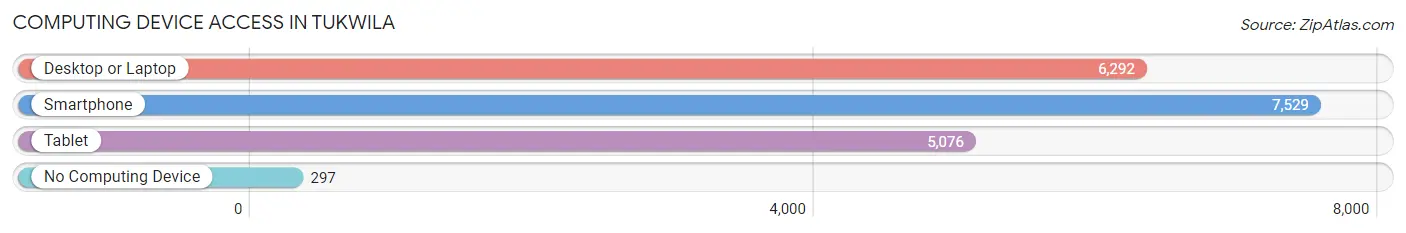
| Device Type | # Households | % Households |
| Desktop or Laptop | 6,292 | 77.7% |
| Smartphone | 7,529 | 93.0% |
| Tablet | 5,076 | 62.7% |
| No Computing Device | 297 | 3.7% |
| Total | 8,098 | 100.0% |
Internet Access in Tukwila
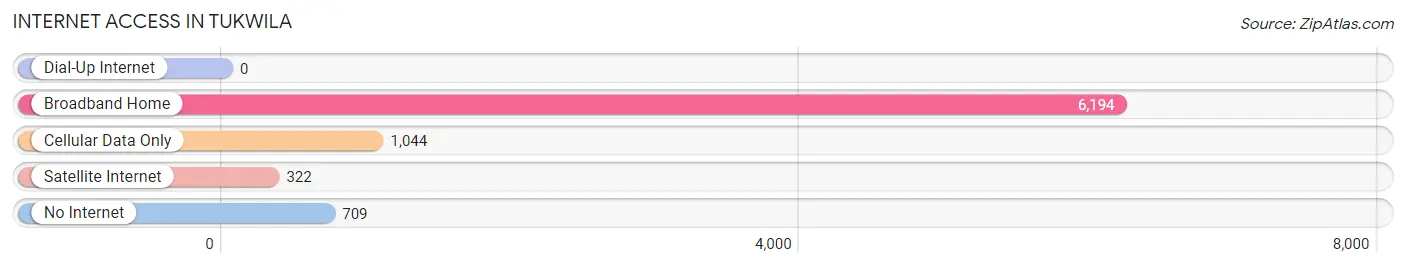
| Internet Type | # Households | % Households |
| Dial-Up Internet | 0 | 0.0% |
| Broadband Home | 6,194 | 76.5% |
| Cellular Data Only | 1,044 | 12.9% |
| Satellite Internet | 322 | 4.0% |
| No Internet | 709 | 8.8% |
| Total | 8,098 | 100.0% |
Tukwila Summary
Tukwila is a city located in King County, Washington, United States. It is situated along the Duwamish River, just south of Seattle. As of the 2010 census, the city had a population of 19,107.
History
The area now known as Tukwila was originally inhabited by the Duwamish people, who had lived in the area for thousands of years. The first European settlers arrived in the area in the mid-1800s, and the area was officially incorporated as a city in 1908.
The city was named after Chief Tukwila, a leader of the Duwamish people. The city was originally a small farming community, but it began to grow rapidly in the 1950s and 1960s as Seattle's population expanded.
Geography
Tukwila is located in King County, Washington, just south of Seattle. It is situated along the Duwamish River, and is bordered by the cities of SeaTac to the north, Renton to the east, and Burien to the south.
The city has a total area of 8.3 square miles, of which 8.2 square miles is land and 0.1 square miles is water. The city is located at an elevation of approximately 200 feet above sea level.
Economy
Tukwila is home to a variety of businesses, including retail stores, restaurants, and manufacturing companies. The city is also home to the headquarters of several major companies, including Boeing, Starbucks, and Amazon.
The city's economy is largely driven by the retail and service industries. The city is home to several major shopping centers, including Southcenter Mall, which is one of the largest malls in the Pacific Northwest.
Demographics
As of the 2010 census, the city had a population of 19,107. The racial makeup of the city was 57.2% White, 16.2% African American, 11.2% Asian, 8.2% Hispanic or Latino, and 7.2% from other races.
The median household income in the city was $50,945, and the median family income was $60,945. The per capita income in the city was $25,945.
Conclusion
Tukwila is a city located in King County, Washington, United States. It is situated along the Duwamish River, just south of Seattle. As of the 2010 census, the city had a population of 19,107. The city was originally inhabited by the Duwamish people, and was officially incorporated as a city in 1908. The city's economy is largely driven by the retail and service industries, and it is home to several major companies, including Boeing, Starbucks, and Amazon. The racial makeup of the city was 57.2% White, 16.2% African American, 11.2% Asian, 8.2% Hispanic or Latino, and 7.2% from other races. The median household income in the city was $50,945, and the median family income was $60,945.
Common Questions
What is Per Capita Income in Tukwila?
Per Capita income in Tukwila is $36,258.
What is the Median Family Income in Tukwila?
Median Family Income in Tukwila is $85,457.
What is the Median Household income in Tukwila?
Median Household Income in Tukwila is $76,331.
What is Income or Wage Gap in Tukwila?
Income or Wage Gap in Tukwila is 7.5%.
Women in Tukwila earn 92.5 cents for every dollar earned by a man.
What is Inequality or Gini Index in Tukwila?
Inequality or Gini Index in Tukwila is 0.39.
What is the Total Population of Tukwila?
Total Population of Tukwila is 21,569.
What is the Total Male Population of Tukwila?
Total Male Population of Tukwila is 11,662.
What is the Total Female Population of Tukwila?
Total Female Population of Tukwila is 9,907.
What is the Ratio of Males per 100 Females in Tukwila?
There are 117.71 Males per 100 Females in Tukwila.
What is the Ratio of Females per 100 Males in Tukwila?
There are 84.95 Females per 100 Males in Tukwila.
What is the Median Population Age in Tukwila?
Median Population Age in Tukwila is 36.0 Years.
What is the Average Family Size in Tukwila
Average Family Size in Tukwila is 3.3 People.
What is the Average Household Size in Tukwila
Average Household Size in Tukwila is 2.6 People.
How Large is the Labor Force in Tukwila?
There are 13,098 People in the Labor Forcein in Tukwila.
What is the Percentage of People in the Labor Force in Tukwila?
72.7% of People are in the Labor Force in Tukwila.
What is the Unemployment Rate in Tukwila?
Unemployment Rate in Tukwila is 6.2%.