Cities with the Most Immigrants from Burma / Myanmar in Washington
RELATED REPORTS & OPTIONS
Burma / Myanmar
Washington
Compare Cities
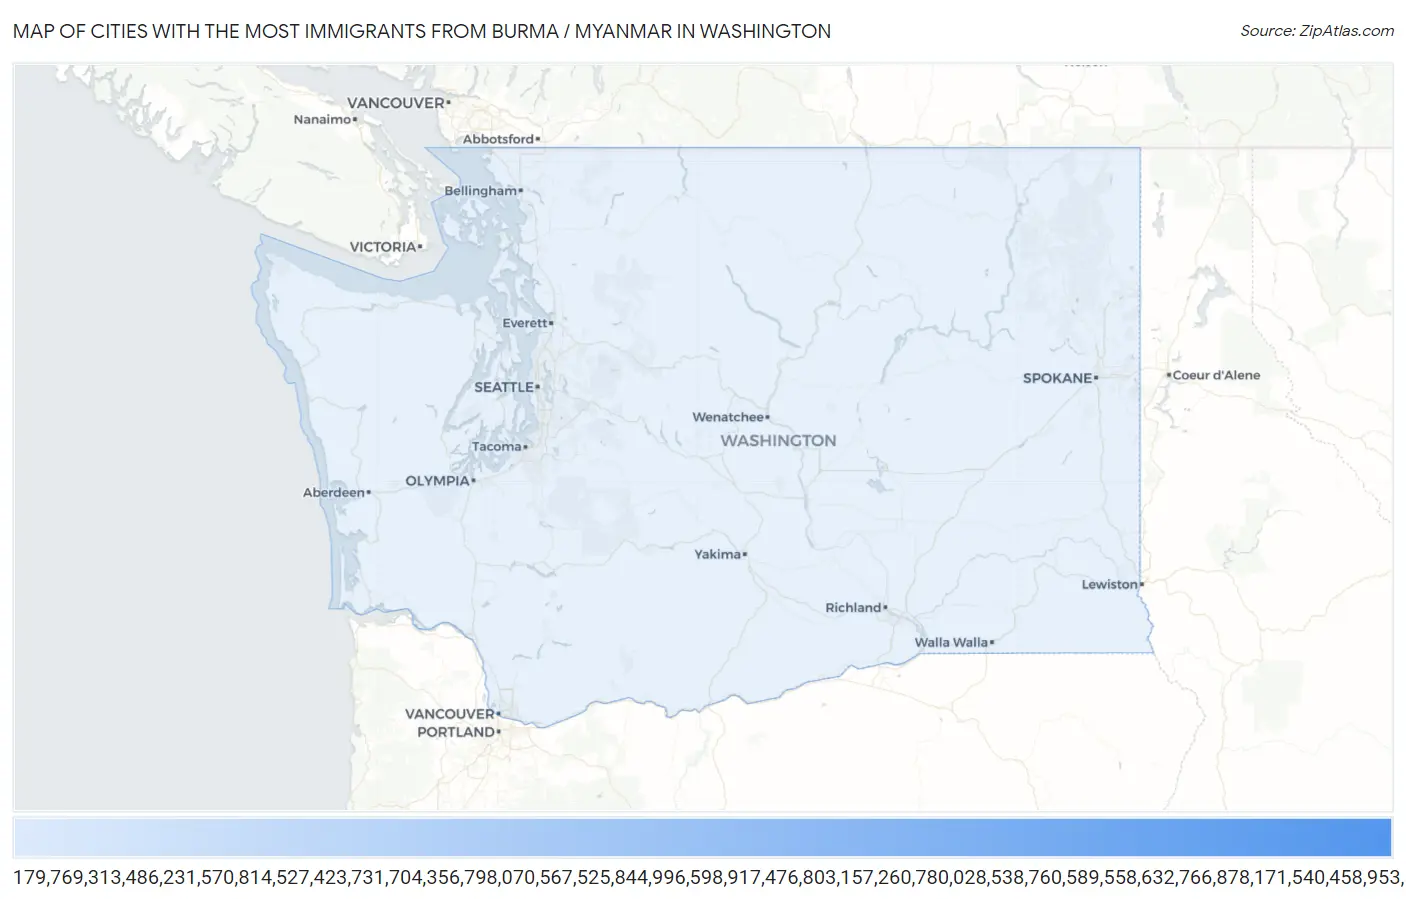
Map of Cities with the Most Immigrants from Burma / Myanmar in Washington
0
1,000
Cities with the Most Immigrants from Burma / Myanmar in Washington
| City | Burma / Myanmar | vs State | vs National | |
| 1. | Kent | 947 | 3,171(29.86%)#-1 | 157,000(0.60%)#0 |
| 2. | Tukwila | 373 | 3,171(11.76%)#0 | 157,000(0.24%)#1 |
| 3. | Spokane | 267 | 3,171(8.42%)#1 | 157,000(0.17%)#2 |
| 4. | Seatac | 216 | 3,171(6.81%)#2 | 157,000(0.14%)#3 |
| 5. | Pasco | 187 | 3,171(5.90%)#3 | 157,000(0.12%)#4 |
| 6. | Kennewick | 124 | 3,171(3.91%)#4 | 157,000(0.08%)#5 |
| 7. | Tacoma | 94 | 3,171(2.96%)#5 | 157,000(0.06%)#6 |
| 8. | Bellevue | 94 | 3,171(2.96%)#6 | 157,000(0.06%)#7 |
| 9. | Selah | 61 | 3,171(1.92%)#7 | 157,000(0.04%)#8 |
| 10. | Fairwood Cdp Spokane County | 59 | 3,171(1.86%)#8 | 157,000(0.04%)#9 |
| 11. | Vancouver | 58 | 3,171(1.83%)#9 | 157,000(0.04%)#10 |
| 12. | Quincy | 56 | 3,171(1.77%)#10 | 157,000(0.04%)#11 |
| 13. | Seattle | 50 | 3,171(1.58%)#11 | 157,000(0.03%)#12 |
| 14. | Camas | 49 | 3,171(1.55%)#12 | 157,000(0.03%)#13 |
| 15. | Shoreline | 43 | 3,171(1.36%)#13 | 157,000(0.03%)#14 |
| 16. | Everett | 42 | 3,171(1.32%)#14 | 157,000(0.03%)#15 |
| 17. | Federal Way | 36 | 3,171(1.14%)#15 | 157,000(0.02%)#16 |
| 18. | Mukilteo | 33 | 3,171(1.04%)#16 | 157,000(0.02%)#17 |
| 19. | Alderwood Manor | 33 | 3,171(1.04%)#17 | 157,000(0.02%)#18 |
| 20. | Auburn | 32 | 3,171(1.01%)#18 | 157,000(0.02%)#19 |
| 21. | North Lynnwood | 32 | 3,171(1.01%)#19 | 157,000(0.02%)#20 |
| 22. | Black Diamond | 29 | 3,171(0.91%)#20 | 157,000(0.02%)#21 |
| 23. | South Hill | 27 | 3,171(0.85%)#21 | 157,000(0.02%)#22 |
| 24. | Peaceful Valley | 27 | 3,171(0.85%)#22 | 157,000(0.02%)#23 |
| 25. | Bellingham | 25 | 3,171(0.79%)#23 | 157,000(0.02%)#24 |
| 26. | Fort Lewis | 19 | 3,171(0.60%)#24 | 157,000(0.01%)#25 |
| 27. | Picnic Point | 18 | 3,171(0.57%)#25 | 157,000(0.01%)#26 |
| 28. | Winlock | 18 | 3,171(0.57%)#26 | 157,000(0.01%)#27 |
| 29. | Hockinson | 14 | 3,171(0.44%)#27 | 157,000(0.01%)#28 |
| 30. | Burien | 12 | 3,171(0.38%)#28 | 157,000(0.01%)#29 |
| 31. | Pullman | 11 | 3,171(0.35%)#29 | 157,000(0.01%)#30 |
| 32. | Kirkland | 10 | 3,171(0.32%)#30 | 157,000(0.01%)#31 |
| 33. | Wilderness Rim | 10 | 3,171(0.32%)#31 | 157,000(0.01%)#32 |
| 34. | Camano | 6 | 3,171(0.19%)#32 | 157,000(0.00%)#33 |
| 35. | Fairwood Cdp King County | 4 | 3,171(0.13%)#33 | 157,000(0.00%)#34 |
| 36. | Lakewood | 2 | 3,171(0.06%)#34 | 157,000(0.00%)#35 |
Common Questions
What are the Top 10 Cities with the Most Immigrants from Burma / Myanmar in Washington?
Top 10 Cities with the Most Immigrants from Burma / Myanmar in Washington are:
What city has the Most Immigrants from Burma / Myanmar in Washington?
Kent has the Most Immigrants from Burma / Myanmar in Washington with 947.
What is the Total Immigrants from Burma / Myanmar in the State of Washington?
Total Immigrants from Burma / Myanmar in Washington is 3,171.
What is the Total Immigrants from Burma / Myanmar in the United States?
Total Immigrants from Burma / Myanmar in the United States is 157,000.