Town and Country, WA Map & Demographics
Town and Country Map
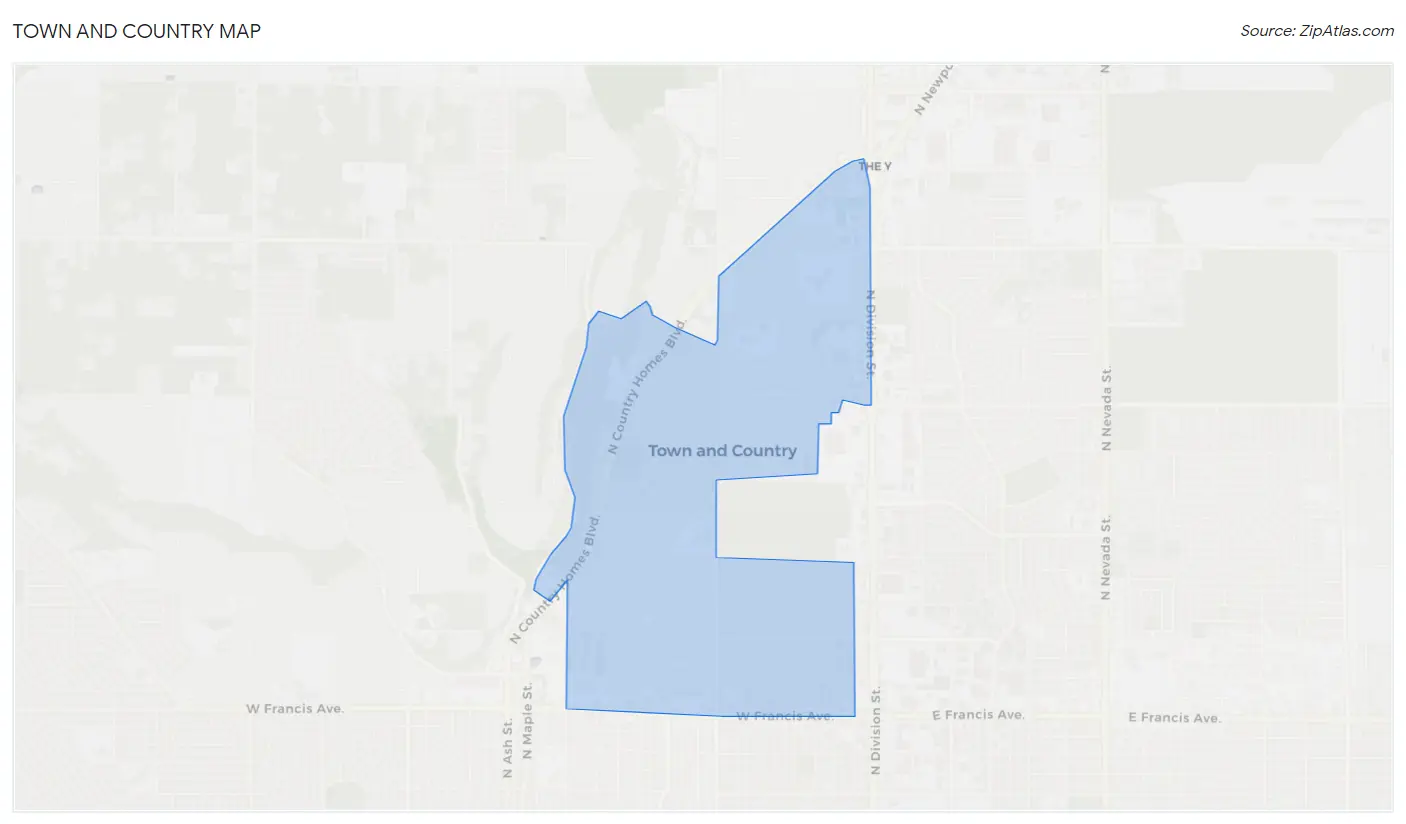
Town and Country Overview
$36,455
PER CAPITA INCOME
$92,136
AVG FAMILY INCOME
$85,778
AVG HOUSEHOLD INCOME
21.3%
WAGE / INCOME GAP [ % ]
78.7¢/ $1
WAGE / INCOME GAP [ $ ]
0.39
INEQUALITY / GINI INDEX
5,243
TOTAL POPULATION
2,612
MALE POPULATION
2,631
FEMALE POPULATION
99.28
MALES / 100 FEMALES
100.73
FEMALES / 100 MALES
41.3
MEDIAN AGE
3.1
AVG FAMILY SIZE
2.6
AVG HOUSEHOLD SIZE
2,881
LABOR FORCE [ PEOPLE ]
66.9%
PERCENT IN LABOR FORCE
9.2%
UNEMPLOYMENT RATE
Income in Town and Country
Income Overview in Town and Country
Per Capita Income in Town and Country is $36,455, while median incomes of families and households are $92,136 and $85,778 respectively.
| Characteristic | Number | Measure |
| Per Capita Income | 5,243 | $36,455 |
| Median Family Income | 1,336 | $92,136 |
| Mean Family Income | 1,336 | $103,168 |
| Median Household Income | 2,047 | $85,778 |
| Mean Household Income | 2,047 | $89,537 |
| Income Deficit | 1,336 | $0 |
| Wage / Income Gap (%) | 5,243 | 21.33% |
| Wage / Income Gap ($) | 5,243 | 78.67¢ per $1 |
| Gini / Inequality Index | 5,243 | 0.39 |
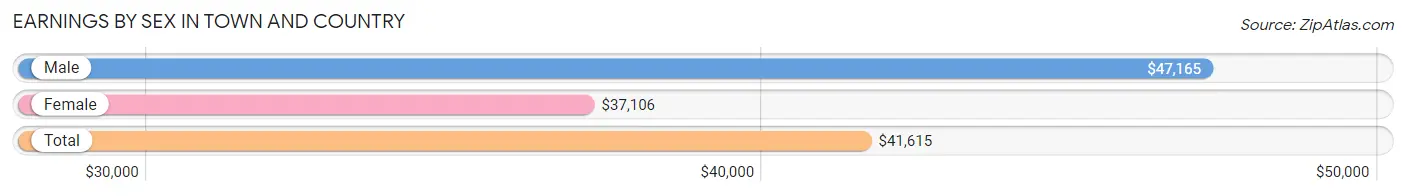
Earnings by Sex in Town and Country
Average Earnings in Town and Country are $41,615, $47,165 for men and $37,106 for women, a difference of 21.3%.
| Sex | Number | Average Earnings |
| Male | 1,603 (55.8%) | $47,165 |
| Female | 1,267 (44.2%) | $37,106 |
| Total | 2,870 (100.0%) | $41,615 |
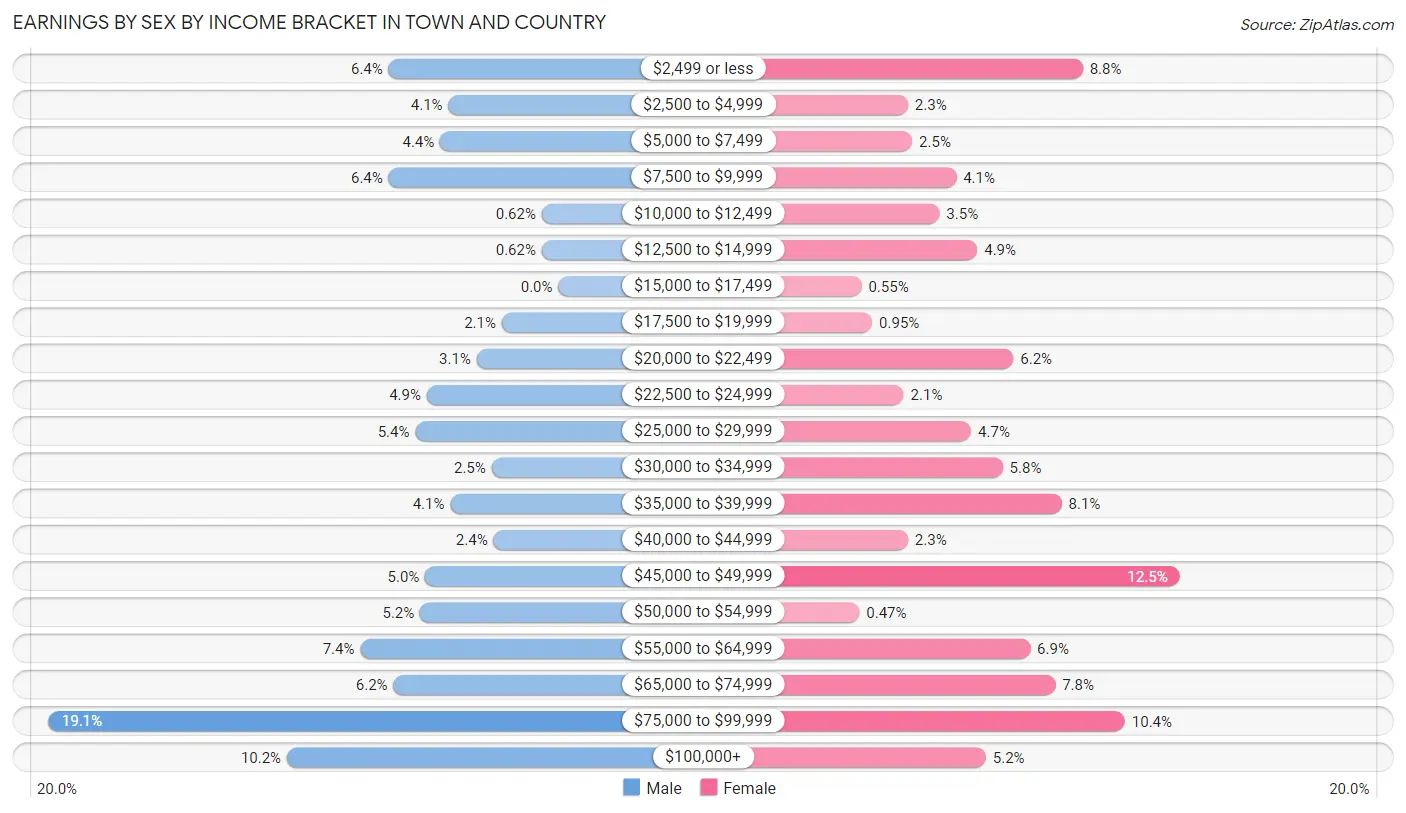
Earnings by Sex by Income Bracket in Town and Country
The most common earnings brackets in Town and Country are $75,000 to $99,999 for men (306 | 19.1%) and $45,000 to $49,999 for women (158 | 12.5%).
| Income | Male | Female |
| $2,499 or less | 102 (6.4%) | 112 (8.8%) |
| $2,500 to $4,999 | 66 (4.1%) | 29 (2.3%) |
| $5,000 to $7,499 | 71 (4.4%) | 31 (2.5%) |
| $7,500 to $9,999 | 102 (6.4%) | 52 (4.1%) |
| $10,000 to $12,499 | 10 (0.6%) | 44 (3.5%) |
| $12,500 to $14,999 | 10 (0.6%) | 62 (4.9%) |
| $15,000 to $17,499 | 0 (0.0%) | 7 (0.5%) |
| $17,500 to $19,999 | 34 (2.1%) | 12 (0.9%) |
| $20,000 to $22,499 | 49 (3.1%) | 79 (6.2%) |
| $22,500 to $24,999 | 79 (4.9%) | 27 (2.1%) |
| $25,000 to $29,999 | 86 (5.4%) | 59 (4.7%) |
| $30,000 to $34,999 | 40 (2.5%) | 74 (5.8%) |
| $35,000 to $39,999 | 65 (4.1%) | 102 (8.1%) |
| $40,000 to $44,999 | 39 (2.4%) | 29 (2.3%) |
| $45,000 to $49,999 | 80 (5.0%) | 158 (12.5%) |
| $50,000 to $54,999 | 83 (5.2%) | 6 (0.5%) |
| $55,000 to $64,999 | 119 (7.4%) | 87 (6.9%) |
| $65,000 to $74,999 | 99 (6.2%) | 99 (7.8%) |
| $75,000 to $99,999 | 306 (19.1%) | 132 (10.4%) |
| $100,000+ | 163 (10.2%) | 66 (5.2%) |
| Total | 1,603 (100.0%) | 1,267 (100.0%) |
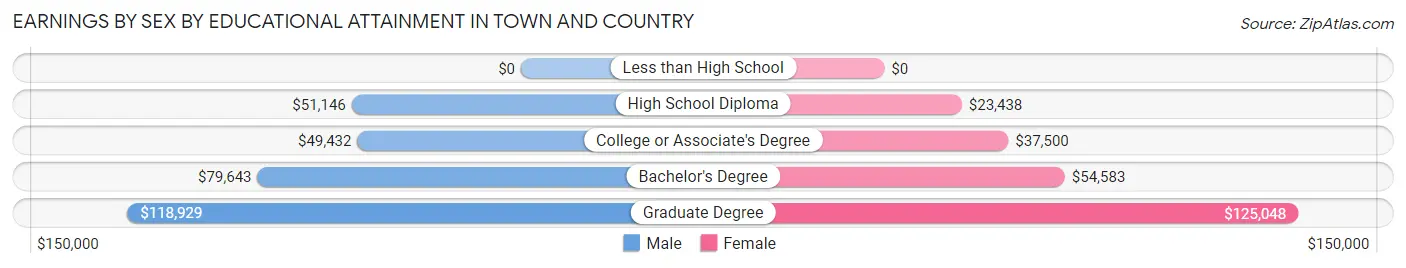
Earnings by Sex by Educational Attainment in Town and Country
Average earnings in Town and Country are $56,467 for men and $39,401 for women, a difference of 30.2%. Men with an educational attainment of graduate degree enjoy the highest average annual earnings of $118,929, while those with college or associate's degree education earn the least with $49,432. Women with an educational attainment of graduate degree earn the most with the average annual earnings of $125,048, while those with high school diploma education have the smallest earnings of $23,438.
| Educational Attainment | Male Income | Female Income |
| Less than High School | - | - |
| High School Diploma | $51,146 | $23,438 |
| College or Associate's Degree | $49,432 | $37,500 |
| Bachelor's Degree | $79,643 | $54,583 |
| Graduate Degree | $118,929 | $125,048 |
| Total | $56,467 | $39,401 |
Family Income in Town and Country
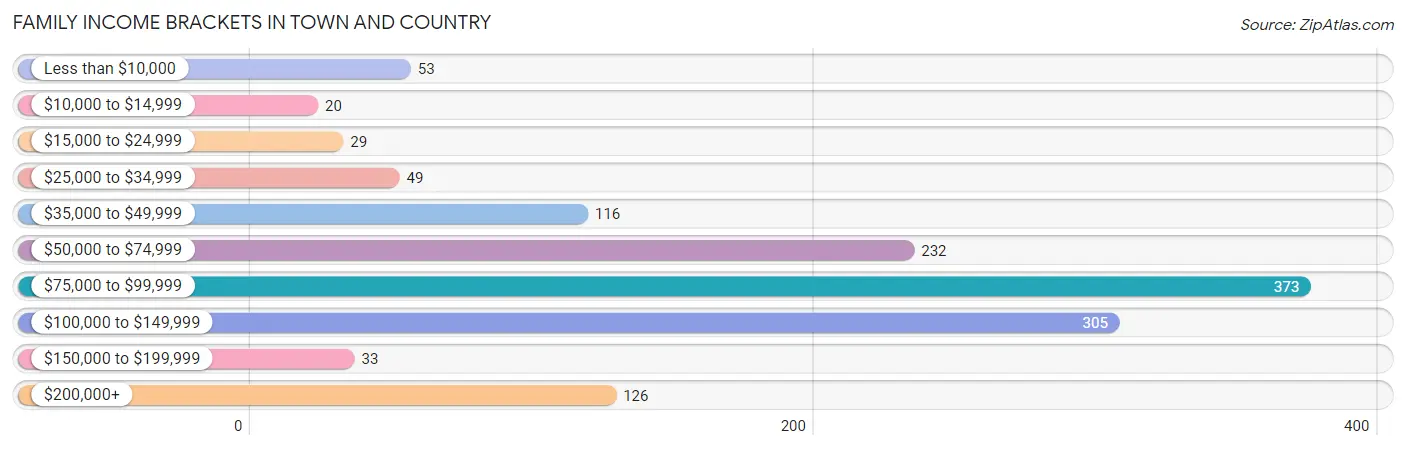
Family Income Brackets in Town and Country
According to the Town and Country family income data, there are 373 families falling into the $75,000 to $99,999 income range, which is the most common income bracket and makes up 27.9% of all families. Conversely, the $10,000 to $14,999 income bracket is the least frequent group with only 20 families (1.5%) belonging to this category.
| Income Bracket | # Families | % Families |
| Less than $10,000 | 53 | 4.0% |
| $10,000 to $14,999 | 20 | 1.5% |
| $15,000 to $24,999 | 29 | 2.2% |
| $25,000 to $34,999 | 49 | 3.7% |
| $35,000 to $49,999 | 116 | 8.7% |
| $50,000 to $74,999 | 232 | 17.4% |
| $75,000 to $99,999 | 373 | 27.9% |
| $100,000 to $149,999 | 305 | 22.8% |
| $150,000 to $199,999 | 33 | 2.5% |
| $200,000+ | 126 | 9.4% |
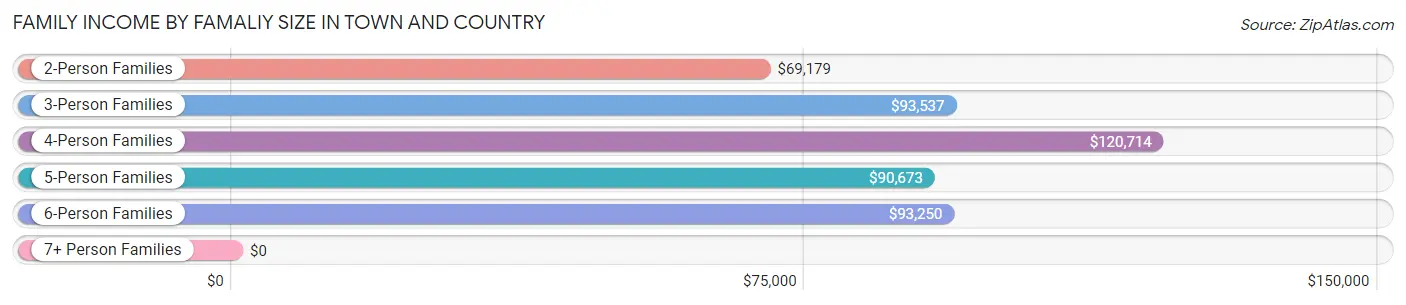
Family Income by Famaliy Size in Town and Country
4-person families (182 | 13.6%) account for the highest median family income in Town and Country with $120,714 per family, while 2-person families (605 | 45.3%) have the highest median income of $34,590 per family member.
| Income Bracket | # Families | Median Income |
| 2-Person Families | 605 (45.3%) | $69,179 |
| 3-Person Families | 396 (29.6%) | $93,537 |
| 4-Person Families | 182 (13.6%) | $120,714 |
| 5-Person Families | 121 (9.1%) | $90,673 |
| 6-Person Families | 32 (2.4%) | $93,250 |
| 7+ Person Families | 0 (0.0%) | $0 |
| Total | 1,336 (100.0%) | $92,136 |
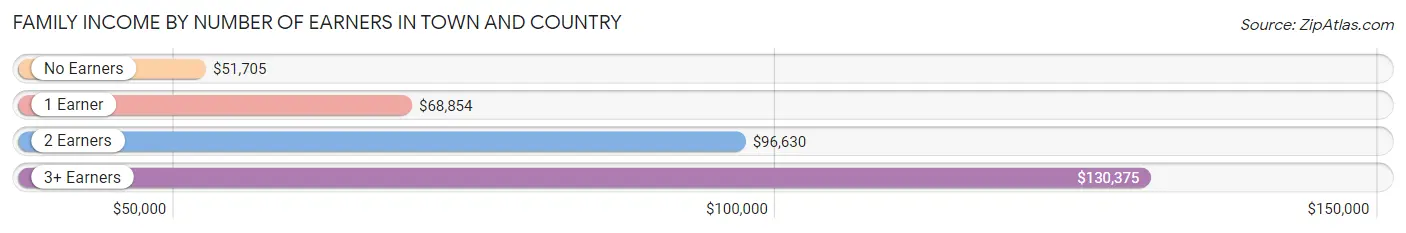
Family Income by Number of Earners in Town and Country
The median family income in Town and Country is $92,136, with families comprising 3+ earners (129) having the highest median family income of $130,375, while families with no earners (193) have the lowest median family income of $51,705, accounting for 9.7% and 14.4% of families, respectively.
| Number of Earners | # Families | Median Income |
| No Earners | 193 (14.4%) | $51,705 |
| 1 Earner | 366 (27.4%) | $68,854 |
| 2 Earners | 648 (48.5%) | $96,630 |
| 3+ Earners | 129 (9.7%) | $130,375 |
| Total | 1,336 (100.0%) | $92,136 |
Household Income in Town and Country
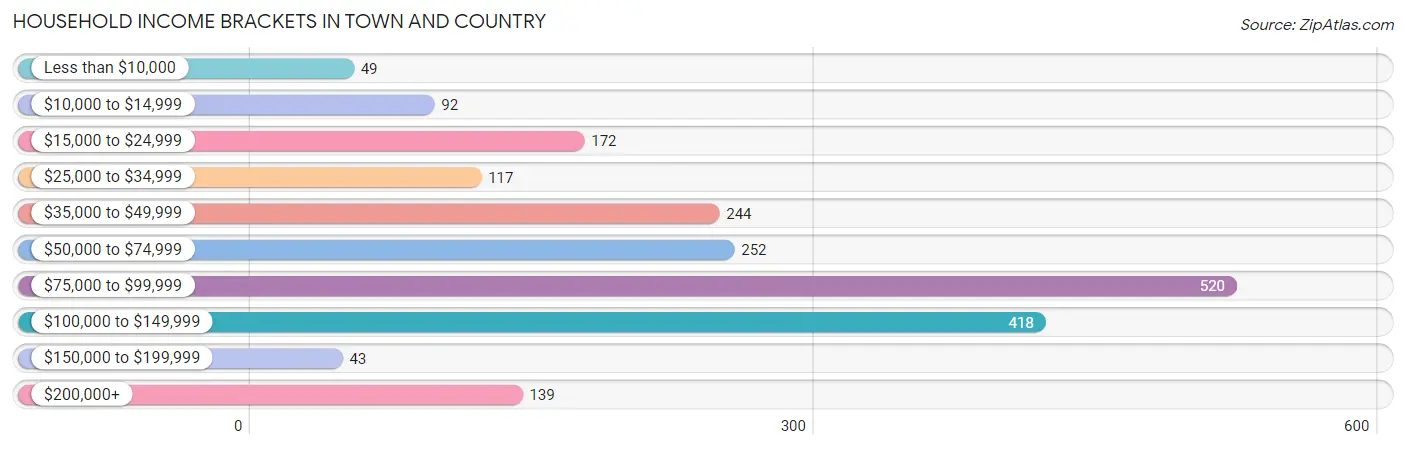
Household Income Brackets in Town and Country
With 520 households falling in the category, the $75,000 to $99,999 income range is the most frequent in Town and Country, accounting for 25.4% of all households. In contrast, only 43 households (2.1%) fall into the $150,000 to $199,999 income bracket, making it the least populous group.
| Income Bracket | # Households | % Households |
| Less than $10,000 | 49 | 2.4% |
| $10,000 to $14,999 | 92 | 4.5% |
| $15,000 to $24,999 | 172 | 8.4% |
| $25,000 to $34,999 | 117 | 5.7% |
| $35,000 to $49,999 | 244 | 11.9% |
| $50,000 to $74,999 | 252 | 12.3% |
| $75,000 to $99,999 | 520 | 25.4% |
| $100,000 to $149,999 | 418 | 20.4% |
| $150,000 to $199,999 | 43 | 2.1% |
| $200,000+ | 139 | 6.8% |
Household Income by Householder Age in Town and Country
The median household income in Town and Country is $85,778, with the highest median household income of $94,651 found in the 45 to 64 years age bracket for the primary householder. A total of 703 households (34.3%) fall into this category. Meanwhile, the 15 to 24 years age bracket for the primary householder has the lowest median household income of $0, with 40 households (1.9%) in this group.
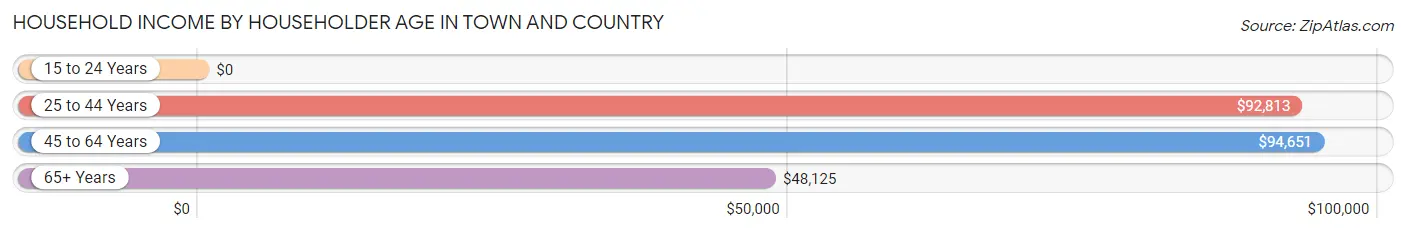
| Income Bracket | # Households | Median Income |
| 15 to 24 Years | 40 (1.9%) | $0 |
| 25 to 44 Years | 607 (29.6%) | $92,813 |
| 45 to 64 Years | 703 (34.3%) | $94,651 |
| 65+ Years | 697 (34.1%) | $48,125 |
| Total | 2,047 (100.0%) | $85,778 |
Poverty in Town and Country
Income Below Poverty by Sex and Age in Town and Country
With 10.7% poverty level for males and 12.7% for females among the residents of Town and Country, 5 year old males and 18 to 24 year old females are the most vulnerable to poverty, with 11 males (30.6%) and 48 females (46.6%) in their respective age groups living below the poverty level.
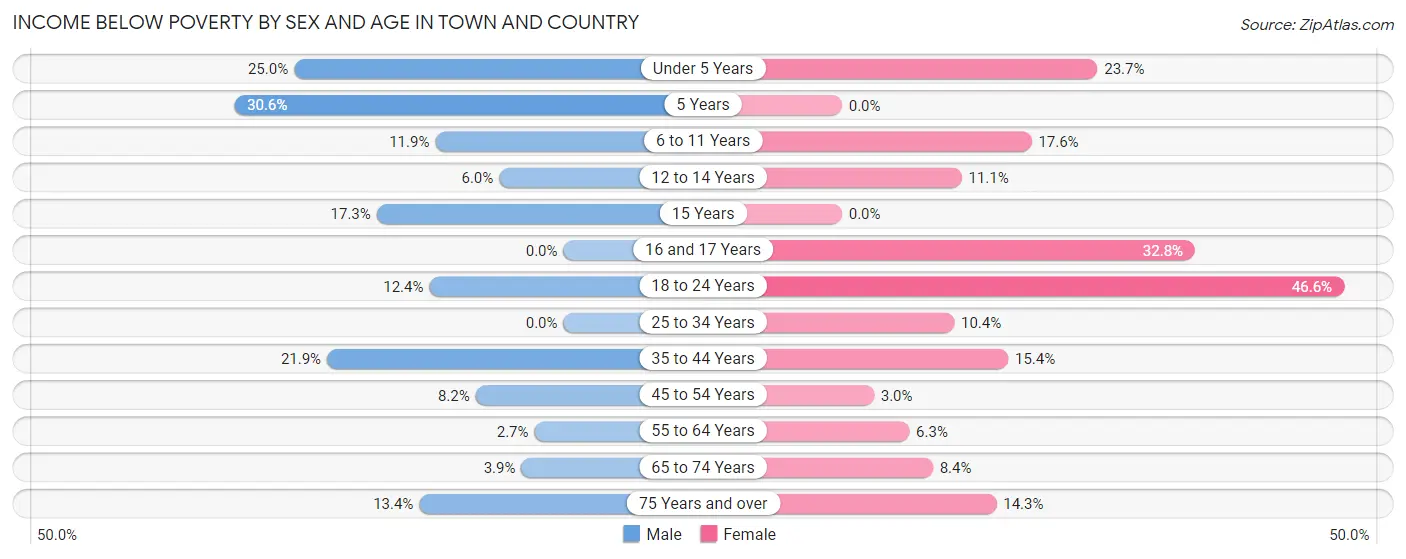
| Age Bracket | Male | Female |
| Under 5 Years | 18 (25.0%) | 23 (23.7%) |
| 5 Years | 11 (30.6%) | 0 (0.0%) |
| 6 to 11 Years | 17 (11.9%) | 22 (17.6%) |
| 12 to 14 Years | 9 (6.0%) | 13 (11.1%) |
| 15 Years | 13 (17.3%) | 0 (0.0%) |
| 16 and 17 Years | 0 (0.0%) | 39 (32.8%) |
| 18 to 24 Years | 26 (12.4%) | 48 (46.6%) |
| 25 to 34 Years | 0 (0.0%) | 35 (10.4%) |
| 35 to 44 Years | 120 (21.9%) | 58 (15.4%) |
| 45 to 54 Years | 29 (8.2%) | 10 (3.0%) |
| 55 to 64 Years | 8 (2.7%) | 20 (6.2%) |
| 65 to 74 Years | 9 (3.9%) | 26 (8.4%) |
| 75 Years and over | 19 (13.4%) | 39 (14.3%) |
| Total | 279 (10.7%) | 333 (12.7%) |
Income Above Poverty by Sex and Age in Town and Country
According to the poverty statistics in Town and Country, males aged 16 and 17 years and females aged 5 years are the age groups that are most secure financially, with 100.0% of males and 100.0% of females in these age groups living above the poverty line.
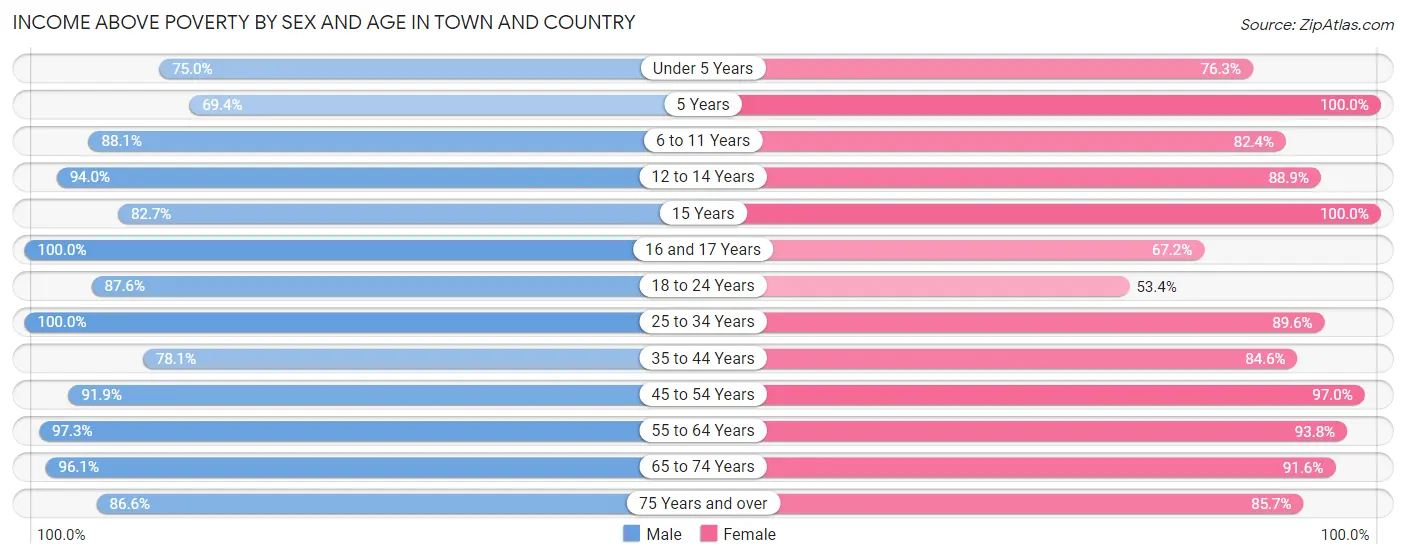
| Age Bracket | Male | Female |
| Under 5 Years | 54 (75.0%) | 74 (76.3%) |
| 5 Years | 25 (69.4%) | 32 (100.0%) |
| 6 to 11 Years | 126 (88.1%) | 103 (82.4%) |
| 12 to 14 Years | 142 (94.0%) | 104 (88.9%) |
| 15 Years | 62 (82.7%) | 89 (100.0%) |
| 16 and 17 Years | 144 (100.0%) | 80 (67.2%) |
| 18 to 24 Years | 183 (87.6%) | 55 (53.4%) |
| 25 to 34 Years | 209 (100.0%) | 301 (89.6%) |
| 35 to 44 Years | 427 (78.1%) | 318 (84.6%) |
| 45 to 54 Years | 327 (91.8%) | 327 (97.0%) |
| 55 to 64 Years | 289 (97.3%) | 300 (93.8%) |
| 65 to 74 Years | 222 (96.1%) | 282 (91.6%) |
| 75 Years and over | 123 (86.6%) | 233 (85.7%) |
| Total | 2,333 (89.3%) | 2,298 (87.3%) |
Income Below Poverty Among Married-Couple Families in Town and Country
The poverty statistics for married-couple families in Town and Country show that 3.1% or 28 of the total 909 families live below the poverty line. Families with 3 or 4 children have the highest poverty rate of 10.7%, comprising of 9 families. On the other hand, families with 1 or 2 children have the lowest poverty rate of 0.9%, which includes 3 families.
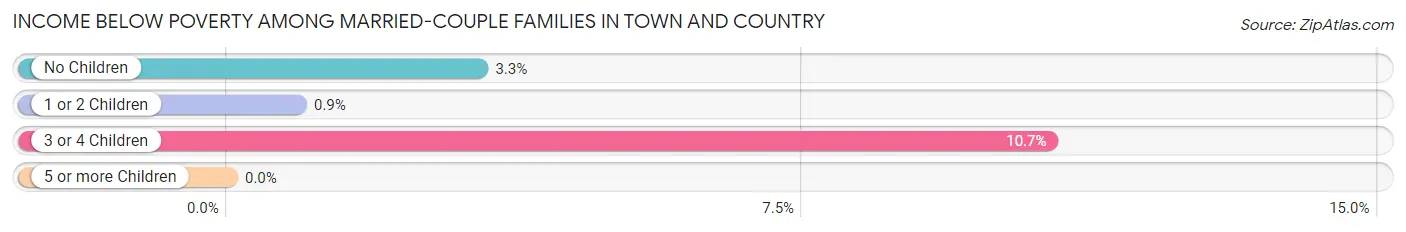
| Children | Above Poverty | Below Poverty |
| No Children | 474 (96.7%) | 16 (3.3%) |
| 1 or 2 Children | 332 (99.1%) | 3 (0.9%) |
| 3 or 4 Children | 75 (89.3%) | 9 (10.7%) |
| 5 or more Children | 0 (0.0%) | 0 (0.0%) |
| Total | 881 (96.9%) | 28 (3.1%) |
Income Below Poverty Among Single-Parent Households in Town and Country
According to the poverty data in Town and Country, 16.2% or 19 single-father households and 19.4% or 60 single-mother households are living below the poverty line. Among single-father households, those with 1 or 2 children have the highest poverty rate, with 19 households (34.5%) experiencing poverty. Likewise, among single-mother households, those with no children have the highest poverty rate, with 30 households (22.1%) falling below the poverty line.
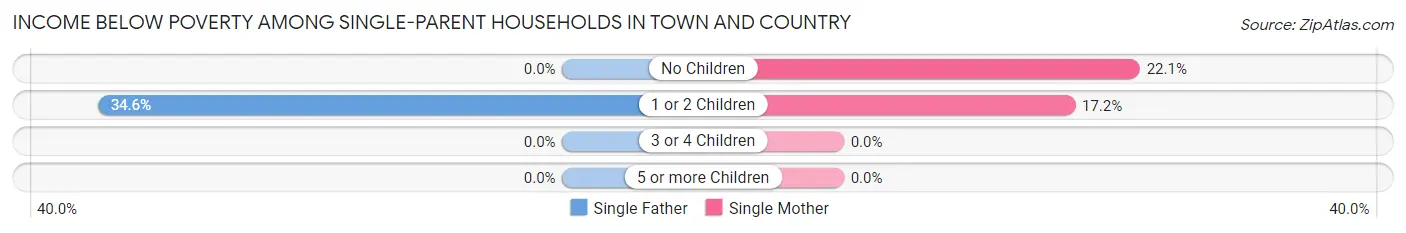
| Children | Single Father | Single Mother |
| No Children | 0 (0.0%) | 30 (22.1%) |
| 1 or 2 Children | 19 (34.5%) | 30 (17.2%) |
| 3 or 4 Children | 0 (0.0%) | 0 (0.0%) |
| 5 or more Children | 0 (0.0%) | 0 (0.0%) |
| Total | 19 (16.2%) | 60 (19.4%) |
Income Below Poverty Among Married-Couple vs Single-Parent Households in Town and Country
The poverty data for Town and Country shows that 28 of the married-couple family households (3.1%) and 79 of the single-parent households (18.5%) are living below the poverty level. Within the married-couple family households, those with 3 or 4 children have the highest poverty rate, with 9 households (10.7%) falling below the poverty line. Among the single-parent households, those with 1 or 2 children have the highest poverty rate, with 49 household (21.4%) living below poverty.
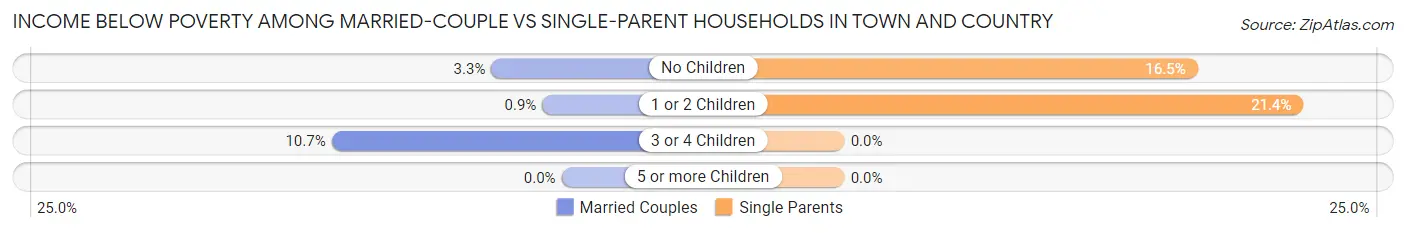
| Children | Married-Couple Families | Single-Parent Households |
| No Children | 16 (3.3%) | 30 (16.5%) |
| 1 or 2 Children | 3 (0.9%) | 49 (21.4%) |
| 3 or 4 Children | 9 (10.7%) | 0 (0.0%) |
| 5 or more Children | 0 (0.0%) | 0 (0.0%) |
| Total | 28 (3.1%) | 79 (18.5%) |
Race in Town and Country
The most populous races in Town and Country are White / Caucasian (4,432 | 84.5%), Two or more Races (482 | 9.2%), and Hispanic or Latino (188 | 3.6%).
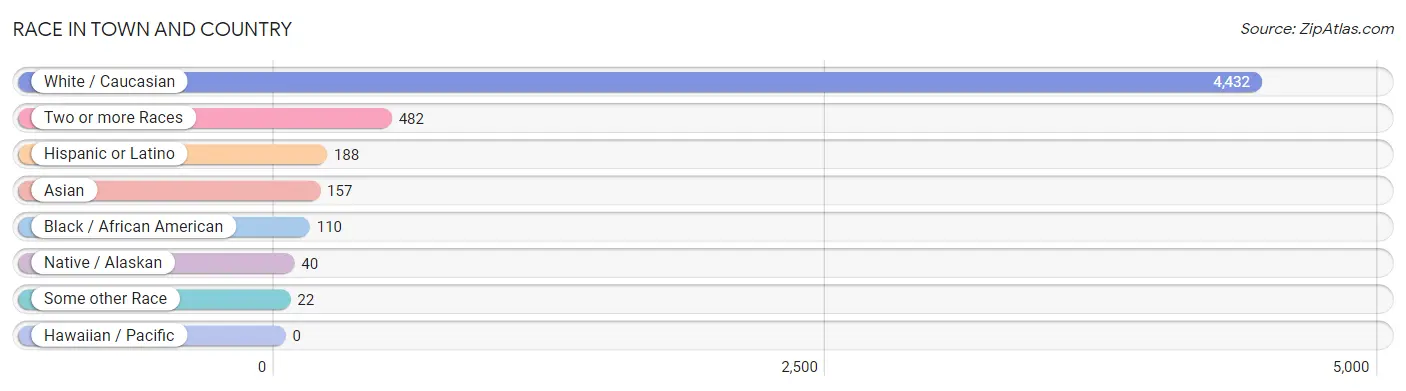
| Race | # Population | % Population |
| Asian | 157 | 3.0% |
| Black / African American | 110 | 2.1% |
| Hawaiian / Pacific | 0 | 0.0% |
| Hispanic or Latino | 188 | 3.6% |
| Native / Alaskan | 40 | 0.8% |
| White / Caucasian | 4,432 | 84.5% |
| Two or more Races | 482 | 9.2% |
| Some other Race | 22 | 0.4% |
| Total | 5,243 | 100.0% |
Ancestry in Town and Country
The most populous ancestries reported in Town and Country are Irish (1,238 | 23.6%), German (1,008 | 19.2%), English (770 | 14.7%), American (406 | 7.7%), and Italian (324 | 6.2%), together accounting for 71.5% of all Town and Country residents.
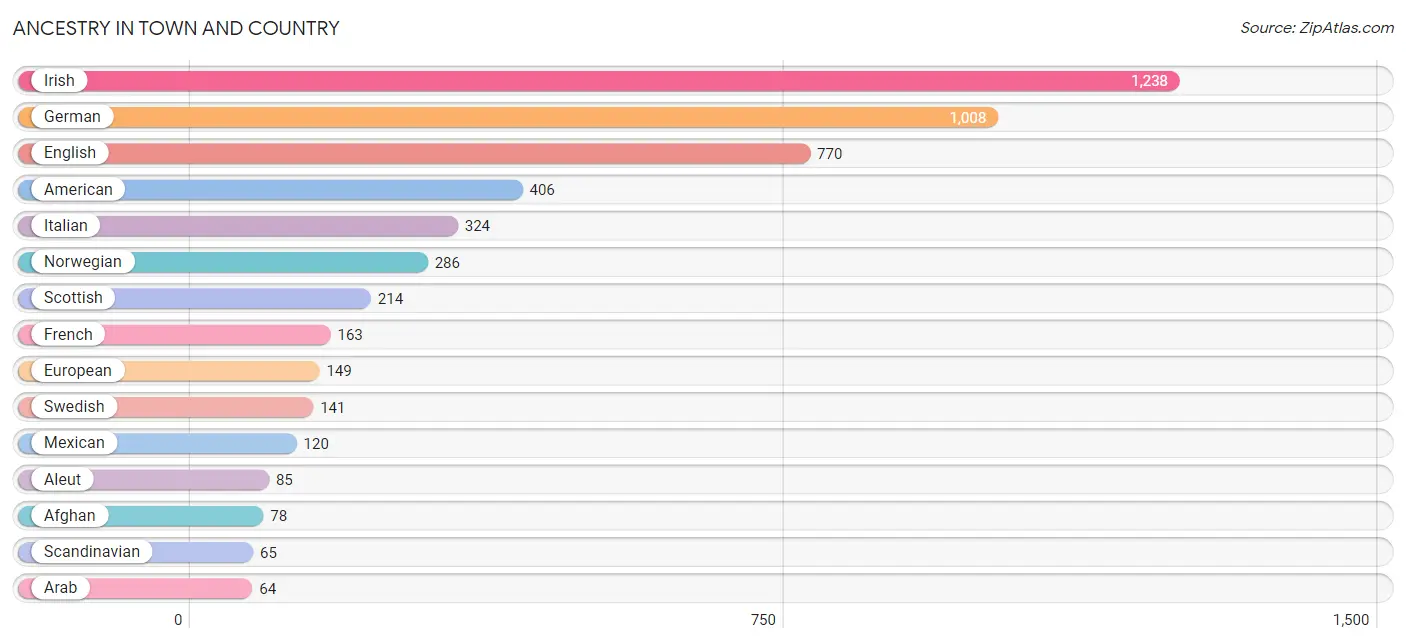
| Ancestry | # Population | % Population |
| Afghan | 78 | 1.5% |
| Aleut | 85 | 1.6% |
| American | 406 | 7.7% |
| Arab | 64 | 1.2% |
| Austrian | 9 | 0.2% |
| Basque | 28 | 0.5% |
| Bhutanese | 52 | 1.0% |
| Blackfeet | 53 | 1.0% |
| Burmese | 14 | 0.3% |
| Cherokee | 37 | 0.7% |
| Croatian | 18 | 0.3% |
| Danish | 45 | 0.9% |
| Dutch | 6 | 0.1% |
| Dutch West Indian | 8 | 0.2% |
| Ecuadorian | 24 | 0.5% |
| English | 770 | 14.7% |
| European | 149 | 2.8% |
| Filipino | 13 | 0.3% |
| French | 163 | 3.1% |
| French Canadian | 11 | 0.2% |
| German | 1,008 | 19.2% |
| Greek | 8 | 0.2% |
| Hmong | 4 | 0.1% |
| Indian (Asian) | 31 | 0.6% |
| Irish | 1,238 | 23.6% |
| Italian | 324 | 6.2% |
| Korean | 27 | 0.5% |
| Mexican | 120 | 2.3% |
| Native Hawaiian | 14 | 0.3% |
| Northern European | 57 | 1.1% |
| Norwegian | 286 | 5.4% |
| Pakistani | 47 | 0.9% |
| Polish | 23 | 0.4% |
| Puerto Rican | 44 | 0.8% |
| Russian | 25 | 0.5% |
| Scandinavian | 65 | 1.2% |
| Scotch-Irish | 10 | 0.2% |
| Scottish | 214 | 4.1% |
| South American | 24 | 0.5% |
| Subsaharan African | 61 | 1.2% |
| Swedish | 141 | 2.7% |
| Swiss | 5 | 0.1% |
| Welsh | 38 | 0.7% |
| Yugoslavian | 34 | 0.6% | View All 44 Rows |
Immigrants in Town and Country
The most numerous immigrant groups reported in Town and Country came from Asia (122 | 2.3%), Africa (61 | 1.2%), Western Africa (61 | 1.2%), Afghanistan (52 | 1.0%), and South Central Asia (52 | 1.0%), together accounting for 6.6% of all Town and Country residents.
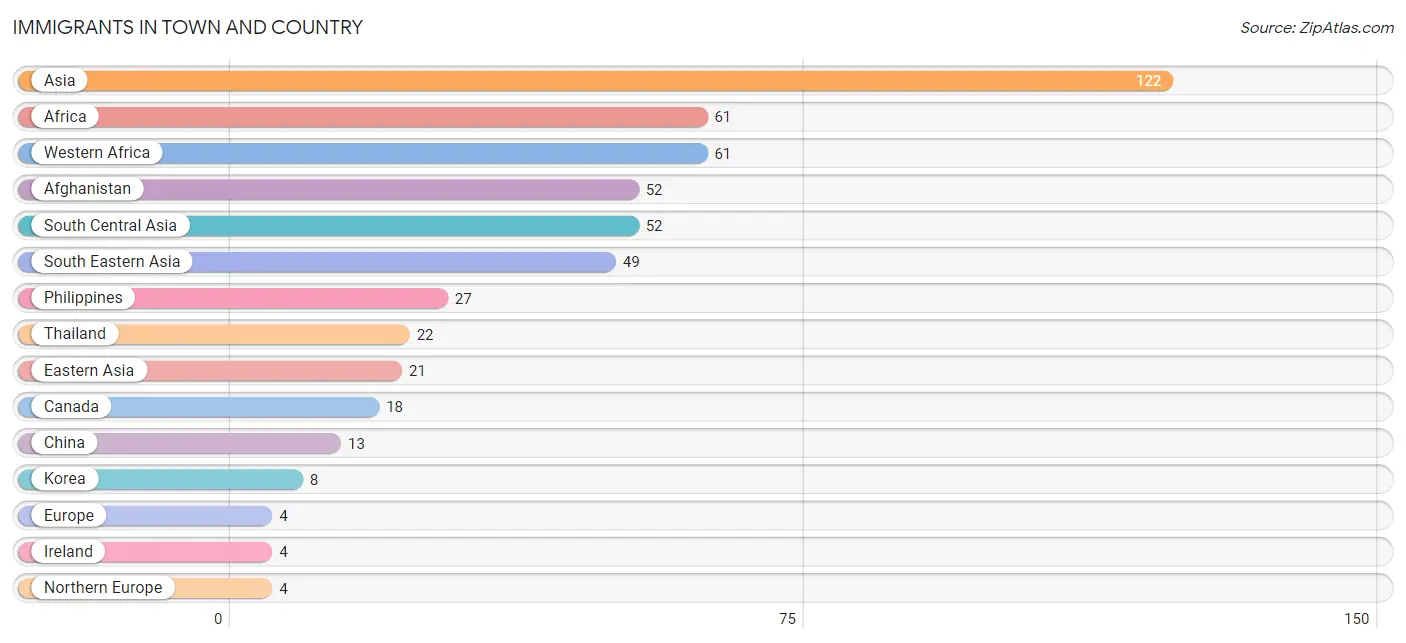
| Immigration Origin | # Population | % Population |
| Afghanistan | 52 | 1.0% |
| Africa | 61 | 1.2% |
| Asia | 122 | 2.3% |
| Canada | 18 | 0.3% |
| China | 13 | 0.3% |
| Eastern Asia | 21 | 0.4% |
| Europe | 4 | 0.1% |
| Ireland | 4 | 0.1% |
| Korea | 8 | 0.2% |
| Northern Europe | 4 | 0.1% |
| Philippines | 27 | 0.5% |
| South Central Asia | 52 | 1.0% |
| South Eastern Asia | 49 | 0.9% |
| Taiwan | 4 | 0.1% |
| Thailand | 22 | 0.4% |
| Western Africa | 61 | 1.2% | View All 16 Rows |
Sex and Age in Town and Country
Sex and Age in Town and Country
The most populous age groups in Town and Country are 35 to 39 Years (348 | 13.3%) for men and 40 to 44 Years (264 | 10.0%) for women.
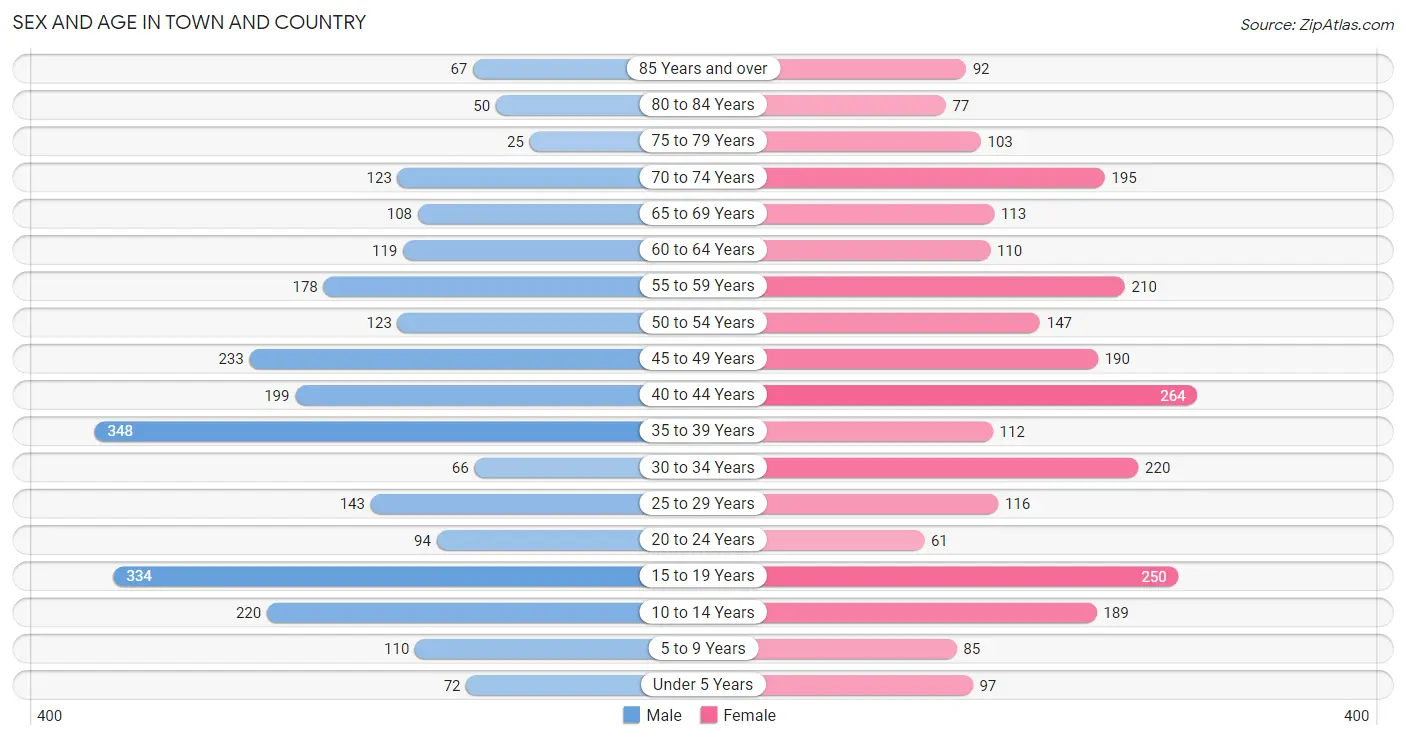
| Age Bracket | Male | Female |
| Under 5 Years | 72 (2.8%) | 97 (3.7%) |
| 5 to 9 Years | 110 (4.2%) | 85 (3.2%) |
| 10 to 14 Years | 220 (8.4%) | 189 (7.2%) |
| 15 to 19 Years | 334 (12.8%) | 250 (9.5%) |
| 20 to 24 Years | 94 (3.6%) | 61 (2.3%) |
| 25 to 29 Years | 143 (5.5%) | 116 (4.4%) |
| 30 to 34 Years | 66 (2.5%) | 220 (8.4%) |
| 35 to 39 Years | 348 (13.3%) | 112 (4.3%) |
| 40 to 44 Years | 199 (7.6%) | 264 (10.0%) |
| 45 to 49 Years | 233 (8.9%) | 190 (7.2%) |
| 50 to 54 Years | 123 (4.7%) | 147 (5.6%) |
| 55 to 59 Years | 178 (6.8%) | 210 (8.0%) |
| 60 to 64 Years | 119 (4.6%) | 110 (4.2%) |
| 65 to 69 Years | 108 (4.1%) | 113 (4.3%) |
| 70 to 74 Years | 123 (4.7%) | 195 (7.4%) |
| 75 to 79 Years | 25 (1.0%) | 103 (3.9%) |
| 80 to 84 Years | 50 (1.9%) | 77 (2.9%) |
| 85 Years and over | 67 (2.6%) | 92 (3.5%) |
| Total | 2,612 (100.0%) | 2,631 (100.0%) |
Families and Households in Town and Country
Median Family Size in Town and Country
The median family size in Town and Country is 3.12 persons per family, with married-couple families (909 | 68.0%) accounting for the largest median family size of 3.28 persons per family. On the other hand, single male/father families (117 | 8.8%) represent the smallest median family size with 2.74 persons per family.
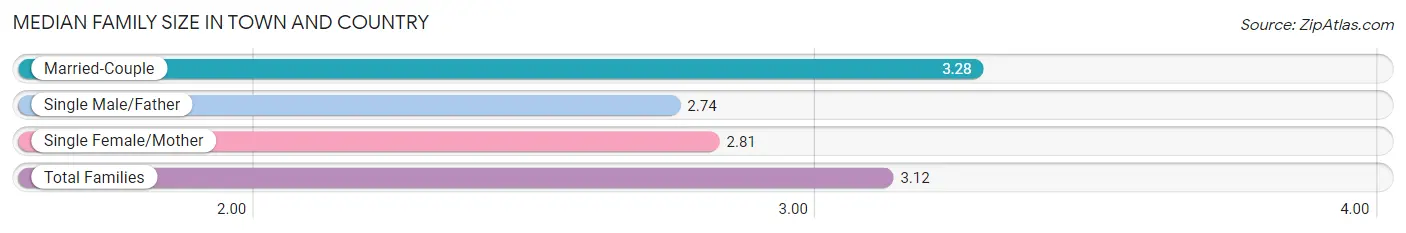
| Family Type | # Families | Family Size |
| Married-Couple | 909 (68.0%) | 3.28 |
| Single Male/Father | 117 (8.8%) | 2.74 |
| Single Female/Mother | 310 (23.2%) | 2.81 |
| Total Families | 1,336 (100.0%) | 3.12 |
Median Household Size in Town and Country
The median household size in Town and Country is 2.56 persons per household, with married-couple households (909 | 44.4%) accounting for the largest median household size of 3.31 persons per household. non-family households (711 | 34.7%) represent the smallest median household size with 1.33 persons per household.
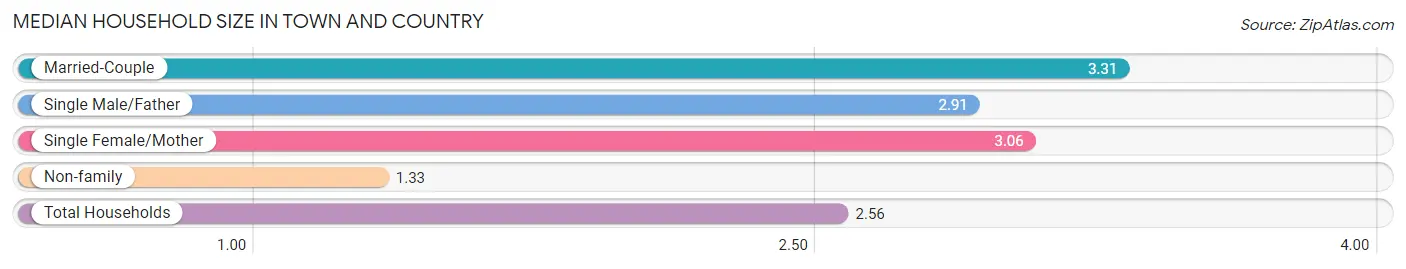
| Household Type | # Households | Household Size |
| Married-Couple | 909 (44.4%) | 3.31 |
| Single Male/Father | 117 (5.7%) | 2.91 |
| Single Female/Mother | 310 (15.1%) | 3.06 |
| Non-family | 711 (34.7%) | 1.33 |
| Total Households | 2,047 (100.0%) | 2.56 |
Household Size by Marriage Status in Town and Country
Out of a total of 2,047 households in Town and Country, 1,336 (65.3%) are family households, while 711 (34.7%) are nonfamily households. The most numerous type of family households are 2-person households, comprising 546, and the most common type of nonfamily households are 1-person households, comprising 605.
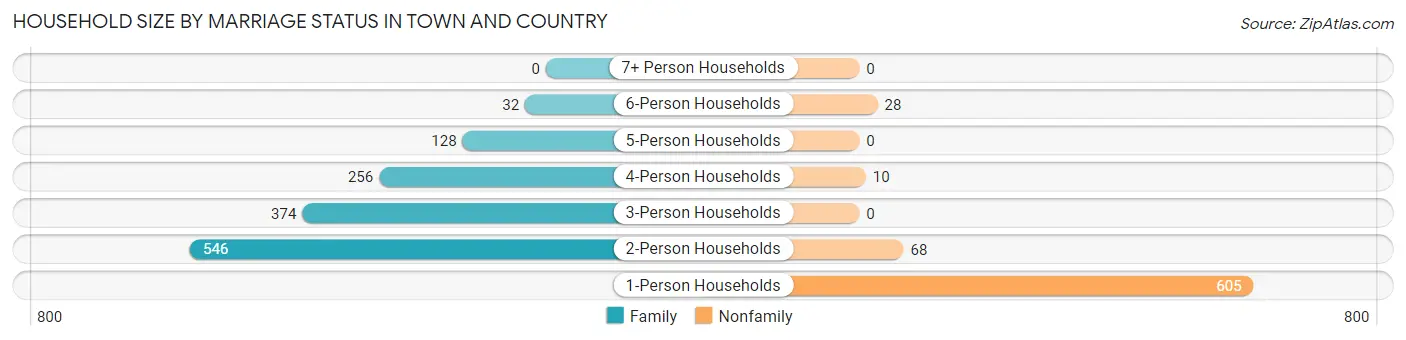
| Household Size | Family Households | Nonfamily Households |
| 1-Person Households | - | 605 (29.6%) |
| 2-Person Households | 546 (26.7%) | 68 (3.3%) |
| 3-Person Households | 374 (18.3%) | 0 (0.0%) |
| 4-Person Households | 256 (12.5%) | 10 (0.5%) |
| 5-Person Households | 128 (6.2%) | 0 (0.0%) |
| 6-Person Households | 32 (1.6%) | 28 (1.4%) |
| 7+ Person Households | 0 (0.0%) | 0 (0.0%) |
| Total | 1,336 (65.3%) | 711 (34.7%) |
Female Fertility in Town and Country
Fertility by Age in Town and Country
Average fertility rate in Town and Country is 39.0 births per 1,000 women. Women in the age bracket of 35 to 50 years have the highest fertility rate with 50.0 births per 1,000 women. Women in the age bracket of 35 to 50 years acount for 60.4% of all women with births.
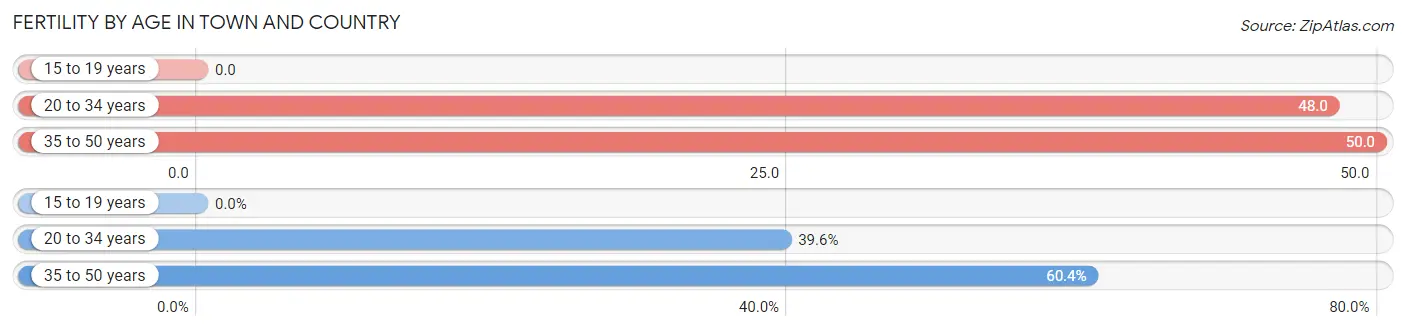
| Age Bracket | Women with Births | Births / 1,000 Women |
| 15 to 19 years | 0 (0.0%) | 0.0 |
| 20 to 34 years | 19 (39.6%) | 48.0 |
| 35 to 50 years | 29 (60.4%) | 50.0 |
| Total | 48 (100.0%) | 39.0 |
Fertility by Age by Marriage Status in Town and Country
60.4% of women with births (48) in Town and Country are married. The highest percentage of unmarried women with births falls into 35 to 50 years age bracket with 65.5% of them unmarried at the time of birth, while the lowest percentage of unmarried women with births belong to 20 to 34 years age bracket with 0.0% of them unmarried.
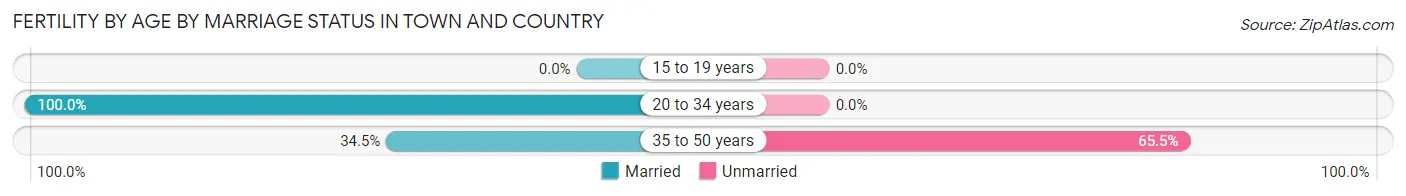
| Age Bracket | Married | Unmarried |
| 15 to 19 years | 0 (0.0%) | 0 (0.0%) |
| 20 to 34 years | 19 (100.0%) | 0 (0.0%) |
| 35 to 50 years | 10 (34.5%) | 19 (65.5%) |
| Total | 29 (60.4%) | 19 (39.6%) |
Fertility by Education in Town and Country
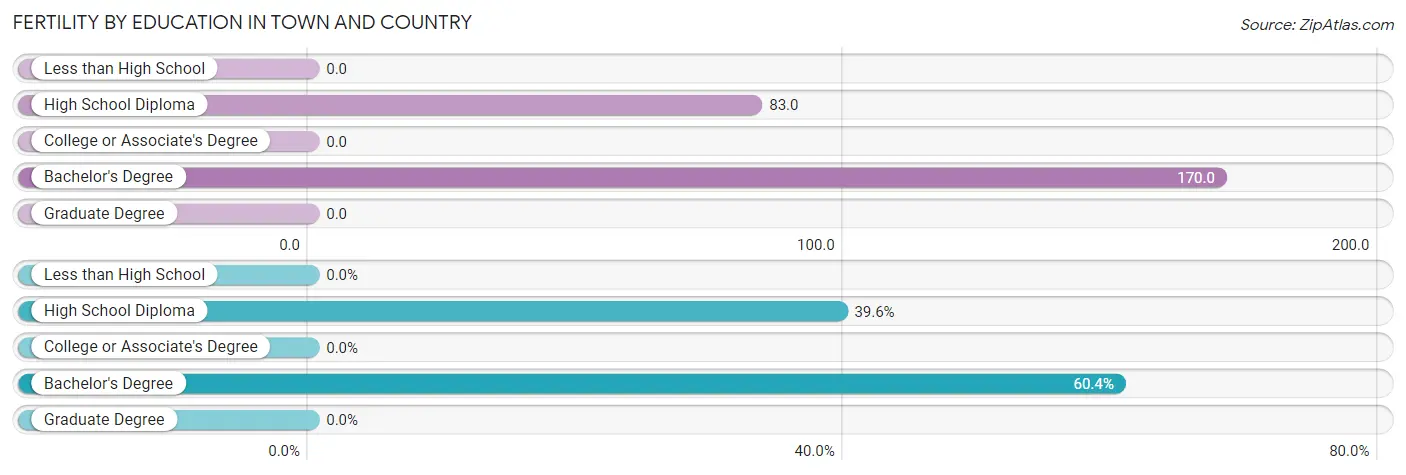
| Educational Attainment | Women with Births | Births / 1,000 Women |
| Less than High School | 0 (0.0%) | 0.0 |
| High School Diploma | 19 (39.6%) | 83.0 |
| College or Associate's Degree | 0 (0.0%) | 0.0 |
| Bachelor's Degree | 29 (60.4%) | 170.0 |
| Graduate Degree | 0 (0.0%) | 0.0 |
| Total | 48 (100.0%) | 39.0 |
Fertility by Education by Marriage Status in Town and Country
39.6% of women with births in Town and Country are unmarried. Women with the educational attainment of bachelor's degree are most likely to be married with 100.0% of them married at childbirth, while women with the educational attainment of high school diploma are least likely to be married with 100.0% of them unmarried at childbirth.
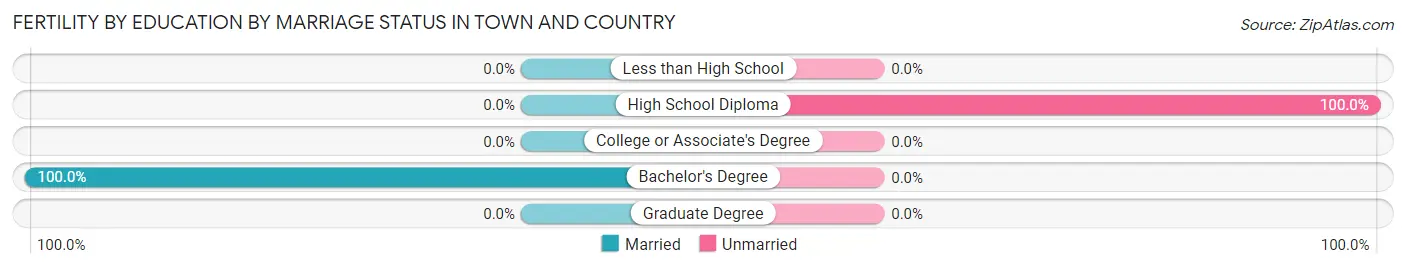
| Educational Attainment | Married | Unmarried |
| Less than High School | 0 (0.0%) | 0 (0.0%) |
| High School Diploma | 0 (0.0%) | 19 (100.0%) |
| College or Associate's Degree | 0 (0.0%) | 0 (0.0%) |
| Bachelor's Degree | 29 (100.0%) | 0 (0.0%) |
| Graduate Degree | 0 (0.0%) | 0 (0.0%) |
| Total | 29 (60.4%) | 19 (39.6%) |
Employment Characteristics in Town and Country
Employment by Class of Employer in Town and Country
Among the 2,537 employed individuals in Town and Country, private company employees (1,607 | 63.3%), not-for-profit organizations (268 | 10.6%), and self-employed (not incorporated) (239 | 9.4%) make up the most common classes of employment.
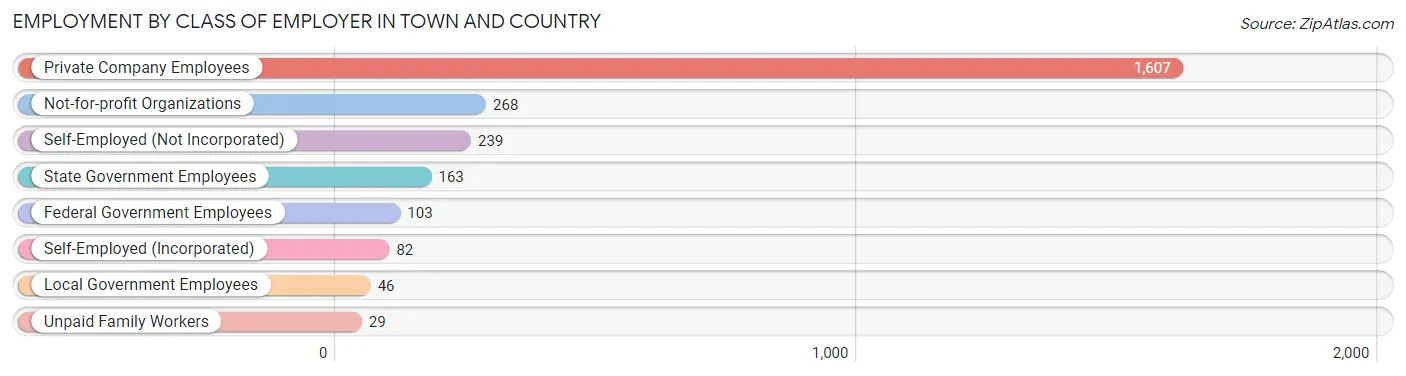
| Employer Class | # Employees | % Employees |
| Private Company Employees | 1,607 | 63.3% |
| Self-Employed (Incorporated) | 82 | 3.2% |
| Self-Employed (Not Incorporated) | 239 | 9.4% |
| Not-for-profit Organizations | 268 | 10.6% |
| Local Government Employees | 46 | 1.8% |
| State Government Employees | 163 | 6.4% |
| Federal Government Employees | 103 | 4.1% |
| Unpaid Family Workers | 29 | 1.1% |
| Total | 2,537 | 100.0% |
Employment Status by Age in Town and Country
According to the labor force statistics for Town and Country, out of the total population over 16 years of age (4,306), 66.9% or 2,881 individuals are in the labor force, with 9.2% or 265 of them unemployed. The age group with the highest labor force participation rate is 45 to 54 years, with 91.2% or 632 individuals in the labor force. Within the labor force, the 16 to 19 years age range has the highest percentage of unemployed individuals, with 23.6% or 68 of them being unemployed.
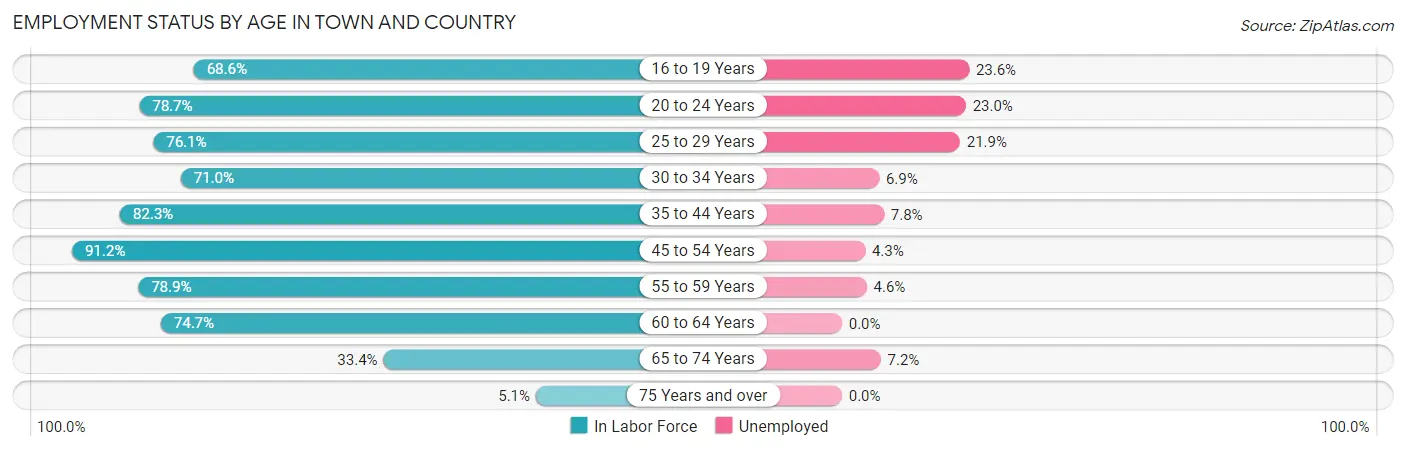
| Age Bracket | In Labor Force | Unemployed |
| 16 to 19 Years | 288 (68.6%) | 68 (23.6%) |
| 20 to 24 Years | 122 (78.7%) | 28 (23.0%) |
| 25 to 29 Years | 197 (76.1%) | 43 (21.9%) |
| 30 to 34 Years | 203 (71.0%) | 14 (6.9%) |
| 35 to 44 Years | 760 (82.3%) | 59 (7.8%) |
| 45 to 54 Years | 632 (91.2%) | 27 (4.3%) |
| 55 to 59 Years | 306 (78.9%) | 14 (4.6%) |
| 60 to 64 Years | 171 (74.7%) | 0 (0.0%) |
| 65 to 74 Years | 180 (33.4%) | 13 (7.2%) |
| 75 Years and over | 21 (5.1%) | 0 (0.0%) |
| Total | 2,881 (66.9%) | 265 (9.2%) |
Employment Status by Educational Attainment in Town and Country
According to labor force statistics for Town and Country, 81.7% of individuals (2,270) out of the total population between 25 and 64 years of age (2,778) are in the labor force, with 6.8% or 154 of them being unemployed. The group with the highest labor force participation rate are those with the educational attainment of bachelor's degree or higher, with 92.2% or 553 individuals in the labor force. Within the labor force, individuals with less than high school education have the highest percentage of unemployment, with 62.3% or 38 of them being unemployed.
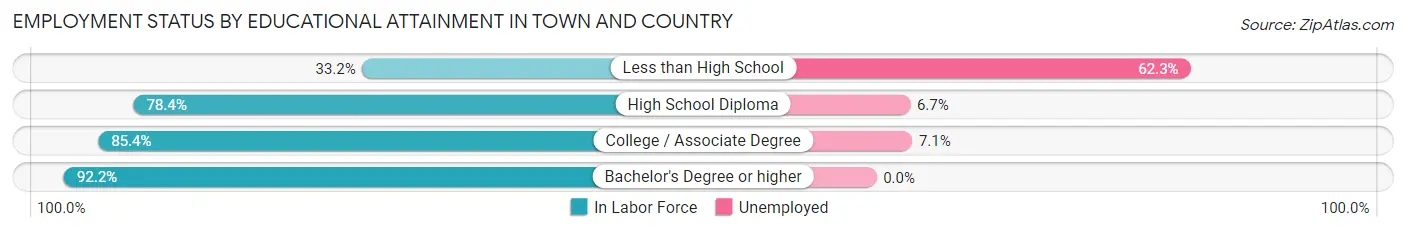
| Educational Attainment | In Labor Force | Unemployed |
| Less than High School | 61 (33.2%) | 115 (62.3%) |
| High School Diploma | 536 (78.4%) | 46 (6.7%) |
| College / Associate Degree | 1,119 (85.4%) | 93 (7.1%) |
| Bachelor's Degree or higher | 553 (92.2%) | 0 (0.0%) |
| Total | 2,270 (81.7%) | 189 (6.8%) |
Employment Occupations by Sex in Town and Country
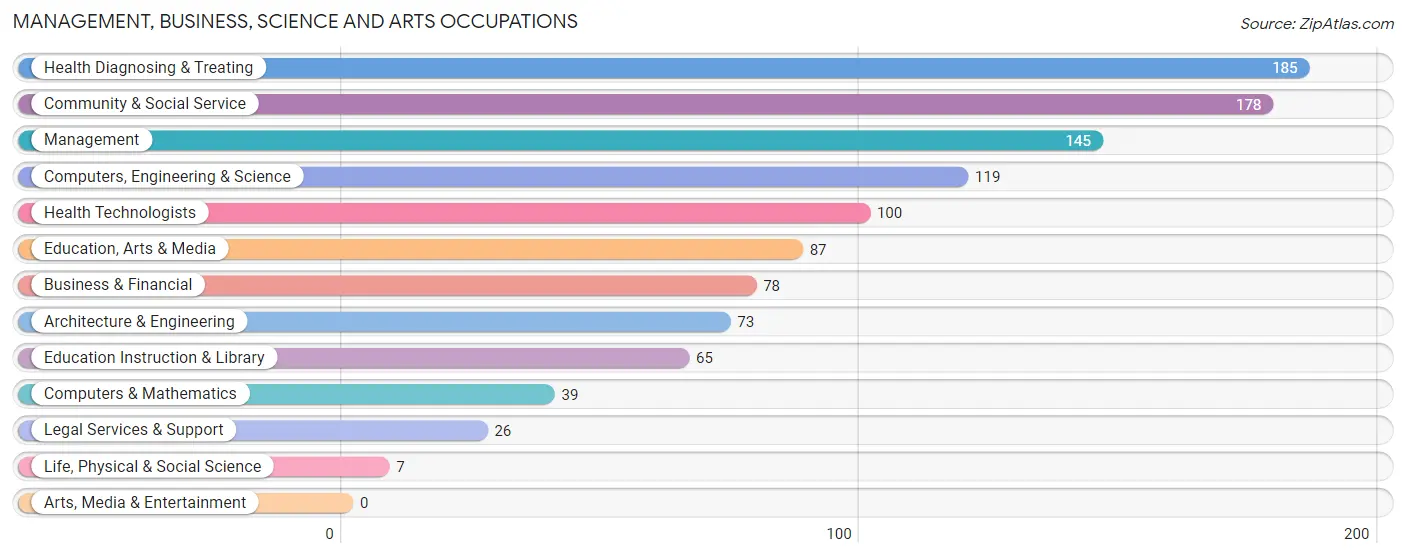
Management, Business, Science and Arts Occupations
The most common Management, Business, Science and Arts occupations in Town and Country are Health Diagnosing & Treating (185 | 7.1%), Community & Social Service (178 | 6.8%), Management (145 | 5.6%), Computers, Engineering & Science (119 | 4.6%), and Health Technologists (100 | 3.8%).
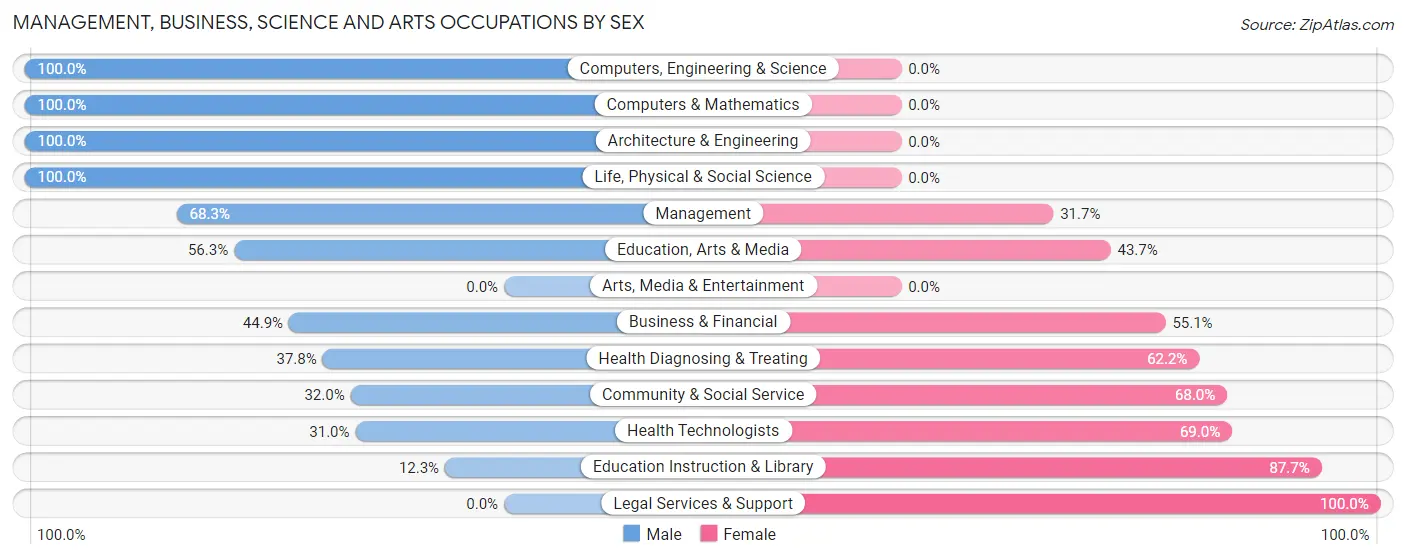
Management, Business, Science and Arts Occupations by Sex
Within the Management, Business, Science and Arts occupations in Town and Country, the most male-oriented occupations are Computers, Engineering & Science (100.0%), Computers & Mathematics (100.0%), and Architecture & Engineering (100.0%), while the most female-oriented occupations are Legal Services & Support (100.0%), Education Instruction & Library (87.7%), and Health Technologists (69.0%).
| Occupation | Male | Female |
| Management | 99 (68.3%) | 46 (31.7%) |
| Business & Financial | 35 (44.9%) | 43 (55.1%) |
| Computers, Engineering & Science | 119 (100.0%) | 0 (0.0%) |
| Computers & Mathematics | 39 (100.0%) | 0 (0.0%) |
| Architecture & Engineering | 73 (100.0%) | 0 (0.0%) |
| Life, Physical & Social Science | 7 (100.0%) | 0 (0.0%) |
| Community & Social Service | 57 (32.0%) | 121 (68.0%) |
| Education, Arts & Media | 49 (56.3%) | 38 (43.7%) |
| Legal Services & Support | 0 (0.0%) | 26 (100.0%) |
| Education Instruction & Library | 8 (12.3%) | 57 (87.7%) |
| Arts, Media & Entertainment | 0 (0.0%) | 0 (0.0%) |
| Health Diagnosing & Treating | 70 (37.8%) | 115 (62.2%) |
| Health Technologists | 31 (31.0%) | 69 (69.0%) |
| Total (Category) | 380 (53.9%) | 325 (46.1%) |
| Total (Overall) | 1,465 (56.3%) | 1,138 (43.7%) |
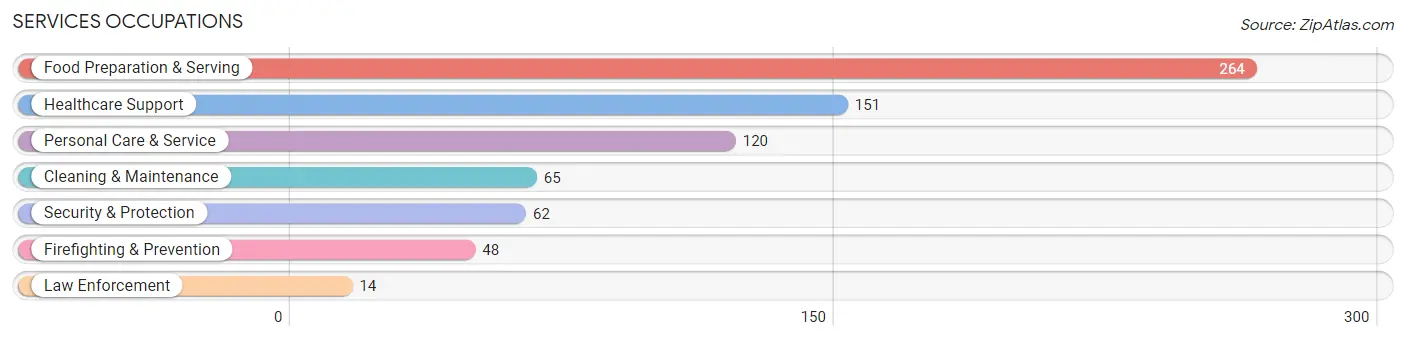
Services Occupations
The most common Services occupations in Town and Country are Food Preparation & Serving (264 | 10.1%), Healthcare Support (151 | 5.8%), Personal Care & Service (120 | 4.6%), Cleaning & Maintenance (65 | 2.5%), and Security & Protection (62 | 2.4%).
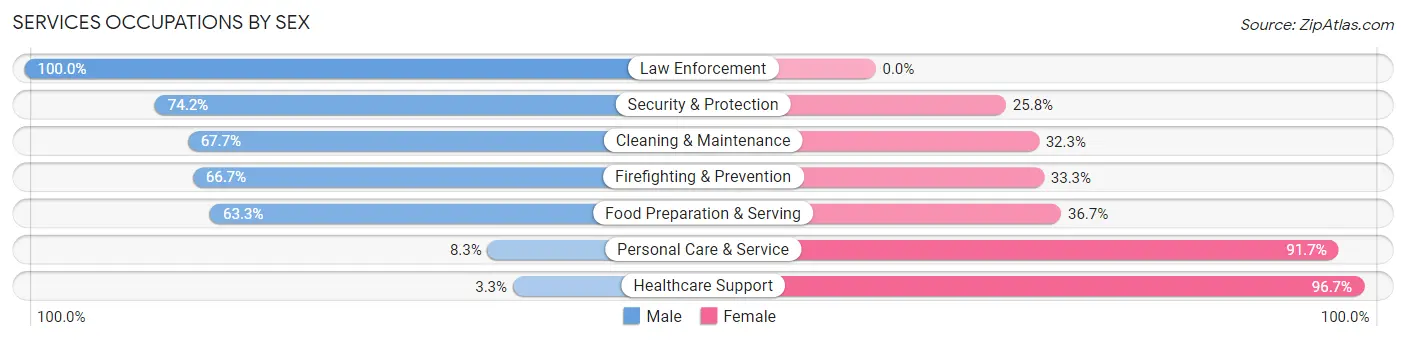
Services Occupations by Sex
Within the Services occupations in Town and Country, the most male-oriented occupations are Law Enforcement (100.0%), Security & Protection (74.2%), and Cleaning & Maintenance (67.7%), while the most female-oriented occupations are Healthcare Support (96.7%), Personal Care & Service (91.7%), and Food Preparation & Serving (36.7%).
| Occupation | Male | Female |
| Healthcare Support | 5 (3.3%) | 146 (96.7%) |
| Security & Protection | 46 (74.2%) | 16 (25.8%) |
| Firefighting & Prevention | 32 (66.7%) | 16 (33.3%) |
| Law Enforcement | 14 (100.0%) | 0 (0.0%) |
| Food Preparation & Serving | 167 (63.3%) | 97 (36.7%) |
| Cleaning & Maintenance | 44 (67.7%) | 21 (32.3%) |
| Personal Care & Service | 10 (8.3%) | 110 (91.7%) |
| Total (Category) | 272 (41.1%) | 390 (58.9%) |
| Total (Overall) | 1,465 (56.3%) | 1,138 (43.7%) |
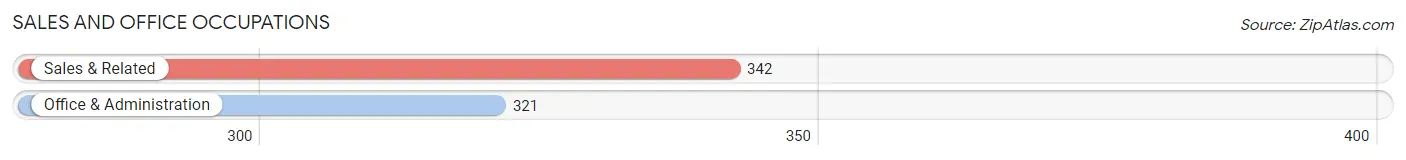
Sales and Office Occupations
The most common Sales and Office occupations in Town and Country are Sales & Related (342 | 13.1%), and Office & Administration (321 | 12.3%).
Sales and Office Occupations by Sex
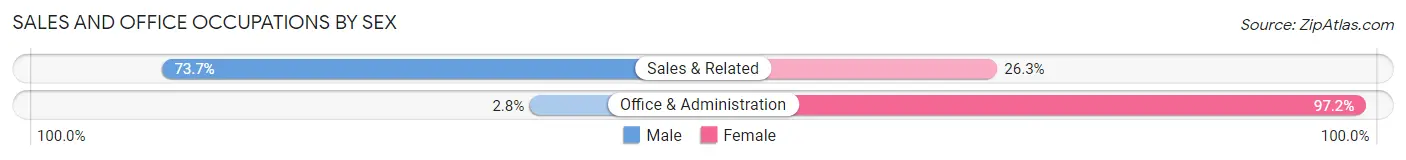
| Occupation | Male | Female |
| Sales & Related | 252 (73.7%) | 90 (26.3%) |
| Office & Administration | 9 (2.8%) | 312 (97.2%) |
| Total (Category) | 261 (39.4%) | 402 (60.6%) |
| Total (Overall) | 1,465 (56.3%) | 1,138 (43.7%) |
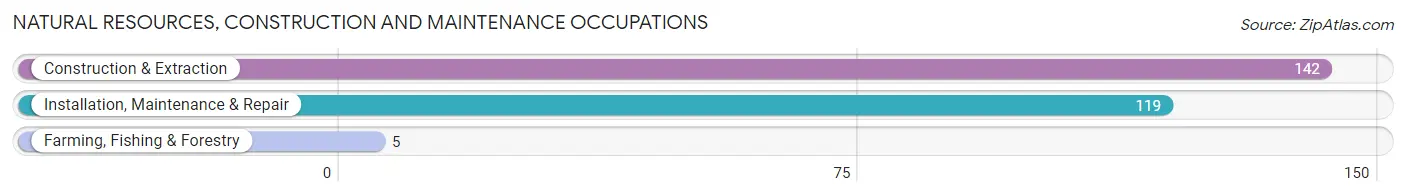
Natural Resources, Construction and Maintenance Occupations
The most common Natural Resources, Construction and Maintenance occupations in Town and Country are Construction & Extraction (142 | 5.5%), Installation, Maintenance & Repair (119 | 4.6%), and Farming, Fishing & Forestry (5 | 0.2%).
Natural Resources, Construction and Maintenance Occupations by Sex
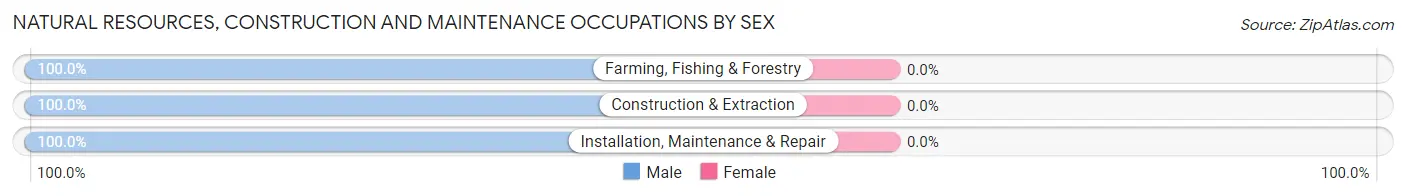
| Occupation | Male | Female |
| Farming, Fishing & Forestry | 5 (100.0%) | 0 (0.0%) |
| Construction & Extraction | 142 (100.0%) | 0 (0.0%) |
| Installation, Maintenance & Repair | 119 (100.0%) | 0 (0.0%) |
| Total (Category) | 266 (100.0%) | 0 (0.0%) |
| Total (Overall) | 1,465 (56.3%) | 1,138 (43.7%) |
Production, Transportation and Moving Occupations
The most common Production, Transportation and Moving occupations in Town and Country are Material Moving (142 | 5.5%), Transportation (141 | 5.4%), and Production (24 | 0.9%).
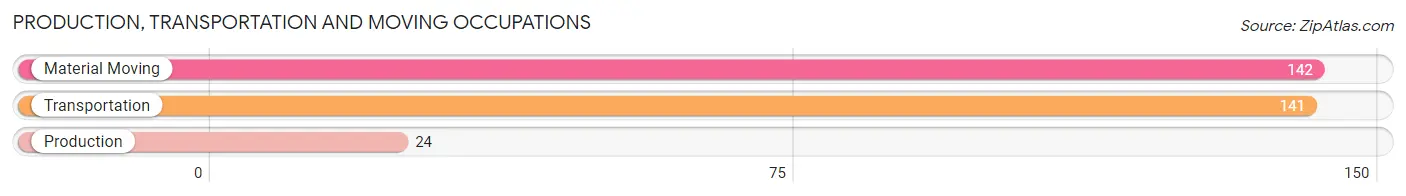
Production, Transportation and Moving Occupations by Sex
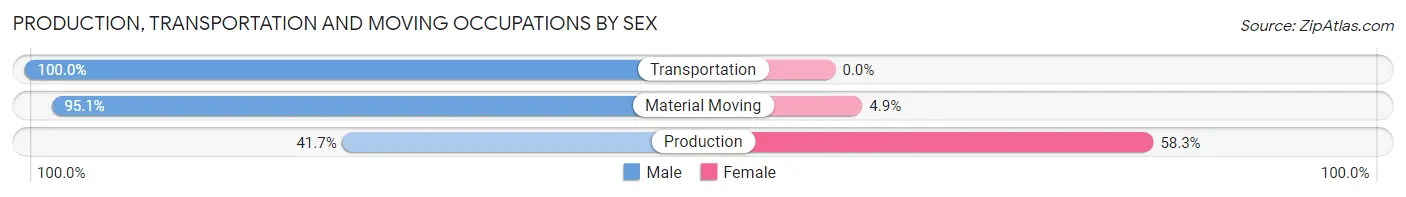
| Occupation | Male | Female |
| Production | 10 (41.7%) | 14 (58.3%) |
| Transportation | 141 (100.0%) | 0 (0.0%) |
| Material Moving | 135 (95.1%) | 7 (4.9%) |
| Total (Category) | 286 (93.2%) | 21 (6.8%) |
| Total (Overall) | 1,465 (56.3%) | 1,138 (43.7%) |
Employment Industries by Sex in Town and Country
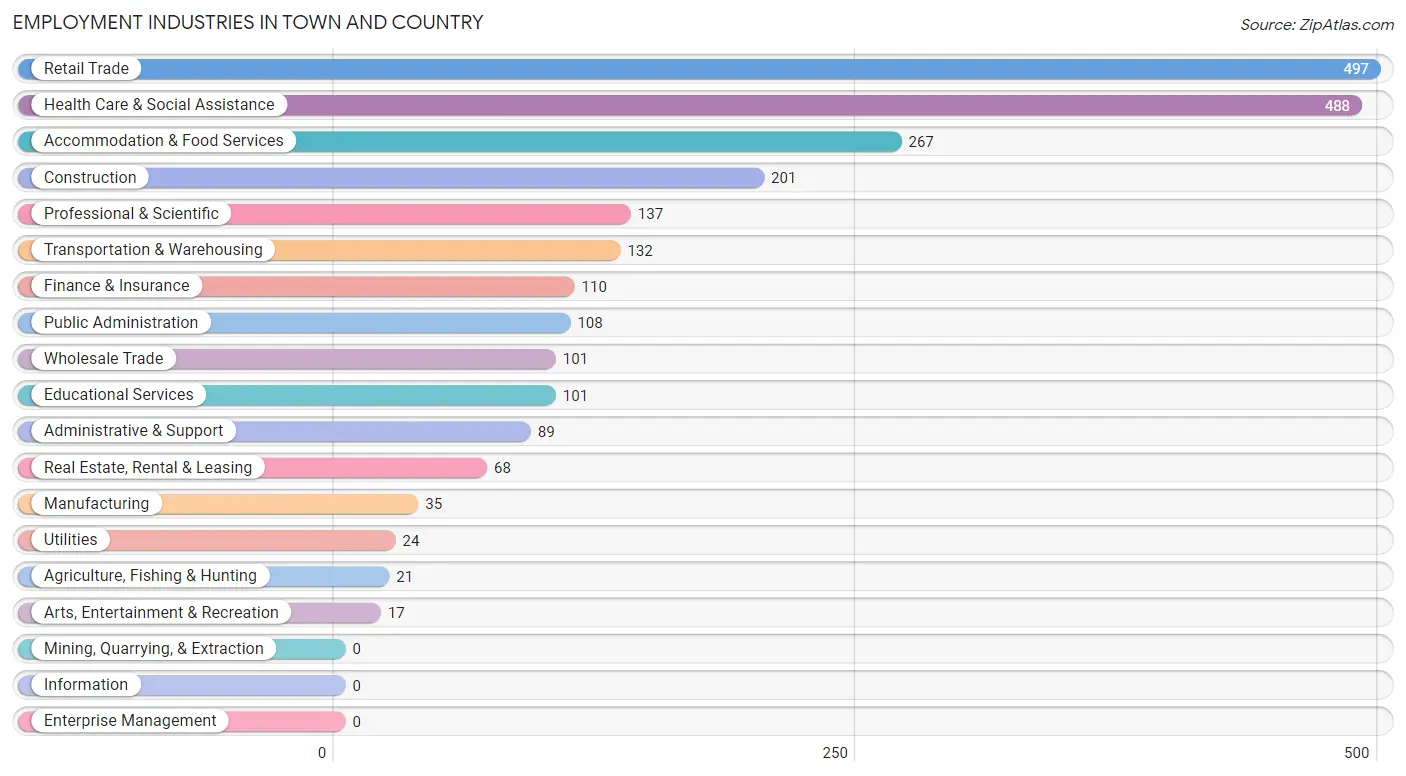
Employment Industries in Town and Country
The major employment industries in Town and Country include Retail Trade (497 | 19.1%), Health Care & Social Assistance (488 | 18.8%), Accommodation & Food Services (267 | 10.3%), Construction (201 | 7.7%), and Professional & Scientific (137 | 5.3%).
Employment Industries by Sex in Town and Country
The Town and Country industries that see more men than women are Agriculture, Fishing & Hunting (100.0%), Transportation & Warehousing (100.0%), and Construction (78.1%), whereas the industries that tend to have a higher number of women are Educational Services (92.1%), Health Care & Social Assistance (74.2%), and Finance & Insurance (73.6%).
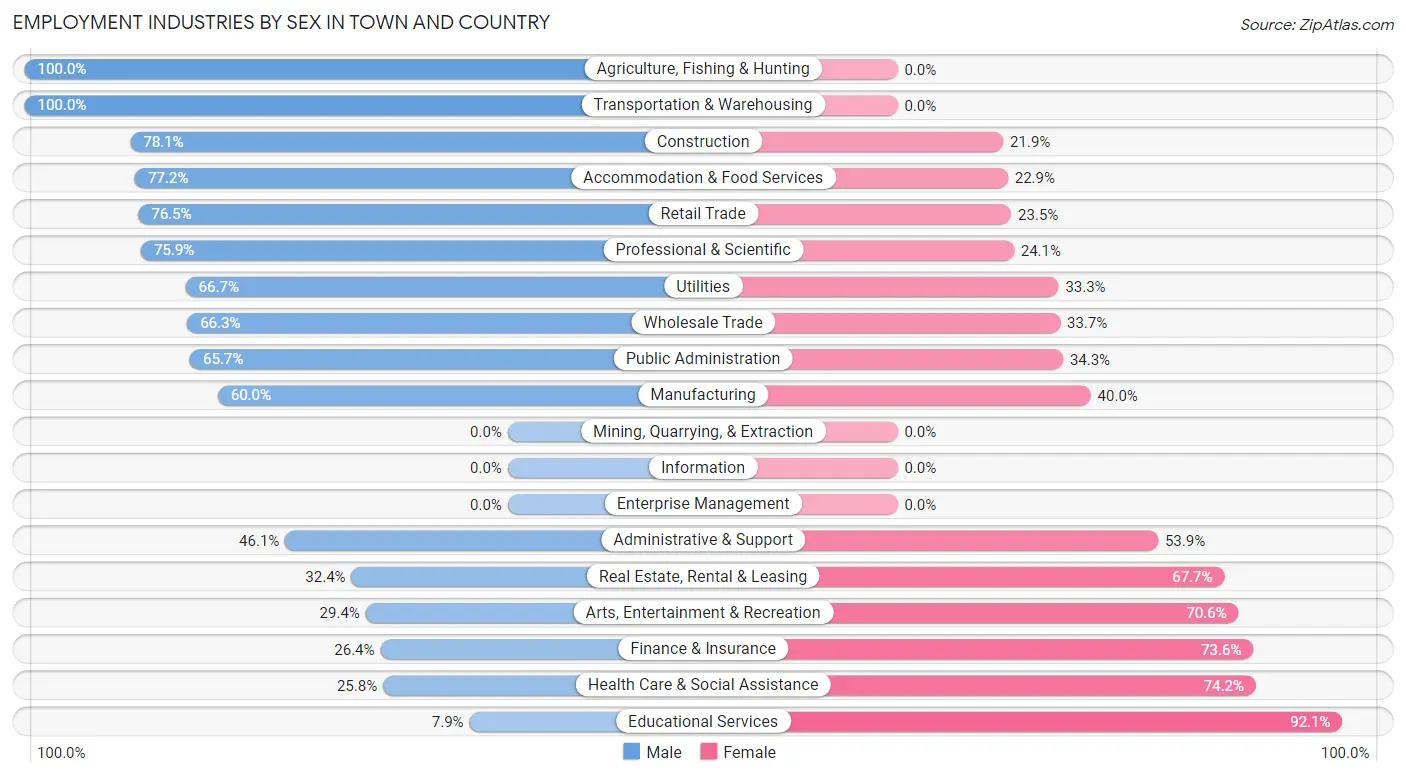
| Industry | Male | Female |
| Agriculture, Fishing & Hunting | 21 (100.0%) | 0 (0.0%) |
| Mining, Quarrying, & Extraction | 0 (0.0%) | 0 (0.0%) |
| Construction | 157 (78.1%) | 44 (21.9%) |
| Manufacturing | 21 (60.0%) | 14 (40.0%) |
| Wholesale Trade | 67 (66.3%) | 34 (33.7%) |
| Retail Trade | 380 (76.5%) | 117 (23.5%) |
| Transportation & Warehousing | 132 (100.0%) | 0 (0.0%) |
| Utilities | 16 (66.7%) | 8 (33.3%) |
| Information | 0 (0.0%) | 0 (0.0%) |
| Finance & Insurance | 29 (26.4%) | 81 (73.6%) |
| Real Estate, Rental & Leasing | 22 (32.4%) | 46 (67.6%) |
| Professional & Scientific | 104 (75.9%) | 33 (24.1%) |
| Enterprise Management | 0 (0.0%) | 0 (0.0%) |
| Administrative & Support | 41 (46.1%) | 48 (53.9%) |
| Educational Services | 8 (7.9%) | 93 (92.1%) |
| Health Care & Social Assistance | 126 (25.8%) | 362 (74.2%) |
| Arts, Entertainment & Recreation | 5 (29.4%) | 12 (70.6%) |
| Accommodation & Food Services | 206 (77.1%) | 61 (22.9%) |
| Public Administration | 71 (65.7%) | 37 (34.3%) |
| Total | 1,465 (56.3%) | 1,138 (43.7%) |
Education in Town and Country
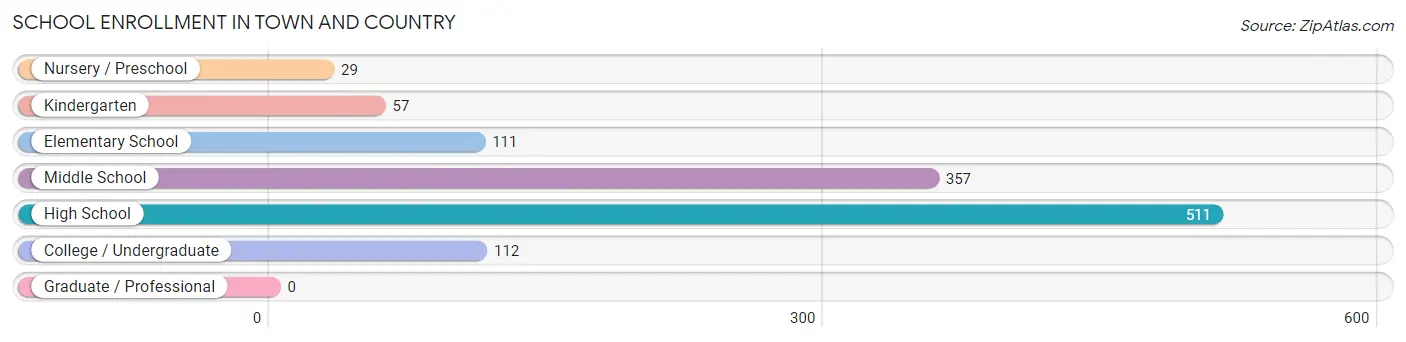
School Enrollment in Town and Country
The most common levels of schooling among the 1,177 students in Town and Country are high school (511 | 43.4%), middle school (357 | 30.3%), and college / undergraduate (112 | 9.5%).
| School Level | # Students | % Students |
| Nursery / Preschool | 29 | 2.5% |
| Kindergarten | 57 | 4.8% |
| Elementary School | 111 | 9.4% |
| Middle School | 357 | 30.3% |
| High School | 511 | 43.4% |
| College / Undergraduate | 112 | 9.5% |
| Graduate / Professional | 0 | 0.0% |
| Total | 1,177 | 100.0% |
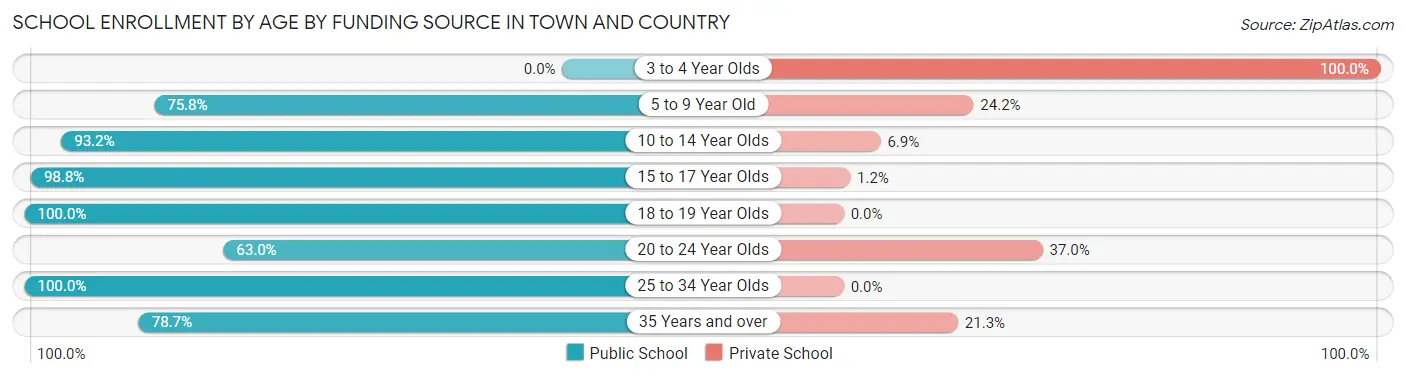
School Enrollment by Age by Funding Source in Town and Country
Out of a total of 1,177 students who are enrolled in schools in Town and Country, 97 (8.2%) attend a private institution, while the remaining 1,080 (91.8%) are enrolled in public schools. The age group of 3 to 4 year olds has the highest likelihood of being enrolled in private schools, with 7 (100.0% in the age bracket) enrolled. Conversely, the age group of 18 to 19 year olds has the lowest likelihood of being enrolled in a private school, with 88 (100.0% in the age bracket) attending a public institution.
| Age Bracket | Public School | Private School |
| 3 to 4 Year Olds | 0 (0.0%) | 7 (100.0%) |
| 5 to 9 Year Old | 113 (75.8%) | 36 (24.2%) |
| 10 to 14 Year Olds | 381 (93.1%) | 28 (6.9%) |
| 15 to 17 Year Olds | 415 (98.8%) | 5 (1.2%) |
| 18 to 19 Year Olds | 88 (100.0%) | 0 (0.0%) |
| 20 to 24 Year Olds | 17 (63.0%) | 10 (37.0%) |
| 25 to 34 Year Olds | 30 (100.0%) | 0 (0.0%) |
| 35 Years and over | 37 (78.7%) | 10 (21.3%) |
| Total | 1,080 (91.8%) | 97 (8.2%) |
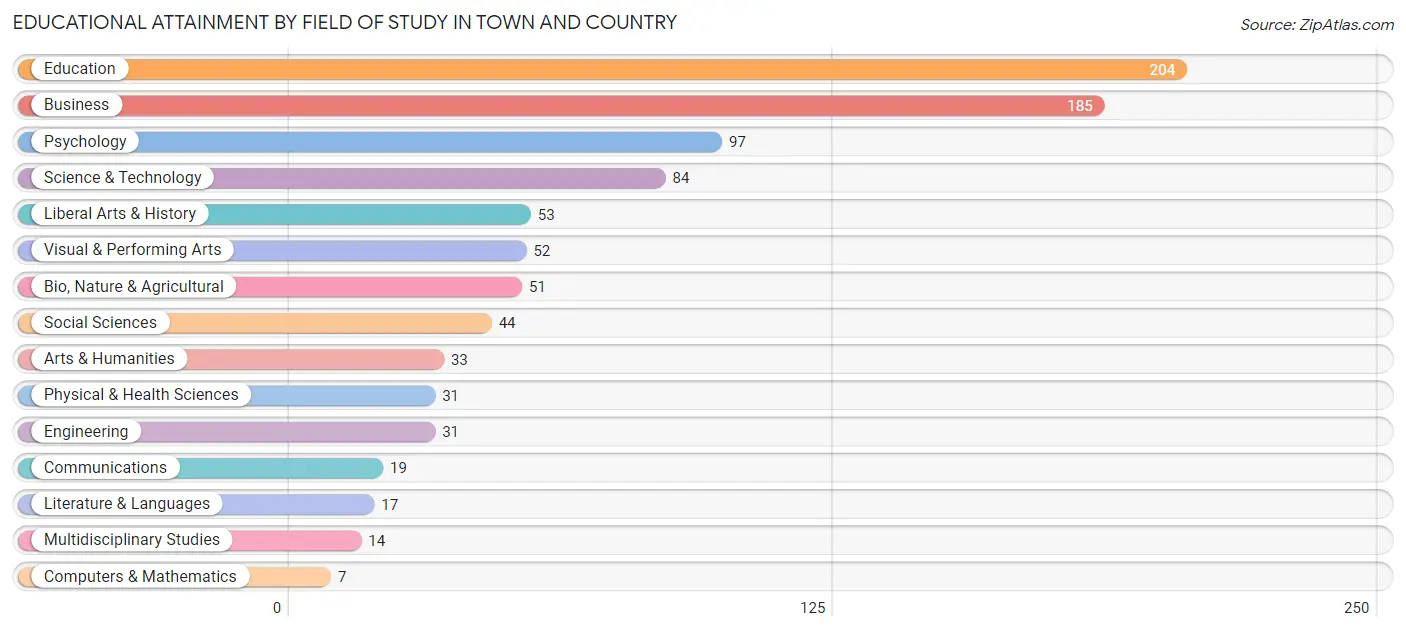
Educational Attainment by Field of Study in Town and Country
Education (204 | 22.1%), business (185 | 20.1%), psychology (97 | 10.5%), science & technology (84 | 9.1%), and liberal arts & history (53 | 5.8%) are the most common fields of study among 922 individuals in Town and Country who have obtained a bachelor's degree or higher.
| Field of Study | # Graduates | % Graduates |
| Computers & Mathematics | 7 | 0.8% |
| Bio, Nature & Agricultural | 51 | 5.5% |
| Physical & Health Sciences | 31 | 3.4% |
| Psychology | 97 | 10.5% |
| Social Sciences | 44 | 4.8% |
| Engineering | 31 | 3.4% |
| Multidisciplinary Studies | 14 | 1.5% |
| Science & Technology | 84 | 9.1% |
| Business | 185 | 20.1% |
| Education | 204 | 22.1% |
| Literature & Languages | 17 | 1.8% |
| Liberal Arts & History | 53 | 5.8% |
| Visual & Performing Arts | 52 | 5.6% |
| Communications | 19 | 2.1% |
| Arts & Humanities | 33 | 3.6% |
| Total | 922 | 100.0% |
Transportation & Commute in Town and Country
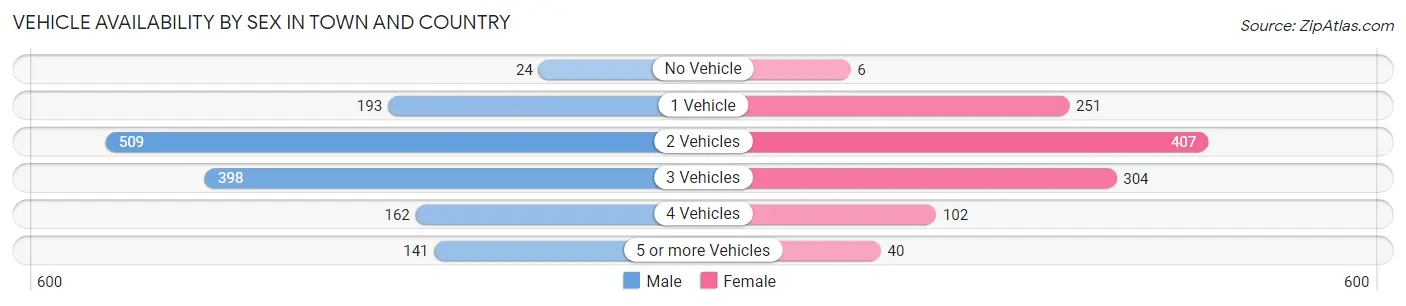
Vehicle Availability by Sex in Town and Country
The most prevalent vehicle ownership categories in Town and Country are males with 2 vehicles (509, accounting for 35.7%) and females with 2 vehicles (407, making up 45.9%).
| Vehicles Available | Male | Female |
| No Vehicle | 24 (1.7%) | 6 (0.5%) |
| 1 Vehicle | 193 (13.5%) | 251 (22.6%) |
| 2 Vehicles | 509 (35.7%) | 407 (36.7%) |
| 3 Vehicles | 398 (27.9%) | 304 (27.4%) |
| 4 Vehicles | 162 (11.4%) | 102 (9.2%) |
| 5 or more Vehicles | 141 (9.9%) | 40 (3.6%) |
| Total | 1,427 (100.0%) | 1,110 (100.0%) |
Commute Time in Town and Country
The most frequently occuring commute durations in Town and Country are 20 to 24 minutes (476 commuters, 22.0%), 15 to 19 minutes (462 commuters, 21.4%), and 10 to 14 minutes (288 commuters, 13.3%).
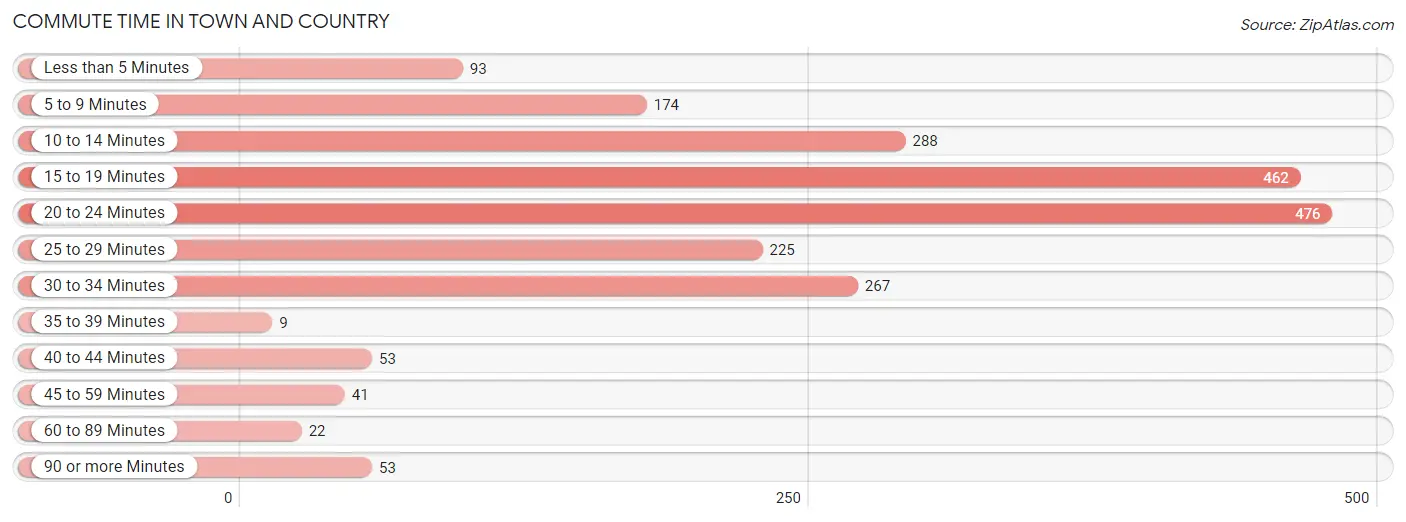
| Commute Time | # Commuters | % Commuters |
| Less than 5 Minutes | 93 | 4.3% |
| 5 to 9 Minutes | 174 | 8.0% |
| 10 to 14 Minutes | 288 | 13.3% |
| 15 to 19 Minutes | 462 | 21.4% |
| 20 to 24 Minutes | 476 | 22.0% |
| 25 to 29 Minutes | 225 | 10.4% |
| 30 to 34 Minutes | 267 | 12.3% |
| 35 to 39 Minutes | 9 | 0.4% |
| 40 to 44 Minutes | 53 | 2.5% |
| 45 to 59 Minutes | 41 | 1.9% |
| 60 to 89 Minutes | 22 | 1.0% |
| 90 or more Minutes | 53 | 2.5% |
Commute Time by Sex in Town and Country
The most common commute times in Town and Country are 20 to 24 minutes (227 commuters, 18.1%) for males and 15 to 19 minutes (249 commuters, 27.4%) for females.
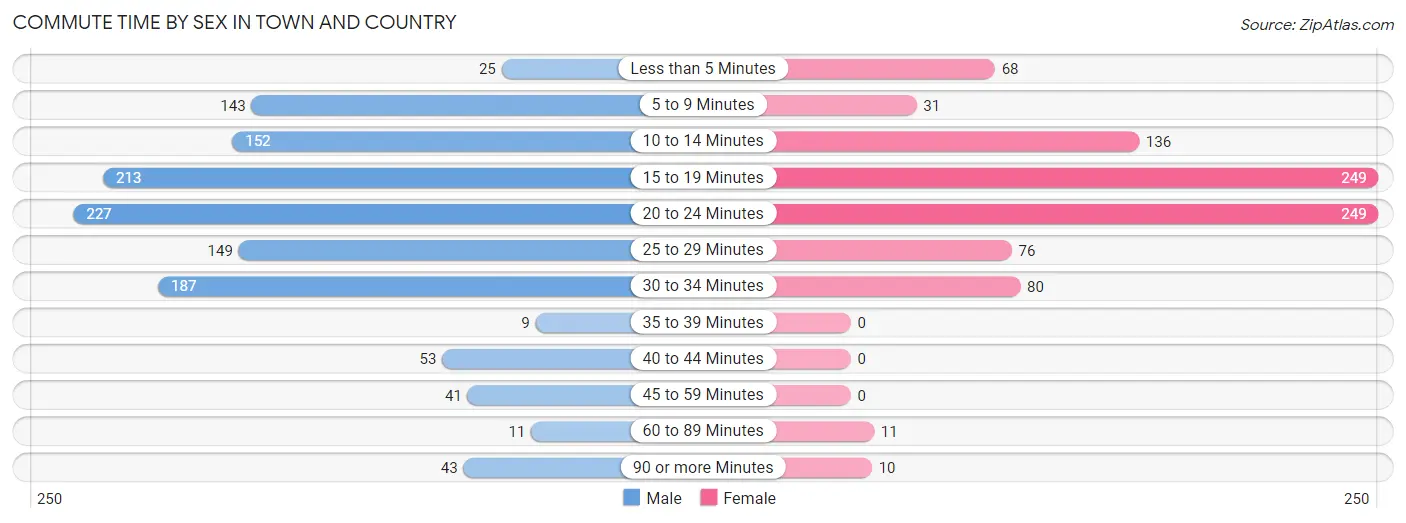
| Commute Time | Male | Female |
| Less than 5 Minutes | 25 (2.0%) | 68 (7.5%) |
| 5 to 9 Minutes | 143 (11.4%) | 31 (3.4%) |
| 10 to 14 Minutes | 152 (12.1%) | 136 (14.9%) |
| 15 to 19 Minutes | 213 (17.0%) | 249 (27.4%) |
| 20 to 24 Minutes | 227 (18.1%) | 249 (27.4%) |
| 25 to 29 Minutes | 149 (11.9%) | 76 (8.4%) |
| 30 to 34 Minutes | 187 (14.9%) | 80 (8.8%) |
| 35 to 39 Minutes | 9 (0.7%) | 0 (0.0%) |
| 40 to 44 Minutes | 53 (4.2%) | 0 (0.0%) |
| 45 to 59 Minutes | 41 (3.3%) | 0 (0.0%) |
| 60 to 89 Minutes | 11 (0.9%) | 11 (1.2%) |
| 90 or more Minutes | 43 (3.4%) | 10 (1.1%) |
Time of Departure to Work by Sex in Town and Country
The most frequent times of departure to work in Town and Country are 8:30 AM to 8:59 AM (157, 12.5%) for males and 8:00 AM to 8:29 AM (179, 19.7%) for females.
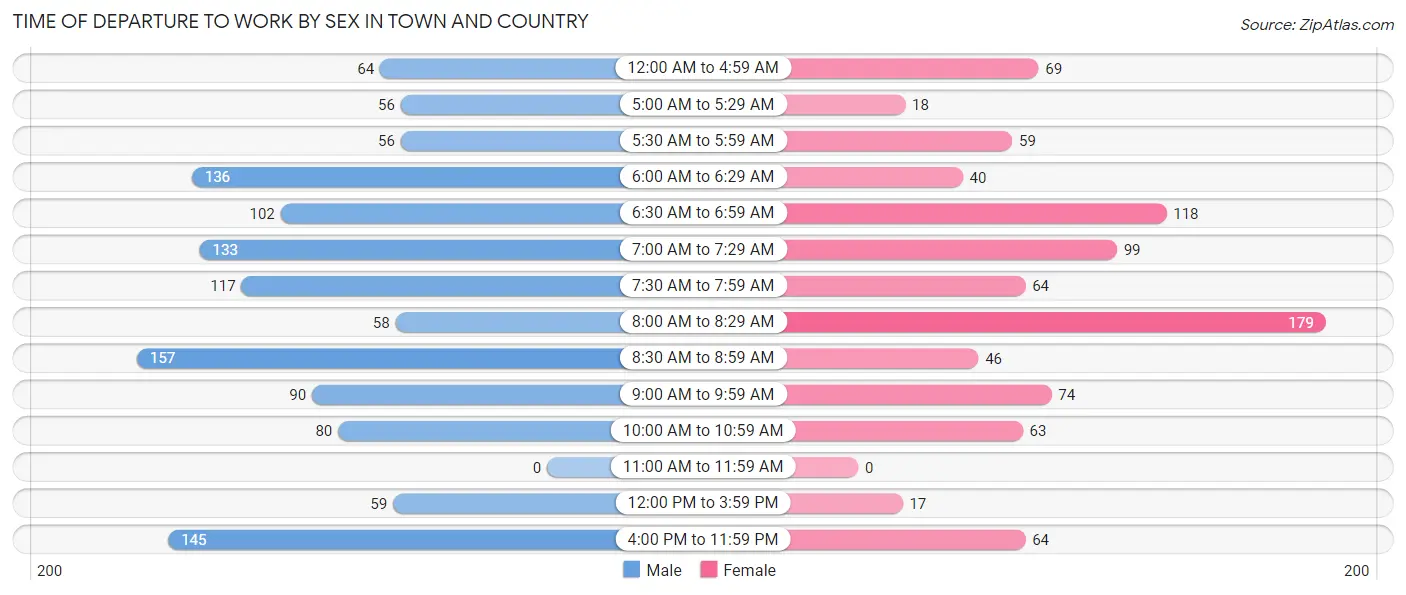
| Time of Departure | Male | Female |
| 12:00 AM to 4:59 AM | 64 (5.1%) | 69 (7.6%) |
| 5:00 AM to 5:29 AM | 56 (4.5%) | 18 (2.0%) |
| 5:30 AM to 5:59 AM | 56 (4.5%) | 59 (6.5%) |
| 6:00 AM to 6:29 AM | 136 (10.8%) | 40 (4.4%) |
| 6:30 AM to 6:59 AM | 102 (8.1%) | 118 (13.0%) |
| 7:00 AM to 7:29 AM | 133 (10.6%) | 99 (10.9%) |
| 7:30 AM to 7:59 AM | 117 (9.3%) | 64 (7.0%) |
| 8:00 AM to 8:29 AM | 58 (4.6%) | 179 (19.7%) |
| 8:30 AM to 8:59 AM | 157 (12.5%) | 46 (5.1%) |
| 9:00 AM to 9:59 AM | 90 (7.2%) | 74 (8.1%) |
| 10:00 AM to 10:59 AM | 80 (6.4%) | 63 (6.9%) |
| 11:00 AM to 11:59 AM | 0 (0.0%) | 0 (0.0%) |
| 12:00 PM to 3:59 PM | 59 (4.7%) | 17 (1.9%) |
| 4:00 PM to 11:59 PM | 145 (11.6%) | 64 (7.0%) |
| Total | 1,253 (100.0%) | 910 (100.0%) |
Housing Occupancy in Town and Country
Occupancy by Ownership in Town and Country
Of the total 2,047 dwellings in Town and Country, owner-occupied units account for 1,616 (78.9%), while renter-occupied units make up 431 (21.1%).
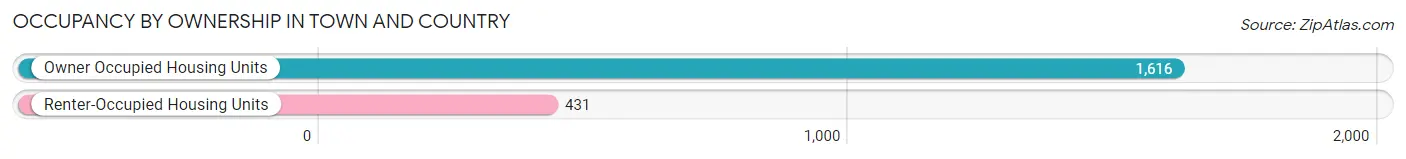
| Occupancy | # Housing Units | % Housing Units |
| Owner Occupied Housing Units | 1,616 | 78.9% |
| Renter-Occupied Housing Units | 431 | 21.1% |
| Total Occupied Housing Units | 2,047 | 100.0% |
Occupancy by Household Size in Town and Country
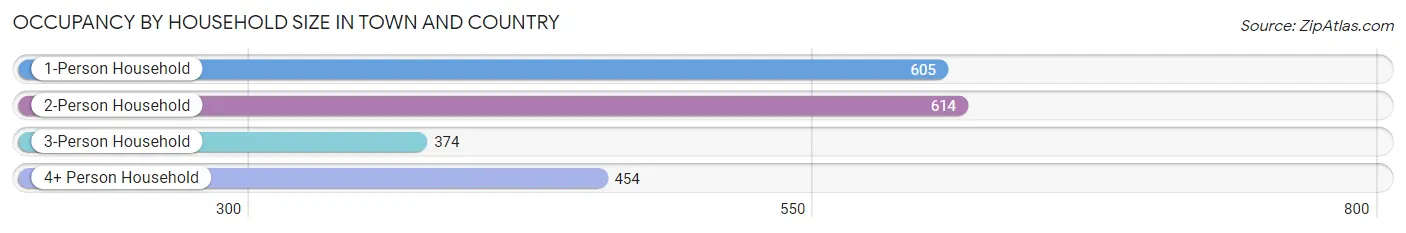
| Household Size | # Housing Units | % Housing Units |
| 1-Person Household | 605 | 29.6% |
| 2-Person Household | 614 | 30.0% |
| 3-Person Household | 374 | 18.3% |
| 4+ Person Household | 454 | 22.2% |
| Total Housing Units | 2,047 | 100.0% |
Occupancy by Ownership by Household Size in Town and Country
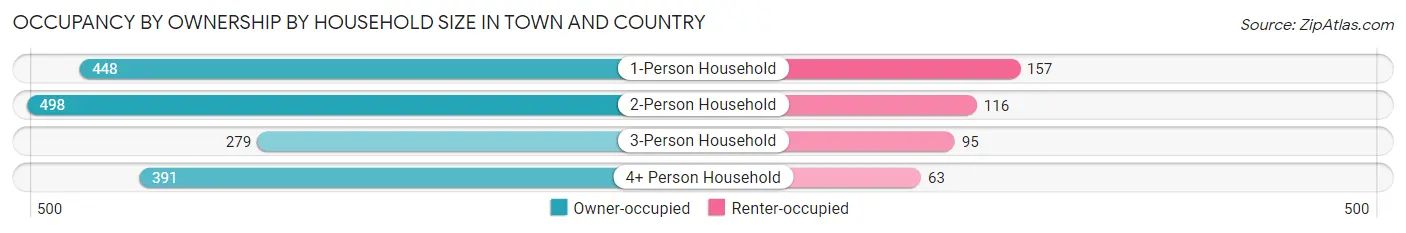
| Household Size | Owner-occupied | Renter-occupied |
| 1-Person Household | 448 (74.1%) | 157 (26.0%) |
| 2-Person Household | 498 (81.1%) | 116 (18.9%) |
| 3-Person Household | 279 (74.6%) | 95 (25.4%) |
| 4+ Person Household | 391 (86.1%) | 63 (13.9%) |
| Total Housing Units | 1,616 (78.9%) | 431 (21.1%) |
Occupancy by Educational Attainment in Town and Country
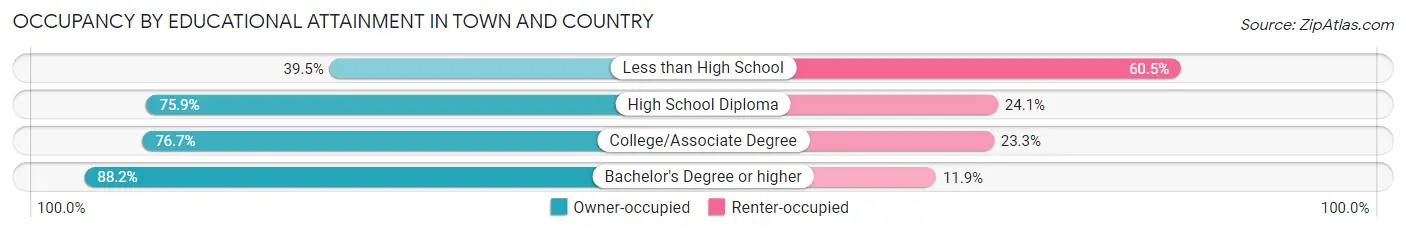
| Household Size | Owner-occupied | Renter-occupied |
| Less than High School | 17 (39.5%) | 26 (60.5%) |
| High School Diploma | 330 (75.9%) | 105 (24.1%) |
| College/Associate Degree | 763 (76.7%) | 232 (23.3%) |
| Bachelor's Degree or higher | 506 (88.1%) | 68 (11.8%) |
Occupancy by Age of Householder in Town and Country
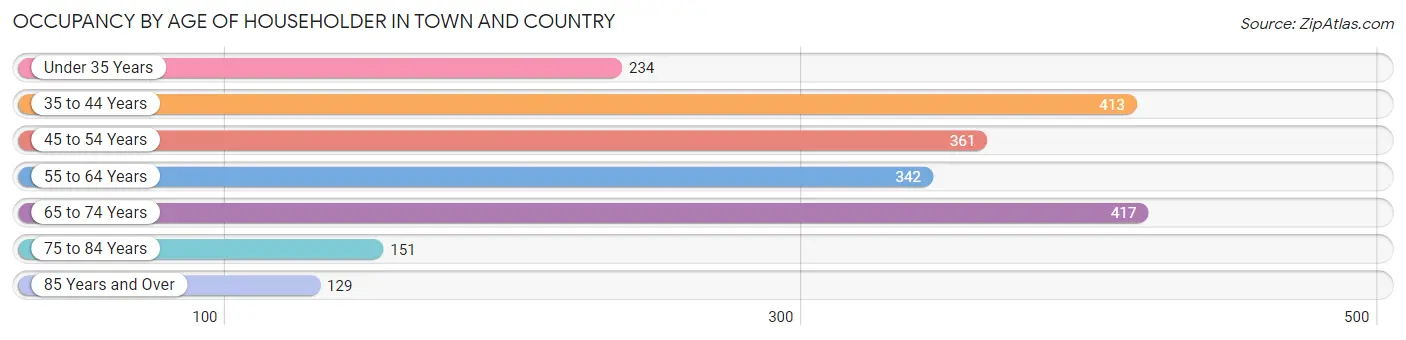
| Age Bracket | # Households | % Households |
| Under 35 Years | 234 | 11.4% |
| 35 to 44 Years | 413 | 20.2% |
| 45 to 54 Years | 361 | 17.6% |
| 55 to 64 Years | 342 | 16.7% |
| 65 to 74 Years | 417 | 20.4% |
| 75 to 84 Years | 151 | 7.4% |
| 85 Years and Over | 129 | 6.3% |
| Total | 2,047 | 100.0% |
Housing Finances in Town and Country
Median Income by Occupancy in Town and Country
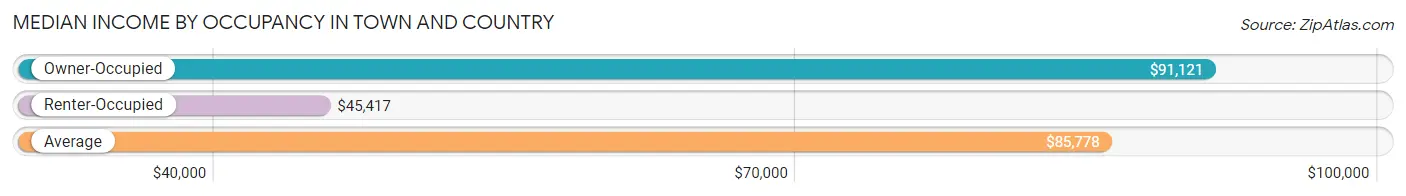
| Occupancy Type | # Households | Median Income |
| Owner-Occupied | 1,616 (78.9%) | $91,121 |
| Renter-Occupied | 431 (21.1%) | $45,417 |
| Average | 2,047 (100.0%) | $85,778 |
Occupancy by Householder Income Bracket in Town and Country
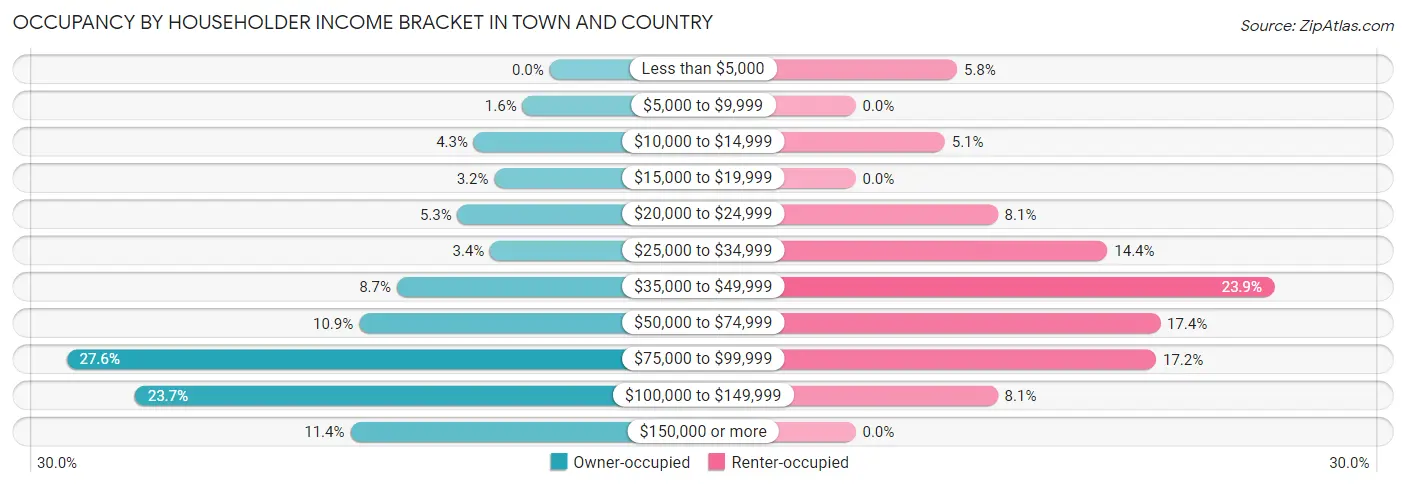
| Income Bracket | Owner-occupied | Renter-occupied |
| Less than $5,000 | 0 (0.0%) | 25 (5.8%) |
| $5,000 to $9,999 | 25 (1.5%) | 0 (0.0%) |
| $10,000 to $14,999 | 70 (4.3%) | 22 (5.1%) |
| $15,000 to $19,999 | 51 (3.2%) | 0 (0.0%) |
| $20,000 to $24,999 | 85 (5.3%) | 35 (8.1%) |
| $25,000 to $34,999 | 55 (3.4%) | 62 (14.4%) |
| $35,000 to $49,999 | 141 (8.7%) | 103 (23.9%) |
| $50,000 to $74,999 | 176 (10.9%) | 75 (17.4%) |
| $75,000 to $99,999 | 446 (27.6%) | 74 (17.2%) |
| $100,000 to $149,999 | 383 (23.7%) | 35 (8.1%) |
| $150,000 or more | 184 (11.4%) | 0 (0.0%) |
| Total | 1,616 (100.0%) | 431 (100.0%) |
Monthly Housing Cost Tiers in Town and Country
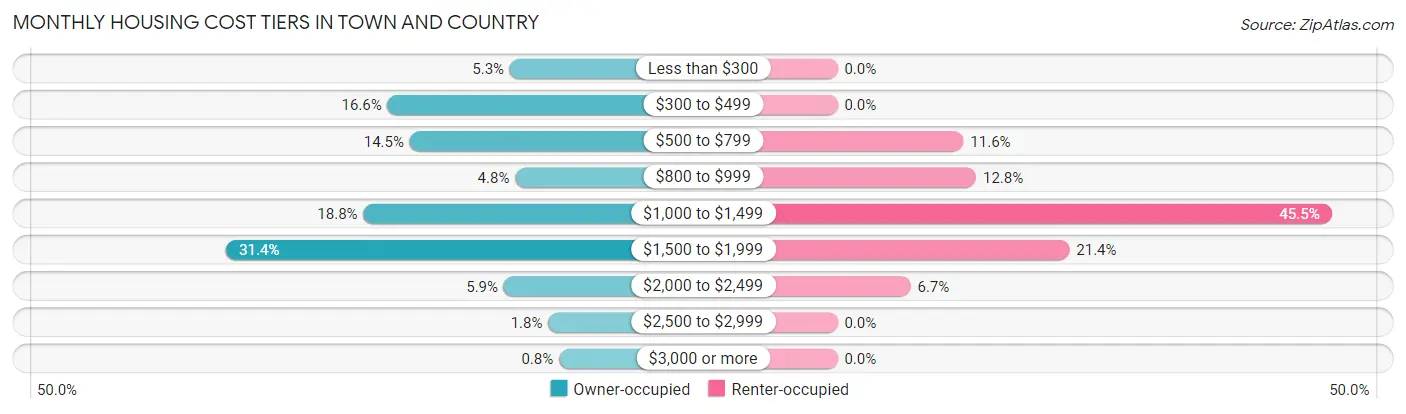
| Monthly Cost | Owner-occupied | Renter-occupied |
| Less than $300 | 86 (5.3%) | 0 (0.0%) |
| $300 to $499 | 268 (16.6%) | 0 (0.0%) |
| $500 to $799 | 235 (14.5%) | 50 (11.6%) |
| $800 to $999 | 78 (4.8%) | 55 (12.8%) |
| $1,000 to $1,499 | 304 (18.8%) | 196 (45.5%) |
| $1,500 to $1,999 | 508 (31.4%) | 92 (21.3%) |
| $2,000 to $2,499 | 95 (5.9%) | 29 (6.7%) |
| $2,500 to $2,999 | 29 (1.8%) | 0 (0.0%) |
| $3,000 or more | 13 (0.8%) | 0 (0.0%) |
| Total | 1,616 (100.0%) | 431 (100.0%) |
Physical Housing Characteristics in Town and Country
Housing Structures in Town and Country
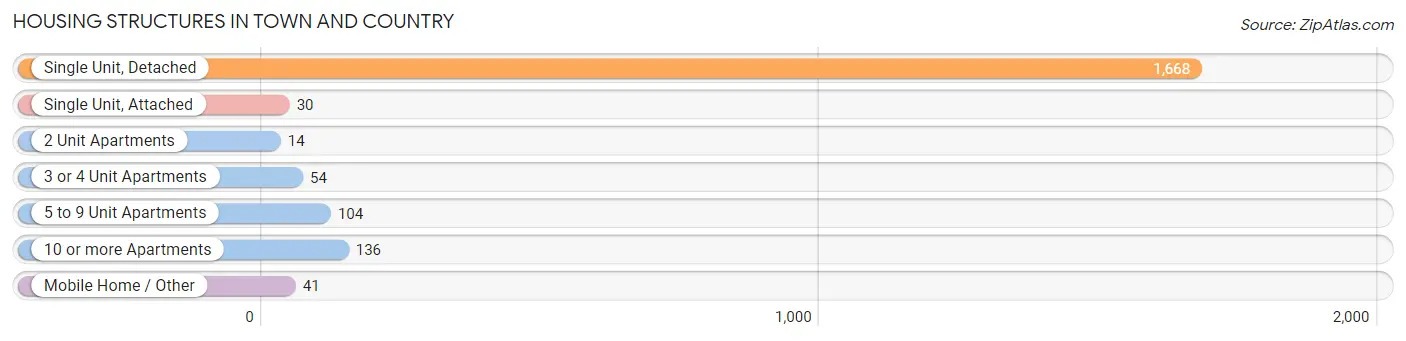
| Structure Type | # Housing Units | % Housing Units |
| Single Unit, Detached | 1,668 | 81.5% |
| Single Unit, Attached | 30 | 1.5% |
| 2 Unit Apartments | 14 | 0.7% |
| 3 or 4 Unit Apartments | 54 | 2.6% |
| 5 to 9 Unit Apartments | 104 | 5.1% |
| 10 or more Apartments | 136 | 6.6% |
| Mobile Home / Other | 41 | 2.0% |
| Total | 2,047 | 100.0% |
Housing Structures by Occupancy in Town and Country
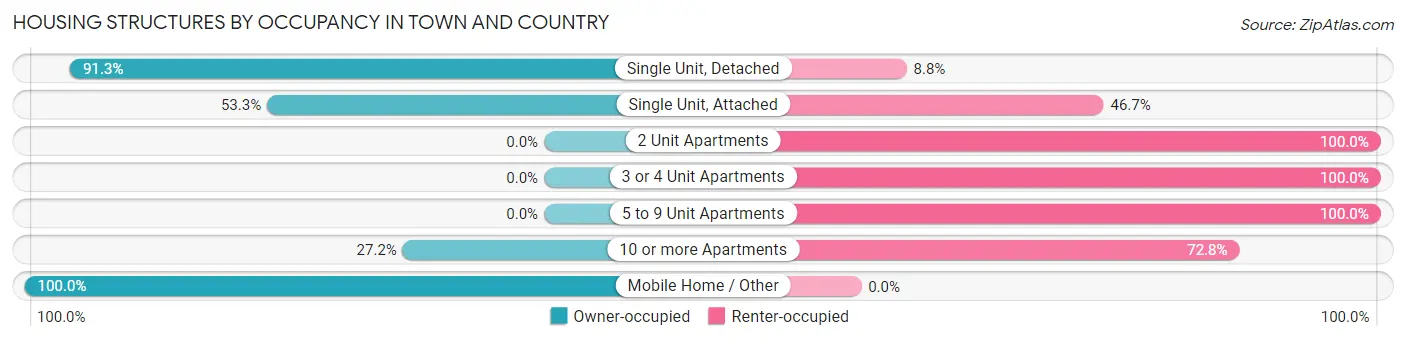
| Structure Type | Owner-occupied | Renter-occupied |
| Single Unit, Detached | 1,522 (91.2%) | 146 (8.7%) |
| Single Unit, Attached | 16 (53.3%) | 14 (46.7%) |
| 2 Unit Apartments | 0 (0.0%) | 14 (100.0%) |
| 3 or 4 Unit Apartments | 0 (0.0%) | 54 (100.0%) |
| 5 to 9 Unit Apartments | 0 (0.0%) | 104 (100.0%) |
| 10 or more Apartments | 37 (27.2%) | 99 (72.8%) |
| Mobile Home / Other | 41 (100.0%) | 0 (0.0%) |
| Total | 1,616 (78.9%) | 431 (21.1%) |
Housing Structures by Number of Rooms in Town and Country
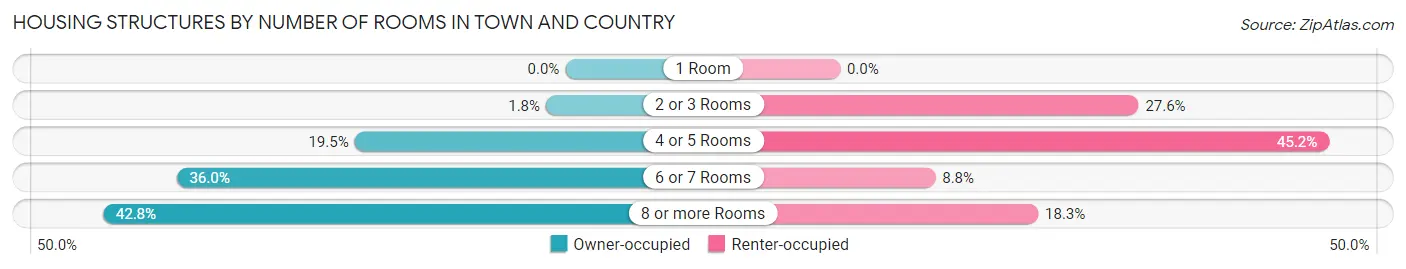
| Number of Rooms | Owner-occupied | Renter-occupied |
| 1 Room | 0 (0.0%) | 0 (0.0%) |
| 2 or 3 Rooms | 29 (1.8%) | 119 (27.6%) |
| 4 or 5 Rooms | 315 (19.5%) | 195 (45.2%) |
| 6 or 7 Rooms | 581 (35.9%) | 38 (8.8%) |
| 8 or more Rooms | 691 (42.8%) | 79 (18.3%) |
| Total | 1,616 (100.0%) | 431 (100.0%) |
Housing Structure by Heating Type in Town and Country
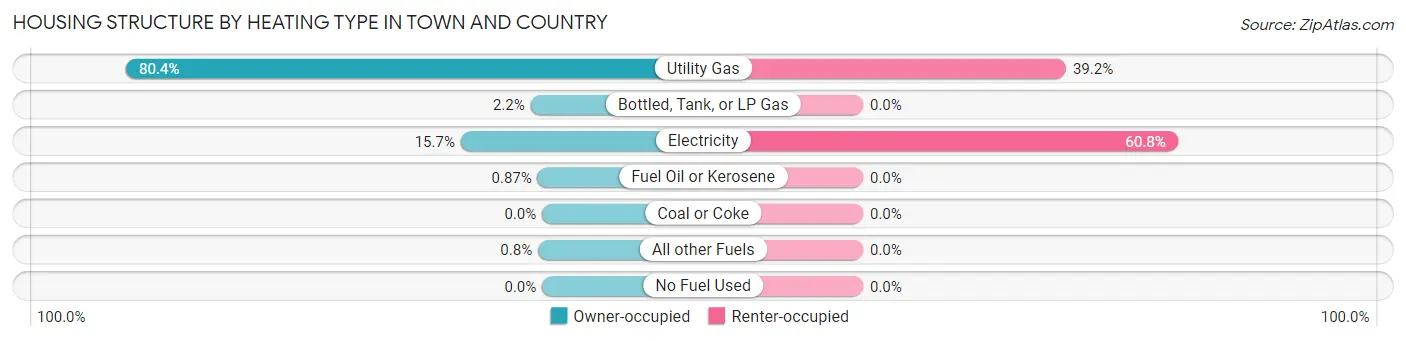
| Heating Type | Owner-occupied | Renter-occupied |
| Utility Gas | 1,299 (80.4%) | 169 (39.2%) |
| Bottled, Tank, or LP Gas | 36 (2.2%) | 0 (0.0%) |
| Electricity | 254 (15.7%) | 262 (60.8%) |
| Fuel Oil or Kerosene | 14 (0.9%) | 0 (0.0%) |
| Coal or Coke | 0 (0.0%) | 0 (0.0%) |
| All other Fuels | 13 (0.8%) | 0 (0.0%) |
| No Fuel Used | 0 (0.0%) | 0 (0.0%) |
| Total | 1,616 (100.0%) | 431 (100.0%) |
Household Vehicle Usage in Town and Country
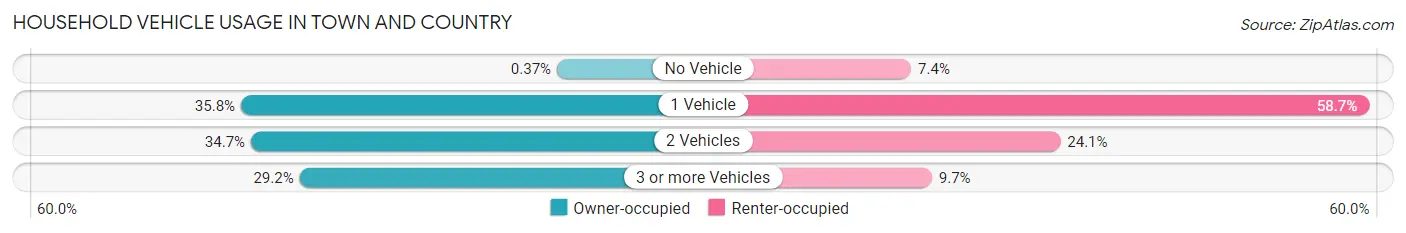
| Vehicles per Household | Owner-occupied | Renter-occupied |
| No Vehicle | 6 (0.4%) | 32 (7.4%) |
| 1 Vehicle | 578 (35.8%) | 253 (58.7%) |
| 2 Vehicles | 560 (34.6%) | 104 (24.1%) |
| 3 or more Vehicles | 472 (29.2%) | 42 (9.7%) |
| Total | 1,616 (100.0%) | 431 (100.0%) |
Real Estate & Mortgages in Town and Country
Real Estate and Mortgage Overview in Town and Country
| Characteristic | Without Mortgage | With Mortgage |
| Housing Units | 592 | 1,024 |
| Median Property Value | $267,100 | $297,200 |
| Median Household Income | $62,778 | $169 |
| Monthly Housing Costs | $473 | $13 |
| Real Estate Taxes | $2,411 | $37 |
Property Value by Mortgage Status in Town and Country
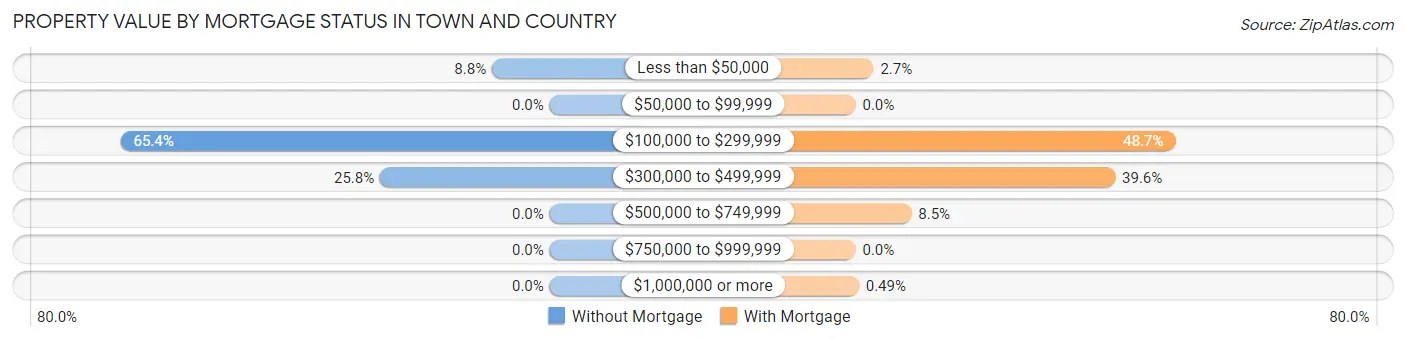
| Property Value | Without Mortgage | With Mortgage |
| Less than $50,000 | 52 (8.8%) | 28 (2.7%) |
| $50,000 to $99,999 | 0 (0.0%) | 0 (0.0%) |
| $100,000 to $299,999 | 387 (65.4%) | 499 (48.7%) |
| $300,000 to $499,999 | 153 (25.8%) | 405 (39.6%) |
| $500,000 to $749,999 | 0 (0.0%) | 87 (8.5%) |
| $750,000 to $999,999 | 0 (0.0%) | 0 (0.0%) |
| $1,000,000 or more | 0 (0.0%) | 5 (0.5%) |
| Total | 592 (100.0%) | 1,024 (100.0%) |
Household Income by Mortgage Status in Town and Country
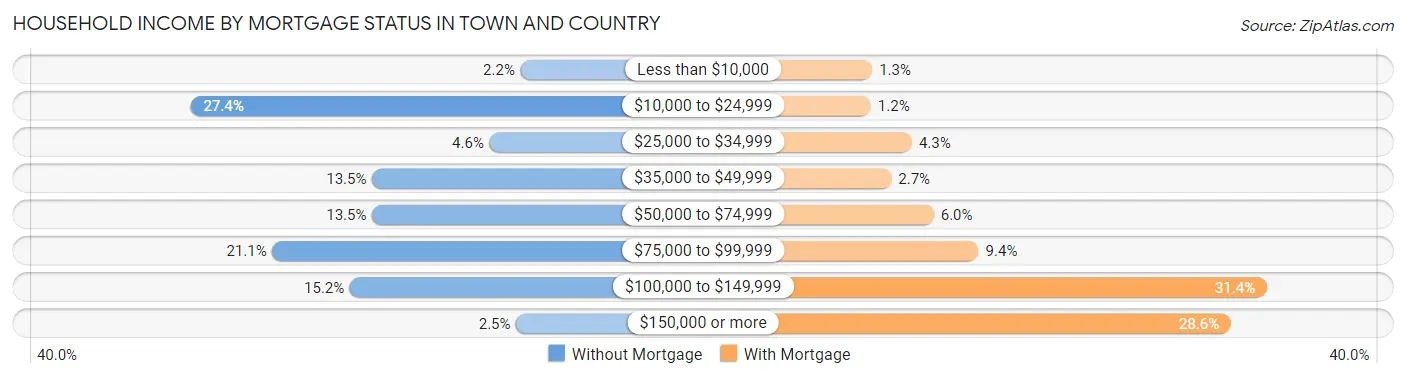
| Household Income | Without Mortgage | With Mortgage |
| Less than $10,000 | 13 (2.2%) | 13 (1.3%) |
| $10,000 to $24,999 | 162 (27.4%) | 12 (1.2%) |
| $25,000 to $34,999 | 27 (4.6%) | 44 (4.3%) |
| $35,000 to $49,999 | 80 (13.5%) | 28 (2.7%) |
| $50,000 to $74,999 | 80 (13.5%) | 61 (6.0%) |
| $75,000 to $99,999 | 125 (21.1%) | 96 (9.4%) |
| $100,000 to $149,999 | 90 (15.2%) | 321 (31.4%) |
| $150,000 or more | 15 (2.5%) | 293 (28.6%) |
| Total | 592 (100.0%) | 1,024 (100.0%) |
Property Value to Household Income Ratio in Town and Country
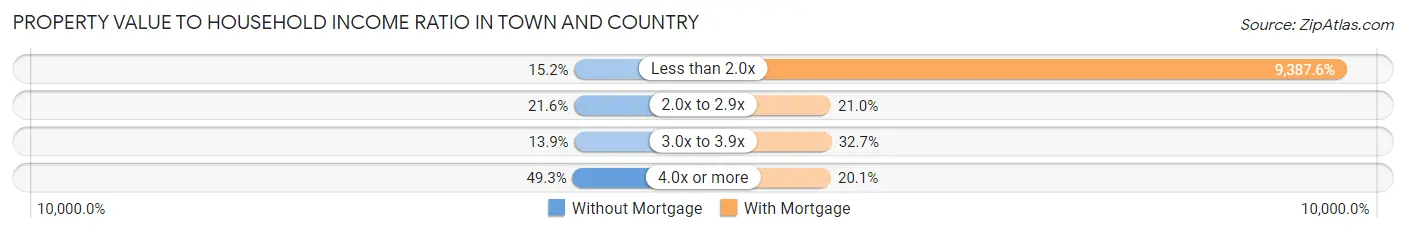
| Value-to-Income Ratio | Without Mortgage | With Mortgage |
| Less than 2.0x | 90 (15.2%) | 96,129 (9,387.6%) |
| 2.0x to 2.9x | 128 (21.6%) | 215 (21.0%) |
| 3.0x to 3.9x | 82 (13.9%) | 335 (32.7%) |
| 4.0x or more | 292 (49.3%) | 206 (20.1%) |
| Total | 592 (100.0%) | 1,024 (100.0%) |
Real Estate Taxes by Mortgage Status in Town and Country
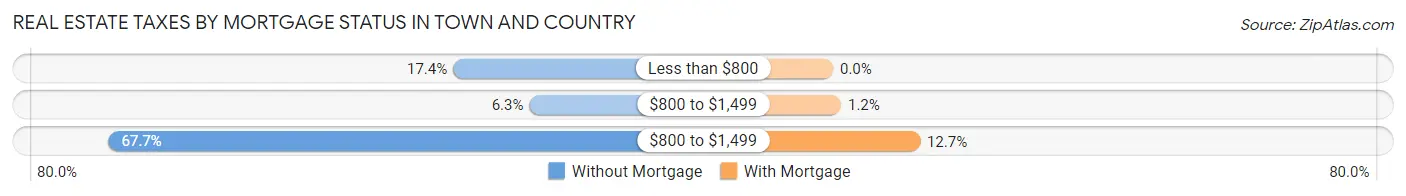
| Property Taxes | Without Mortgage | With Mortgage |
| Less than $800 | 103 (17.4%) | 0 (0.0%) |
| $800 to $1,499 | 37 (6.2%) | 12 (1.2%) |
| $800 to $1,499 | 401 (67.7%) | 130 (12.7%) |
| Total | 592 (100.0%) | 1,024 (100.0%) |
Health & Disability in Town and Country
Health Insurance Coverage by Age in Town and Country
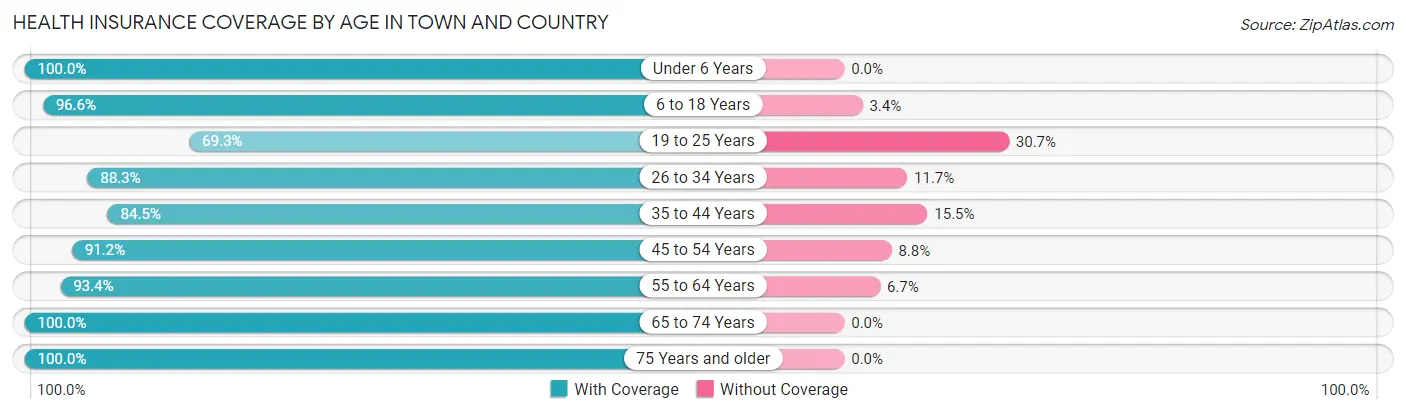
| Age Bracket | With Coverage | Without Coverage |
| Under 6 Years | 237 (100.0%) | 0 (0.0%) |
| 6 to 18 Years | 1,059 (96.6%) | 37 (3.4%) |
| 19 to 25 Years | 131 (69.3%) | 58 (30.7%) |
| 26 to 34 Years | 460 (88.3%) | 61 (11.7%) |
| 35 to 44 Years | 780 (84.5%) | 143 (15.5%) |
| 45 to 54 Years | 632 (91.2%) | 61 (8.8%) |
| 55 to 64 Years | 576 (93.3%) | 41 (6.7%) |
| 65 to 74 Years | 539 (100.0%) | 0 (0.0%) |
| 75 Years and older | 414 (100.0%) | 0 (0.0%) |
| Total | 4,828 (92.3%) | 401 (7.7%) |
Health Insurance Coverage by Citizenship Status in Town and Country
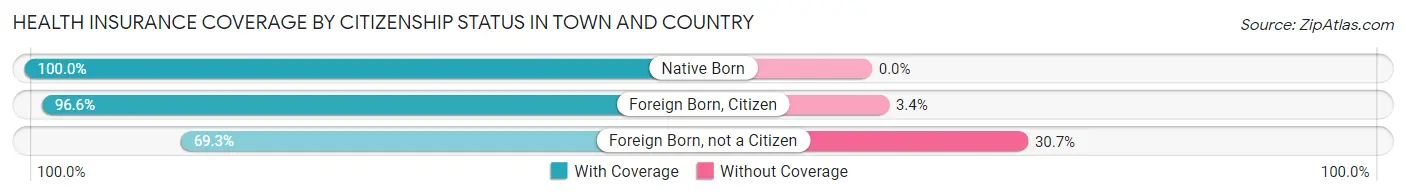
| Citizenship Status | With Coverage | Without Coverage |
| Native Born | 237 (100.0%) | 0 (0.0%) |
| Foreign Born, Citizen | 1,059 (96.6%) | 37 (3.4%) |
| Foreign Born, not a Citizen | 131 (69.3%) | 58 (30.7%) |
Health Insurance Coverage by Household Income in Town and Country
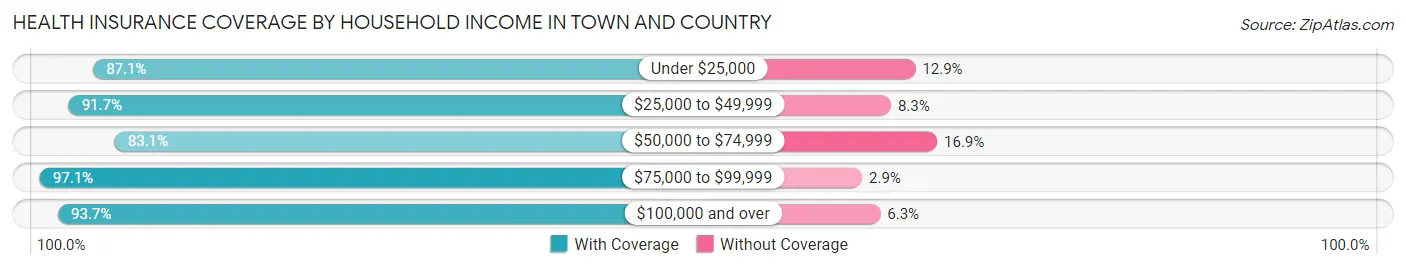
| Household Income | With Coverage | Without Coverage |
| Under $25,000 | 427 (87.1%) | 63 (12.9%) |
| $25,000 to $49,999 | 676 (91.7%) | 61 (8.3%) |
| $50,000 to $74,999 | 599 (83.1%) | 122 (16.9%) |
| $75,000 to $99,999 | 1,456 (97.1%) | 43 (2.9%) |
| $100,000 and over | 1,670 (93.7%) | 112 (6.3%) |
Public vs Private Health Insurance Coverage by Age in Town and Country
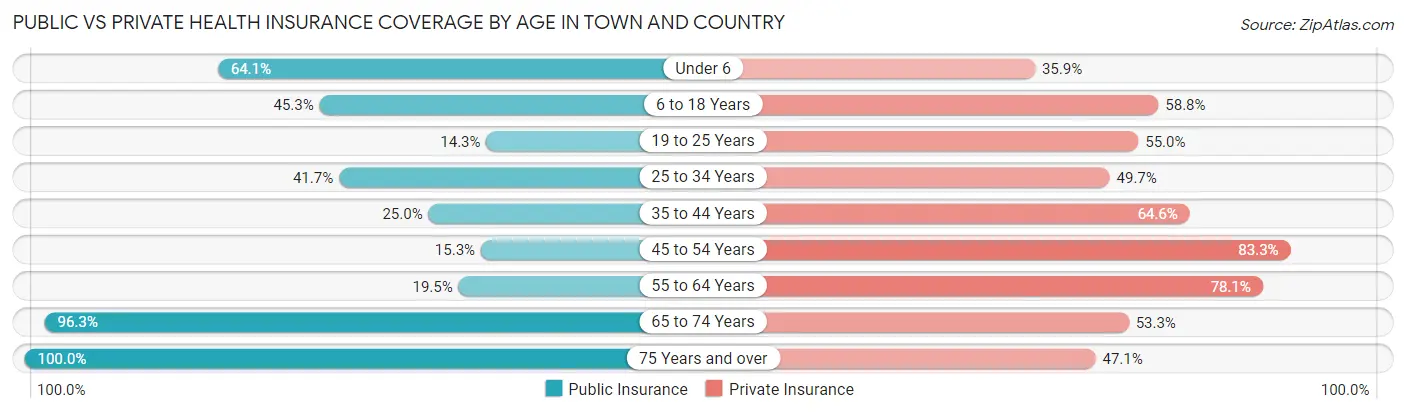
| Age Bracket | Public Insurance | Private Insurance |
| Under 6 | 152 (64.1%) | 85 (35.9%) |
| 6 to 18 Years | 496 (45.3%) | 644 (58.8%) |
| 19 to 25 Years | 27 (14.3%) | 104 (55.0%) |
| 25 to 34 Years | 217 (41.6%) | 259 (49.7%) |
| 35 to 44 Years | 231 (25.0%) | 596 (64.6%) |
| 45 to 54 Years | 106 (15.3%) | 577 (83.3%) |
| 55 to 64 Years | 120 (19.5%) | 482 (78.1%) |
| 65 to 74 Years | 519 (96.3%) | 287 (53.2%) |
| 75 Years and over | 414 (100.0%) | 195 (47.1%) |
| Total | 2,282 (43.6%) | 3,229 (61.8%) |
Disability Status by Sex by Age in Town and Country
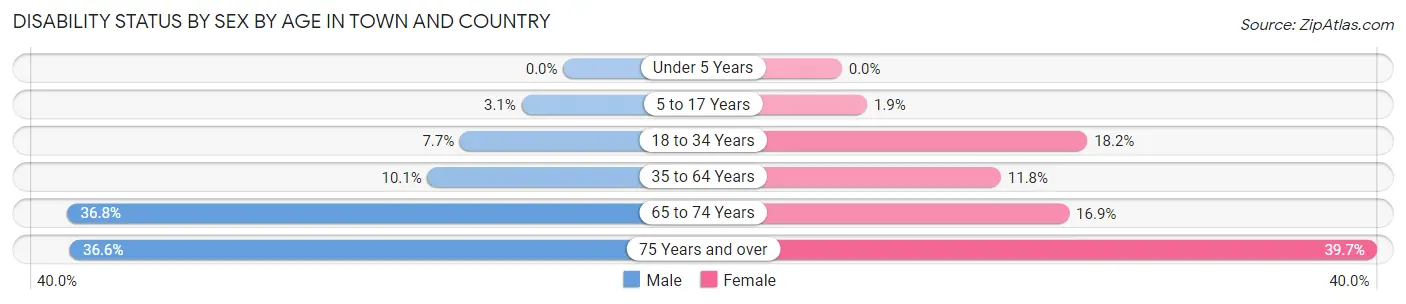
| Age Bracket | Male | Female |
| Under 5 Years | 0 (0.0%) | 0 (0.0%) |
| 5 to 17 Years | 17 (3.1%) | 9 (1.9%) |
| 18 to 34 Years | 31 (7.7%) | 80 (18.2%) |
| 35 to 64 Years | 121 (10.1%) | 122 (11.8%) |
| 65 to 74 Years | 85 (36.8%) | 52 (16.9%) |
| 75 Years and over | 52 (36.6%) | 108 (39.7%) |
Disability Class by Sex by Age in Town and Country
Disability Class: Hearing Difficulty
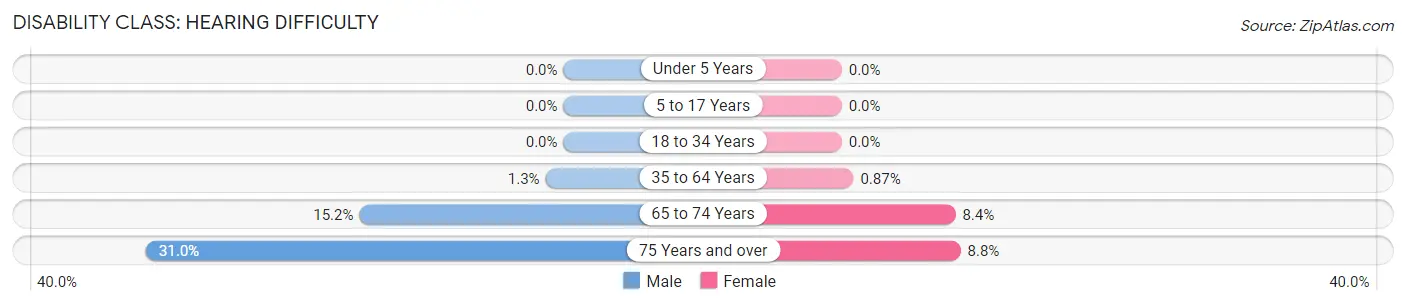
| Age Bracket | Male | Female |
| Under 5 Years | 0 (0.0%) | 0 (0.0%) |
| 5 to 17 Years | 0 (0.0%) | 0 (0.0%) |
| 18 to 34 Years | 0 (0.0%) | 0 (0.0%) |
| 35 to 64 Years | 16 (1.3%) | 9 (0.9%) |
| 65 to 74 Years | 35 (15.1%) | 26 (8.4%) |
| 75 Years and over | 44 (31.0%) | 24 (8.8%) |
Disability Class: Vision Difficulty
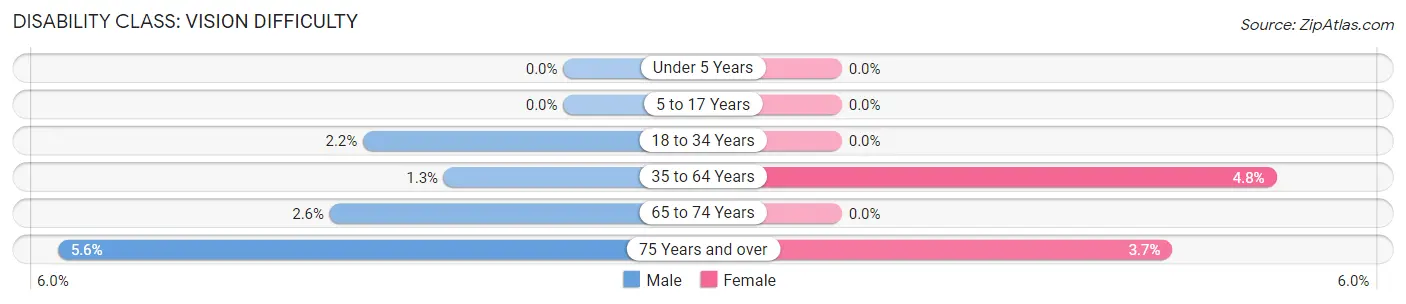
| Age Bracket | Male | Female |
| Under 5 Years | 0 (0.0%) | 0 (0.0%) |
| 5 to 17 Years | 0 (0.0%) | 0 (0.0%) |
| 18 to 34 Years | 9 (2.2%) | 0 (0.0%) |
| 35 to 64 Years | 16 (1.3%) | 50 (4.8%) |
| 65 to 74 Years | 6 (2.6%) | 0 (0.0%) |
| 75 Years and over | 8 (5.6%) | 10 (3.7%) |
Disability Class: Cognitive Difficulty
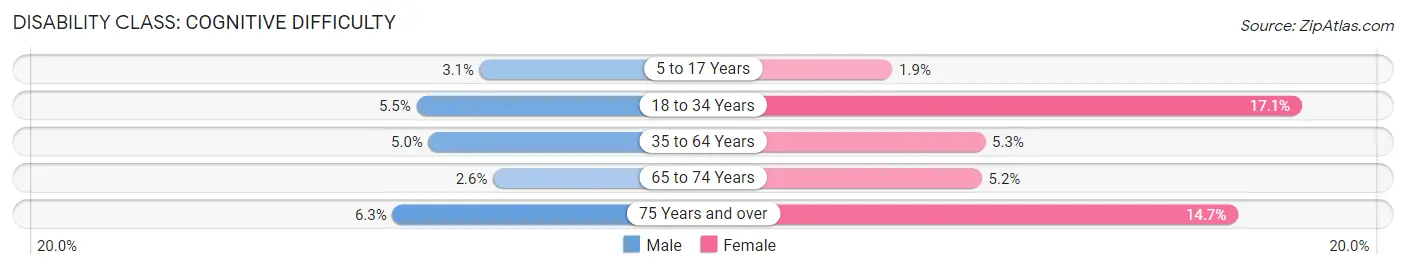
| Age Bracket | Male | Female |
| 5 to 17 Years | 17 (3.1%) | 9 (1.9%) |
| 18 to 34 Years | 22 (5.4%) | 75 (17.1%) |
| 35 to 64 Years | 60 (5.0%) | 55 (5.3%) |
| 65 to 74 Years | 6 (2.6%) | 16 (5.2%) |
| 75 Years and over | 9 (6.3%) | 40 (14.7%) |
Disability Class: Ambulatory Difficulty
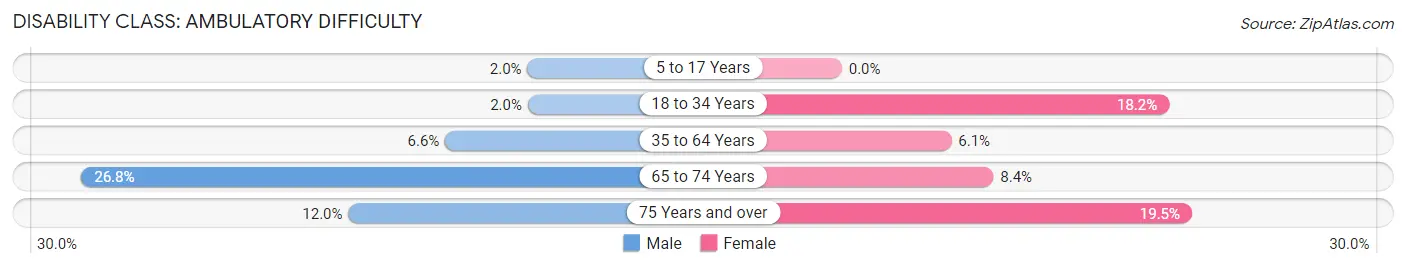
| Age Bracket | Male | Female |
| 5 to 17 Years | 11 (2.0%) | 0 (0.0%) |
| 18 to 34 Years | 8 (2.0%) | 80 (18.2%) |
| 35 to 64 Years | 79 (6.6%) | 63 (6.1%) |
| 65 to 74 Years | 62 (26.8%) | 26 (8.4%) |
| 75 Years and over | 17 (12.0%) | 53 (19.5%) |
Disability Class: Self-Care Difficulty
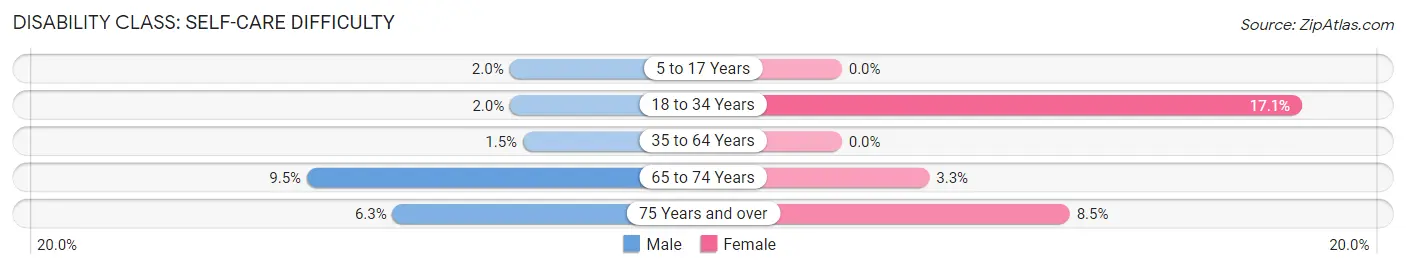
| Age Bracket | Male | Female |
| 5 to 17 Years | 11 (2.0%) | 0 (0.0%) |
| 18 to 34 Years | 8 (2.0%) | 75 (17.1%) |
| 35 to 64 Years | 18 (1.5%) | 0 (0.0%) |
| 65 to 74 Years | 22 (9.5%) | 10 (3.3%) |
| 75 Years and over | 9 (6.3%) | 23 (8.5%) |
Technology Access in Town and Country
Computing Device Access in Town and Country
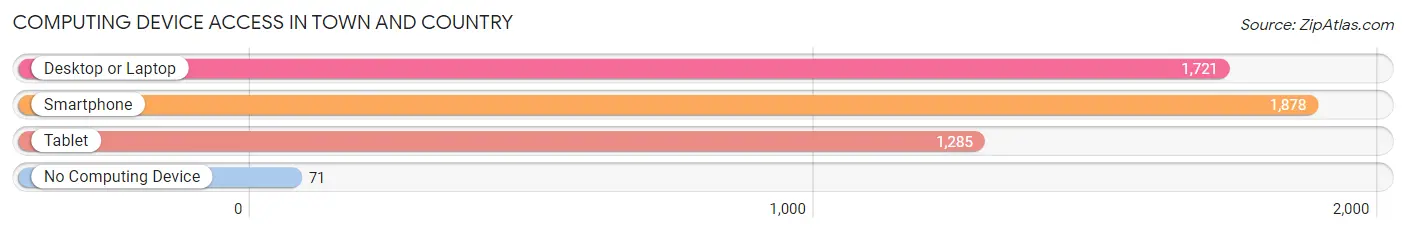
| Device Type | # Households | % Households |
| Desktop or Laptop | 1,721 | 84.1% |
| Smartphone | 1,878 | 91.7% |
| Tablet | 1,285 | 62.8% |
| No Computing Device | 71 | 3.5% |
| Total | 2,047 | 100.0% |
Internet Access in Town and Country
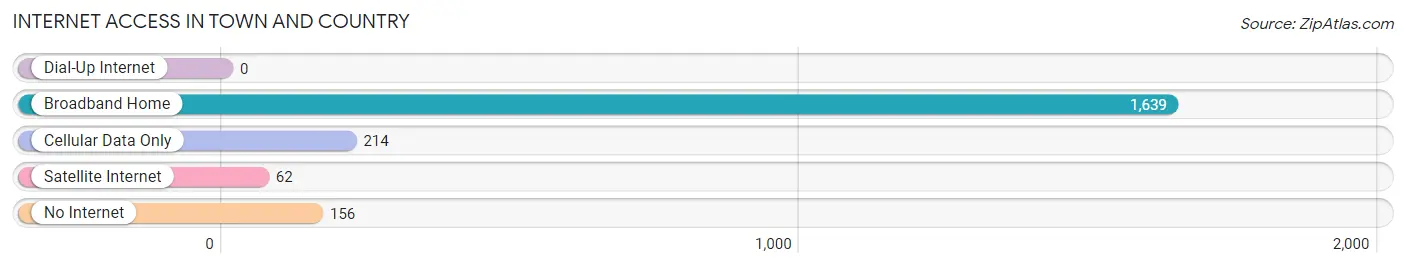
| Internet Type | # Households | % Households |
| Dial-Up Internet | 0 | 0.0% |
| Broadband Home | 1,639 | 80.1% |
| Cellular Data Only | 214 | 10.4% |
| Satellite Internet | 62 | 3.0% |
| No Internet | 156 | 7.6% |
| Total | 2,047 | 100.0% |
Town and Country Summary
Town and Country, Washington is a small town located in the western part of the state, just south of Seattle. It is a rural community with a population of just over 4,000 people. The town is situated in a valley surrounded by the Cascade Mountains and is home to a variety of businesses, including a few small farms.
Geography
Town and Country is located in the western part of Washington State, just south of Seattle. It is situated in a valley surrounded by the Cascade Mountains. The town is located at an elevation of about 500 feet and is about 20 miles from the Pacific Ocean. The town is located in the Puget Sound region and is close to the cities of Tacoma and Olympia. The town is also close to the Olympic National Park and Mount Rainier National Park.
The town is located in a temperate climate with mild winters and warm summers. The average temperature in the summer is around 70 degrees Fahrenheit and the average temperature in the winter is around 40 degrees Fahrenheit. The town receives an average of about 30 inches of rain per year.
Economy
The economy of Town and Country is largely based on agriculture and tourism. The town is home to a few small farms that produce a variety of crops, including apples, cherries, and vegetables. The town also has a few small businesses, including a few restaurants and a few retail stores.
The town is also a popular tourist destination. The town is close to the Olympic National Park and Mount Rainier National Park, and is a popular destination for hikers and campers. The town also has a few small bed and breakfasts and a few small hotels.
Demographics
As of the 2010 census, the population of Town and Country was 4,072. The population is mostly white (90.2%), with a small percentage of African Americans (2.2%), Asians (2.1%), and Native Americans (1.2%). The median household income in the town is $50,000, and the median age is 44.
The town is served by the Town and Country School District, which includes two elementary schools, one middle school, and one high school. The town also has a few private schools, including a Catholic school and a Christian school.
Conclusion
Town and Country, Washington is a small rural town located in the western part of the state, just south of Seattle. The town is surrounded by the Cascade Mountains and is home to a variety of businesses, including a few small farms. The town is a popular tourist destination and is close to the Olympic National Park and Mount Rainier National Park. The town has a population of just over 4,000 people and is mostly white. The town is served by the Town and Country School District and has a few private schools. The town has a median household income of $50,000 and a median age of 44.
Common Questions
What is Per Capita Income in Town and Country?
Per Capita income in Town and Country is $36,455.
What is the Median Family Income in Town and Country?
Median Family Income in Town and Country is $92,136.
What is the Median Household income in Town and Country?
Median Household Income in Town and Country is $85,778.
What is Income or Wage Gap in Town and Country?
Income or Wage Gap in Town and Country is 21.3%.
Women in Town and Country earn 78.7 cents for every dollar earned by a man.
What is Inequality or Gini Index in Town and Country?
Inequality or Gini Index in Town and Country is 0.39.
What is the Total Population of Town and Country?
Total Population of Town and Country is 5,243.
What is the Total Male Population of Town and Country?
Total Male Population of Town and Country is 2,612.
What is the Total Female Population of Town and Country?
Total Female Population of Town and Country is 2,631.
What is the Ratio of Males per 100 Females in Town and Country?
There are 99.28 Males per 100 Females in Town and Country.
What is the Ratio of Females per 100 Males in Town and Country?
There are 100.73 Females per 100 Males in Town and Country.
What is the Median Population Age in Town and Country?
Median Population Age in Town and Country is 41.3 Years.
What is the Average Family Size in Town and Country
Average Family Size in Town and Country is 3.1 People.
What is the Average Household Size in Town and Country
Average Household Size in Town and Country is 2.6 People.
How Large is the Labor Force in Town and Country?
There are 2,881 People in the Labor Forcein in Town and Country.
What is the Percentage of People in the Labor Force in Town and Country?
66.9% of People are in the Labor Force in Town and Country.
What is the Unemployment Rate in Town and Country?
Unemployment Rate in Town and Country is 9.2%.