North Omak, WA Map & Demographics
North Omak Map
North Omak Overview
$35,323
PER CAPITA INCOME
$84,048
AVG FAMILY INCOME
$64,408
AVG HOUSEHOLD INCOME
10.9%
WAGE / INCOME GAP [ % ]
89.1¢/ $1
WAGE / INCOME GAP [ $ ]
0.41
INEQUALITY / GINI INDEX
395
TOTAL POPULATION
150
MALE POPULATION
245
FEMALE POPULATION
61.22
MALES / 100 FEMALES
163.33
FEMALES / 100 MALES
50.9
MEDIAN AGE
2.6
AVG FAMILY SIZE
2.3
AVG HOUSEHOLD SIZE
230
LABOR FORCE [ PEOPLE ]
71.9%
PERCENT IN LABOR FORCE
2.2%
UNEMPLOYMENT RATE
Income in North Omak
Income Overview in North Omak
Per Capita Income in North Omak is $35,323, while median incomes of families and households are $84,048 and $64,408 respectively.
| Characteristic | Number | Measure |
| Per Capita Income | 395 | $35,323 |
| Median Family Income | 124 | $84,048 |
| Mean Family Income | 124 | $89,472 |
| Median Household Income | 175 | $64,408 |
| Mean Household Income | 175 | $81,342 |
| Income Deficit | 124 | $0 |
| Wage / Income Gap (%) | 395 | 10.93% |
| Wage / Income Gap ($) | 395 | 89.07¢ per $1 |
| Gini / Inequality Index | 395 | 0.41 |
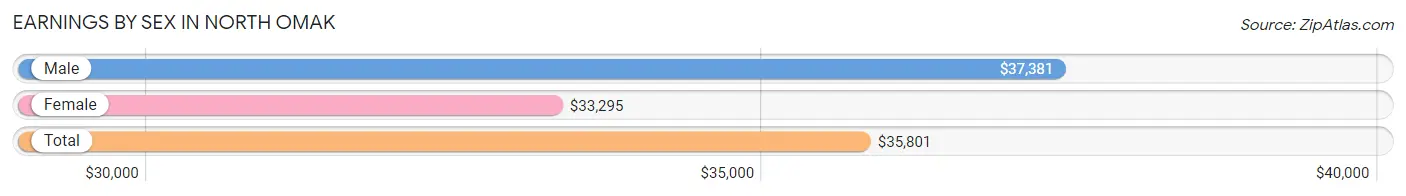
Earnings by Sex in North Omak
Average Earnings in North Omak are $35,801, $37,381 for men and $33,295 for women, a difference of 10.9%.
| Sex | Number | Average Earnings |
| Male | 98 (43.6%) | $37,381 |
| Female | 127 (56.4%) | $33,295 |
| Total | 225 (100.0%) | $35,801 |
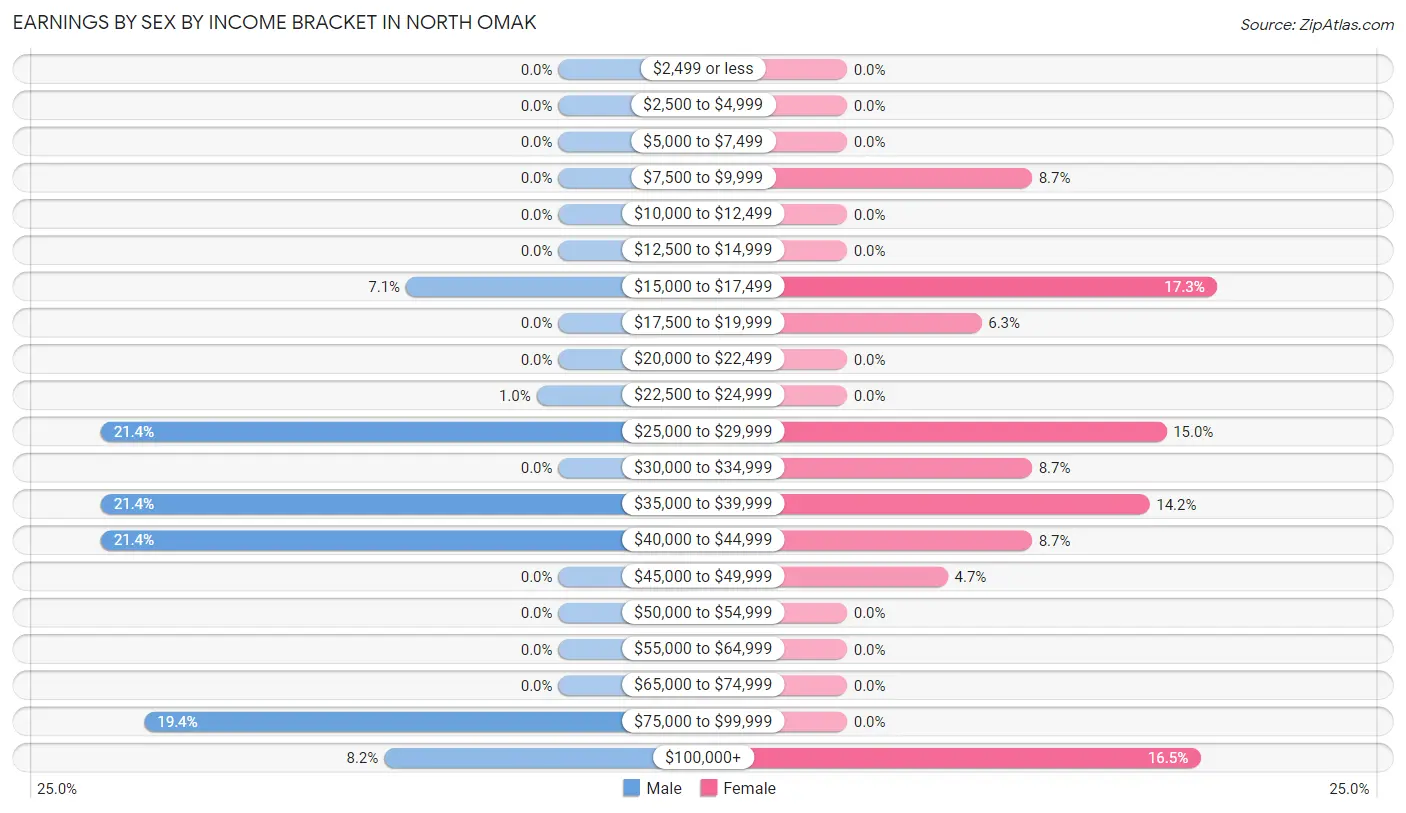
Earnings by Sex by Income Bracket in North Omak
The most common earnings brackets in North Omak are $25,000 to $29,999 for men (21 | 21.4%) and $15,000 to $17,499 for women (22 | 17.3%).
| Income | Male | Female |
| $2,499 or less | 0 (0.0%) | 0 (0.0%) |
| $2,500 to $4,999 | 0 (0.0%) | 0 (0.0%) |
| $5,000 to $7,499 | 0 (0.0%) | 0 (0.0%) |
| $7,500 to $9,999 | 0 (0.0%) | 11 (8.7%) |
| $10,000 to $12,499 | 0 (0.0%) | 0 (0.0%) |
| $12,500 to $14,999 | 0 (0.0%) | 0 (0.0%) |
| $15,000 to $17,499 | 7 (7.1%) | 22 (17.3%) |
| $17,500 to $19,999 | 0 (0.0%) | 8 (6.3%) |
| $20,000 to $22,499 | 0 (0.0%) | 0 (0.0%) |
| $22,500 to $24,999 | 1 (1.0%) | 0 (0.0%) |
| $25,000 to $29,999 | 21 (21.4%) | 19 (15.0%) |
| $30,000 to $34,999 | 0 (0.0%) | 11 (8.7%) |
| $35,000 to $39,999 | 21 (21.4%) | 18 (14.2%) |
| $40,000 to $44,999 | 21 (21.4%) | 11 (8.7%) |
| $45,000 to $49,999 | 0 (0.0%) | 6 (4.7%) |
| $50,000 to $54,999 | 0 (0.0%) | 0 (0.0%) |
| $55,000 to $64,999 | 0 (0.0%) | 0 (0.0%) |
| $65,000 to $74,999 | 0 (0.0%) | 0 (0.0%) |
| $75,000 to $99,999 | 19 (19.4%) | 0 (0.0%) |
| $100,000+ | 8 (8.2%) | 21 (16.5%) |
| Total | 98 (100.0%) | 127 (100.0%) |
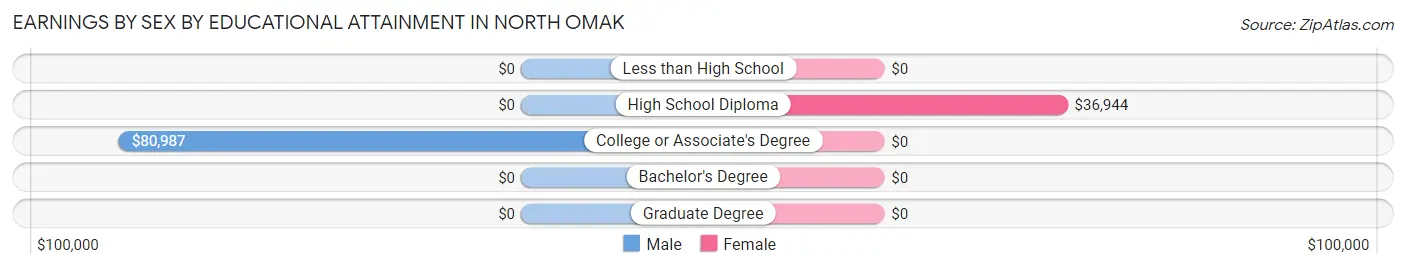
Earnings by Sex by Educational Attainment in North Omak
| Educational Attainment | Male Income | Female Income |
| Less than High School | - | - |
| High School Diploma | - | - |
| College or Associate's Degree | $80,987 | $0 |
| Bachelor's Degree | - | - |
| Graduate Degree | - | - |
| Total | - | - |
Family Income in North Omak
Family Income Brackets in North Omak
According to the North Omak family income data, there are 31 families falling into the $100,000 to $149,999 income range, which is the most common income bracket and makes up 25.0% of all families.
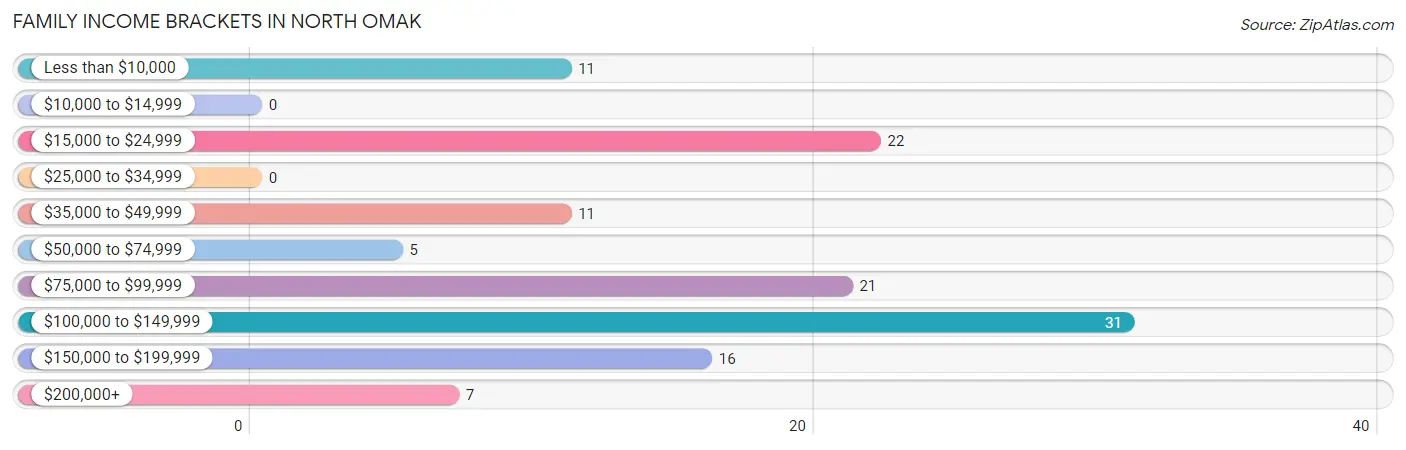
| Income Bracket | # Families | % Families |
| Less than $10,000 | 11 | 8.9% |
| $10,000 to $14,999 | 0 | 0.0% |
| $15,000 to $24,999 | 22 | 17.7% |
| $25,000 to $34,999 | 0 | 0.0% |
| $35,000 to $49,999 | 11 | 8.9% |
| $50,000 to $74,999 | 5 | 4.0% |
| $75,000 to $99,999 | 21 | 16.9% |
| $100,000 to $149,999 | 31 | 25.0% |
| $150,000 to $199,999 | 16 | 12.9% |
| $200,000+ | 7 | 5.6% |
Family Income by Famaliy Size in North Omak
2-person families (67 | 54.0%) account for the highest median family income in North Omak with $122,697 per family, while 2-person families (67 | 54.0%) have the highest median income of $61,348 per family member.
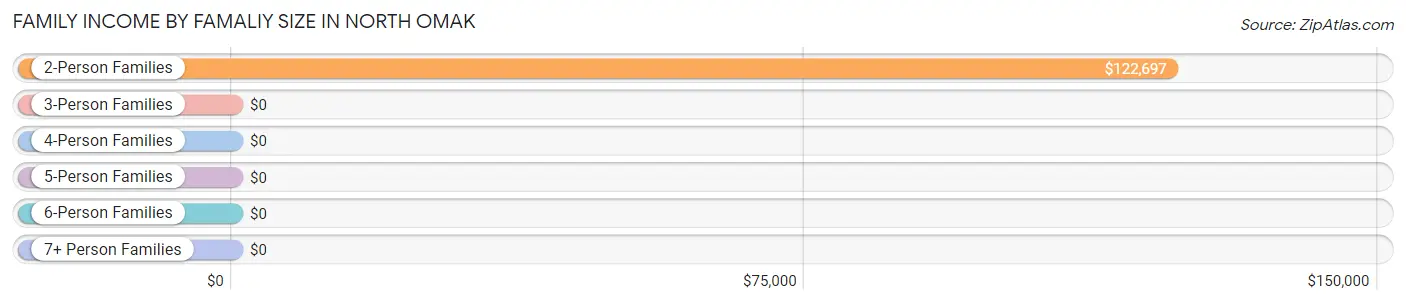
| Income Bracket | # Families | Median Income |
| 2-Person Families | 67 (54.0%) | $122,697 |
| 3-Person Families | 23 (18.5%) | $0 |
| 4-Person Families | 33 (26.6%) | $0 |
| 5-Person Families | 0 (0.0%) | $0 |
| 6-Person Families | 1 (0.8%) | $0 |
| 7+ Person Families | 0 (0.0%) | $0 |
| Total | 124 (100.0%) | $84,048 |
Family Income by Number of Earners in North Omak
| Number of Earners | # Families | Median Income |
| No Earners | 7 (5.7%) | $0 |
| 1 Earner | 68 (54.8%) | $0 |
| 2 Earners | 49 (39.5%) | $0 |
| 3+ Earners | 0 (0.0%) | $0 |
| Total | 124 (100.0%) | $84,048 |
Household Income in North Omak
Household Income Brackets in North Omak
With 32 households falling in the category, the $15,000 to $24,999 income range is the most frequent in North Omak, accounting for 18.3% of all households.
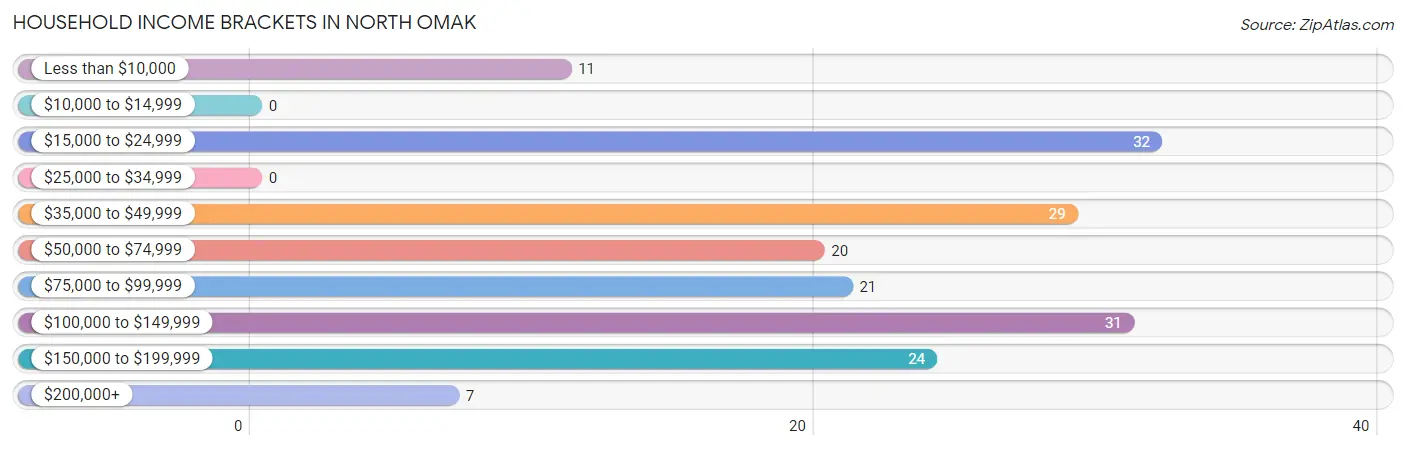
| Income Bracket | # Households | % Households |
| Less than $10,000 | 11 | 6.3% |
| $10,000 to $14,999 | 0 | 0.0% |
| $15,000 to $24,999 | 32 | 18.3% |
| $25,000 to $34,999 | 0 | 0.0% |
| $35,000 to $49,999 | 29 | 16.6% |
| $50,000 to $74,999 | 20 | 11.4% |
| $75,000 to $99,999 | 21 | 12.0% |
| $100,000 to $149,999 | 31 | 17.7% |
| $150,000 to $199,999 | 24 | 13.7% |
| $200,000+ | 7 | 4.0% |
Household Income by Householder Age in North Omak
The median household income in North Omak is $64,408, with the highest median household income of $122,895 found in the 65+ years age bracket for the primary householder. A total of 64 households (36.6%) fall into this category. Meanwhile, the 15 to 24 years age bracket for the primary householder has the lowest median household income of $0, with 15 households (8.6%) in this group.
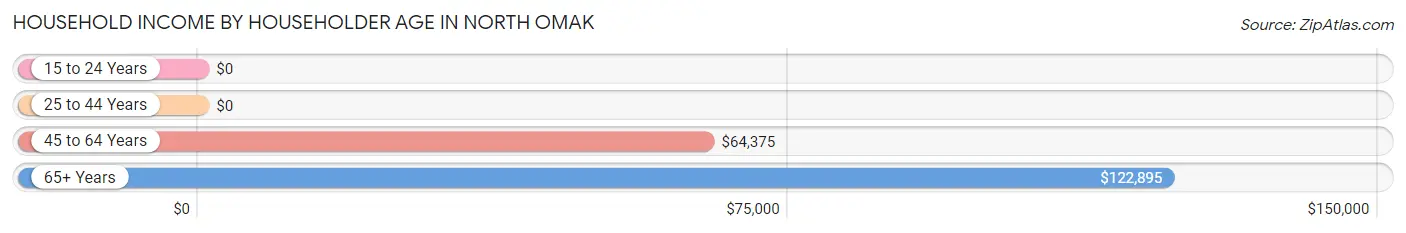
| Income Bracket | # Households | Median Income |
| 15 to 24 Years | 15 (8.6%) | $0 |
| 25 to 44 Years | 52 (29.7%) | $0 |
| 45 to 64 Years | 44 (25.1%) | $64,375 |
| 65+ Years | 64 (36.6%) | $122,895 |
| Total | 175 (100.0%) | $64,408 |
Poverty in North Omak
Income Below Poverty by Sex and Age in North Omak
With 13.3% poverty level for males and 26.1% for females among the residents of North Omak, under 5 year old males and under 5 year old females are the most vulnerable to poverty, with 8 males (100.0%) and 16 females (100.0%) in their respective age groups living below the poverty level.
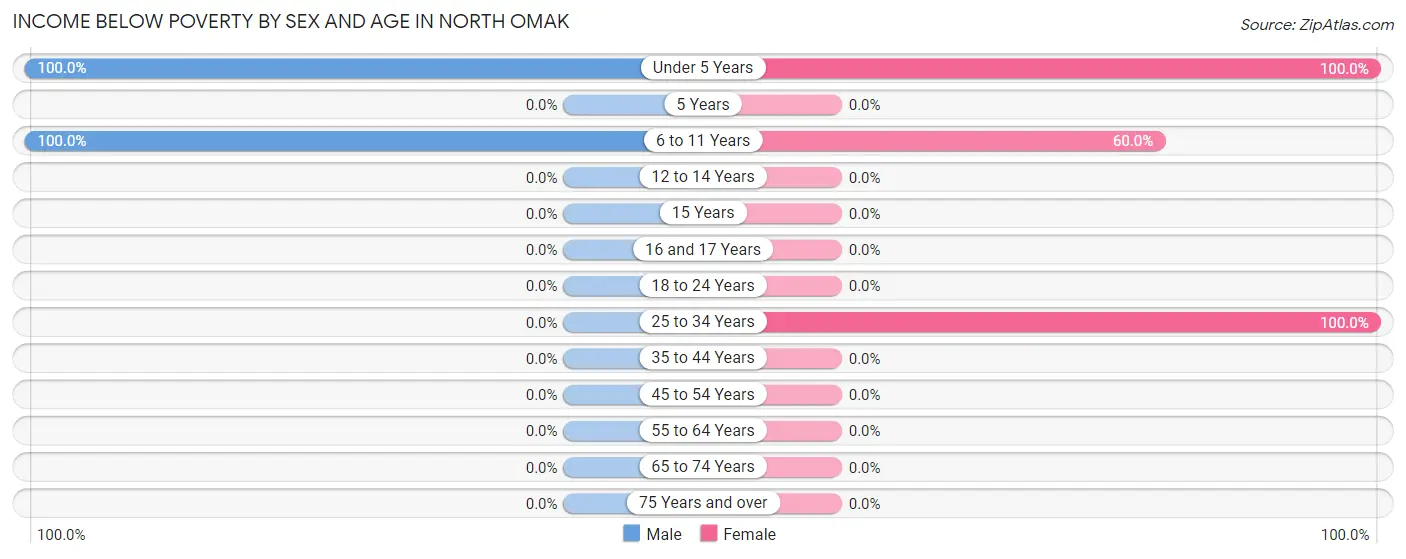
| Age Bracket | Male | Female |
| Under 5 Years | 8 (100.0%) | 16 (100.0%) |
| 5 Years | 0 (0.0%) | 0 (0.0%) |
| 6 to 11 Years | 12 (100.0%) | 15 (60.0%) |
| 12 to 14 Years | 0 (0.0%) | 0 (0.0%) |
| 15 Years | 0 (0.0%) | 0 (0.0%) |
| 16 and 17 Years | 0 (0.0%) | 0 (0.0%) |
| 18 to 24 Years | 0 (0.0%) | 0 (0.0%) |
| 25 to 34 Years | 0 (0.0%) | 33 (100.0%) |
| 35 to 44 Years | 0 (0.0%) | 0 (0.0%) |
| 45 to 54 Years | 0 (0.0%) | 0 (0.0%) |
| 55 to 64 Years | 0 (0.0%) | 0 (0.0%) |
| 65 to 74 Years | 0 (0.0%) | 0 (0.0%) |
| 75 Years and over | 0 (0.0%) | 0 (0.0%) |
| Total | 20 (13.3%) | 64 (26.1%) |
Income Above Poverty by Sex and Age in North Omak
According to the poverty statistics in North Omak, males aged 15 years and females aged 12 to 14 years are the age groups that are most secure financially, with 100.0% of males and 100.0% of females in these age groups living above the poverty line.
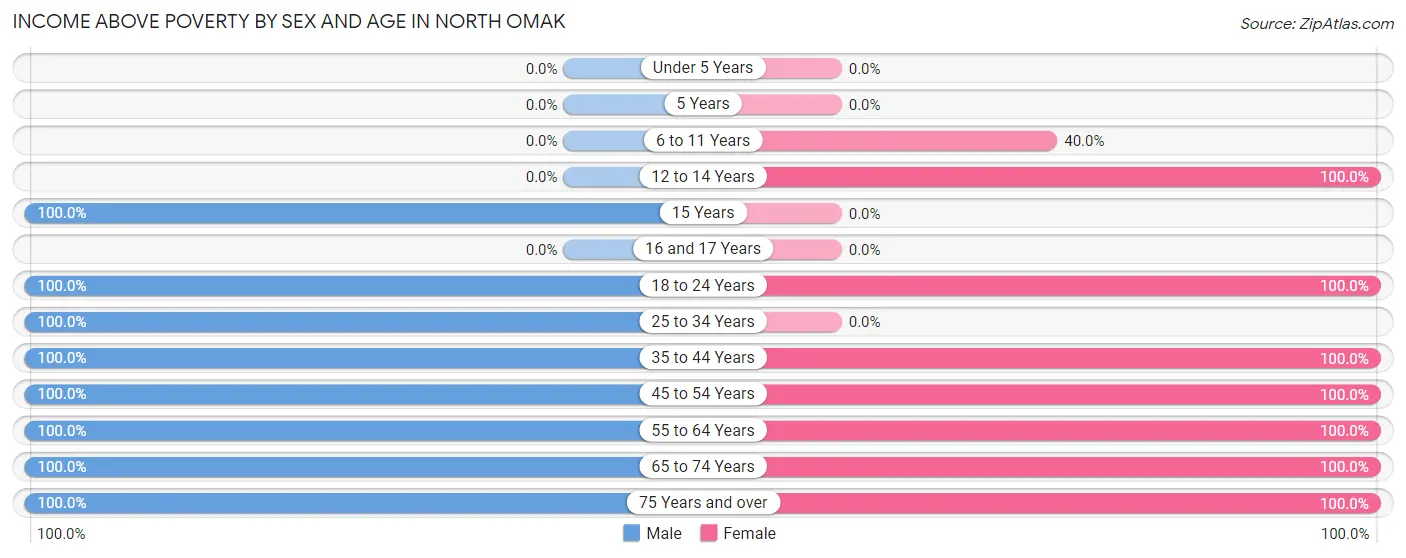
| Age Bracket | Male | Female |
| Under 5 Years | 0 (0.0%) | 0 (0.0%) |
| 5 Years | 0 (0.0%) | 0 (0.0%) |
| 6 to 11 Years | 0 (0.0%) | 10 (40.0%) |
| 12 to 14 Years | 0 (0.0%) | 10 (100.0%) |
| 15 Years | 4 (100.0%) | 0 (0.0%) |
| 16 and 17 Years | 0 (0.0%) | 0 (0.0%) |
| 18 to 24 Years | 22 (100.0%) | 15 (100.0%) |
| 25 to 34 Years | 11 (100.0%) | 0 (0.0%) |
| 35 to 44 Years | 12 (100.0%) | 8 (100.0%) |
| 45 to 54 Years | 22 (100.0%) | 45 (100.0%) |
| 55 to 64 Years | 4 (100.0%) | 11 (100.0%) |
| 65 to 74 Years | 43 (100.0%) | 55 (100.0%) |
| 75 Years and over | 12 (100.0%) | 27 (100.0%) |
| Total | 130 (86.7%) | 181 (73.9%) |
Income Below Poverty Among Married-Couple Families in North Omak
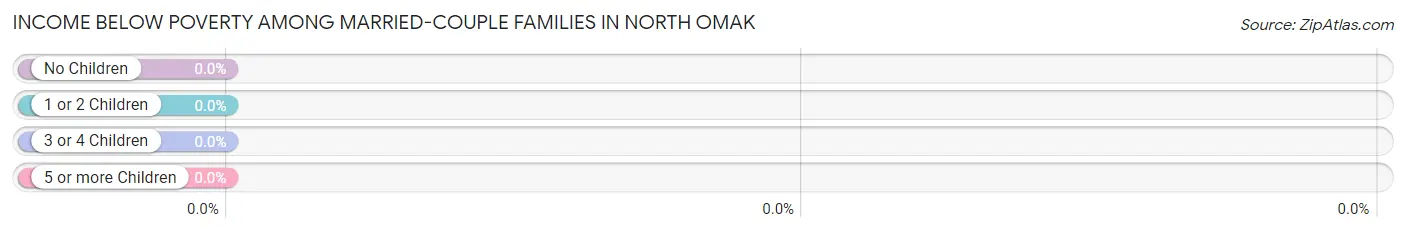
| Children | Above Poverty | Below Poverty |
| No Children | 75 (100.0%) | 0 (0.0%) |
| 1 or 2 Children | 5 (100.0%) | 0 (0.0%) |
| 3 or 4 Children | 0 (0.0%) | 0 (0.0%) |
| 5 or more Children | 0 (0.0%) | 0 (0.0%) |
| Total | 80 (100.0%) | 0 (0.0%) |
Income Below Poverty Among Single-Parent Households in North Omak
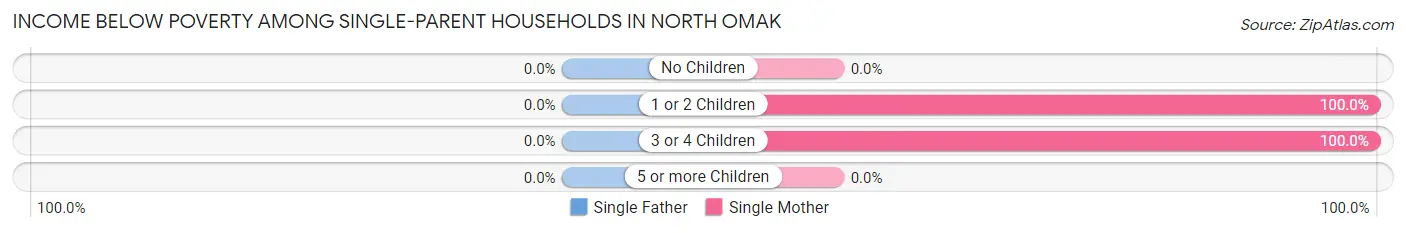
| Children | Single Father | Single Mother |
| No Children | 0 (0.0%) | 0 (0.0%) |
| 1 or 2 Children | 0 (0.0%) | 11 (100.0%) |
| 3 or 4 Children | 0 (0.0%) | 22 (100.0%) |
| 5 or more Children | 0 (0.0%) | 0 (0.0%) |
| Total | 0 (0.0%) | 33 (100.0%) |
Income Below Poverty Among Married-Couple vs Single-Parent Households in North Omak
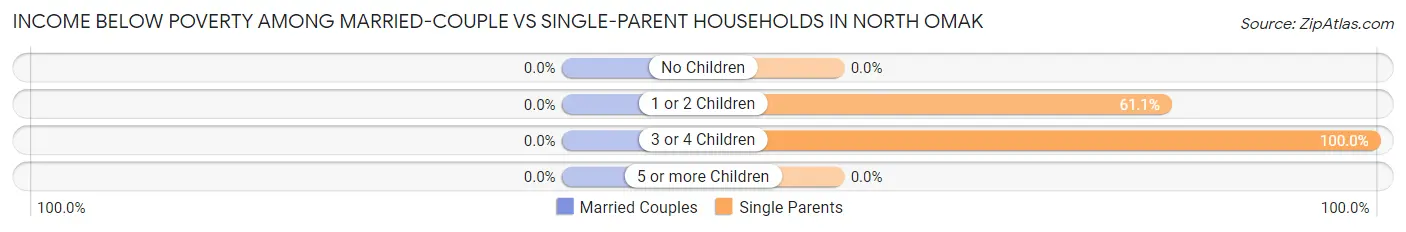
| Children | Married-Couple Families | Single-Parent Households |
| No Children | 0 (0.0%) | 0 (0.0%) |
| 1 or 2 Children | 0 (0.0%) | 11 (61.1%) |
| 3 or 4 Children | 0 (0.0%) | 22 (100.0%) |
| 5 or more Children | 0 (0.0%) | 0 (0.0%) |
| Total | 0 (0.0%) | 33 (75.0%) |
Race in North Omak
The most populous races in North Omak are Native / Alaskan (194 | 49.1%), White / Caucasian (160 | 40.5%), and Hispanic or Latino (37 | 9.4%).
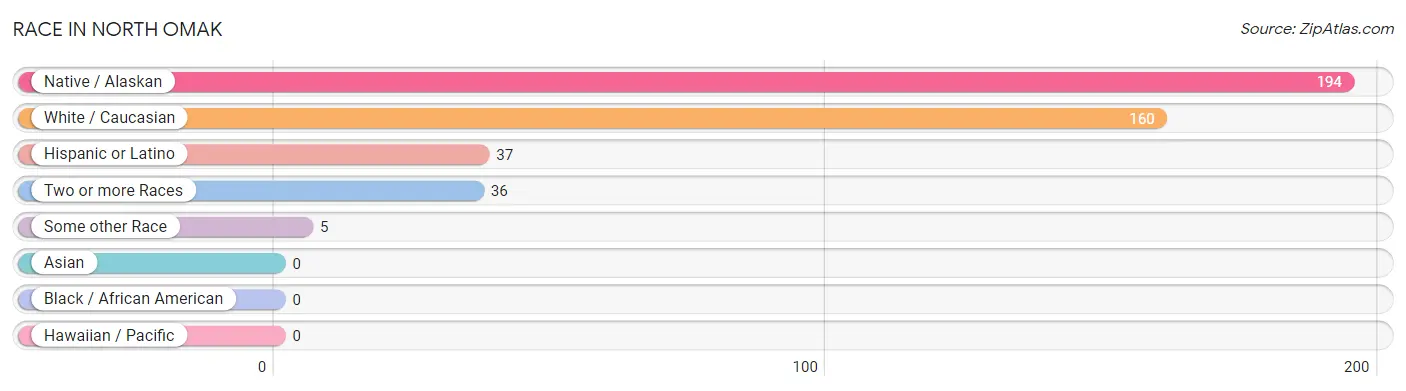
| Race | # Population | % Population |
| Asian | 0 | 0.0% |
| Black / African American | 0 | 0.0% |
| Hawaiian / Pacific | 0 | 0.0% |
| Hispanic or Latino | 37 | 9.4% |
| Native / Alaskan | 194 | 49.1% |
| White / Caucasian | 160 | 40.5% |
| Two or more Races | 36 | 9.1% |
| Some other Race | 5 | 1.3% |
| Total | 395 | 100.0% |
Ancestry in North Omak
The most populous ancestries reported in North Omak are Colville (167 | 42.3%), Irish (52 | 13.2%), American (42 | 10.6%), Mexican (37 | 9.4%), and Swedish (27 | 6.8%), together accounting for 82.3% of all North Omak residents.
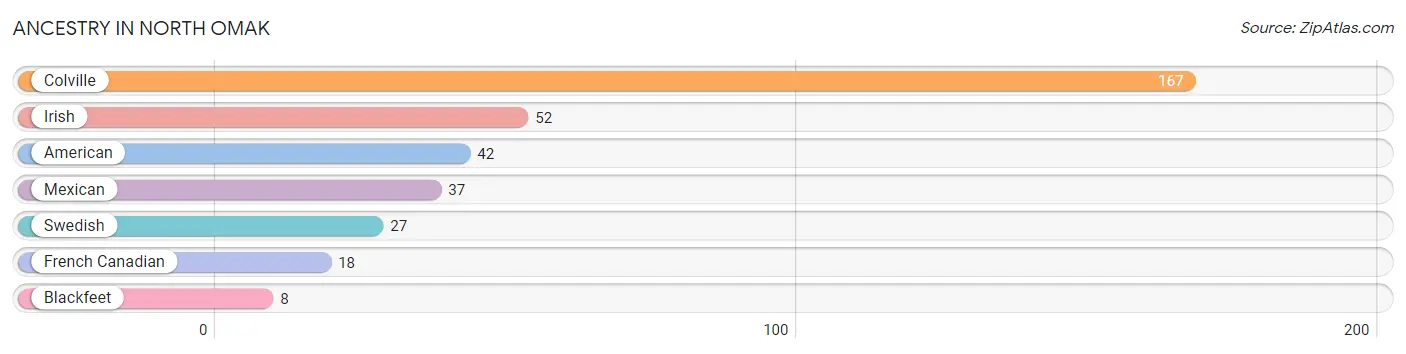
| Ancestry | # Population | % Population |
| American | 42 | 10.6% |
| Blackfeet | 8 | 2.0% |
| Colville | 167 | 42.3% |
| French Canadian | 18 | 4.6% |
| Irish | 52 | 13.2% |
| Mexican | 37 | 9.4% |
| Swedish | 27 | 6.8% | View All 7 Rows |
Immigrants in North Omak

| Immigration Origin | # Population | % Population | View All 0 Rows |
Sex and Age in North Omak
Sex and Age in North Omak
The most populous age groups in North Omak are 65 to 69 Years (36 | 24.0%) for men and 65 to 69 Years (47 | 19.2%) for women.
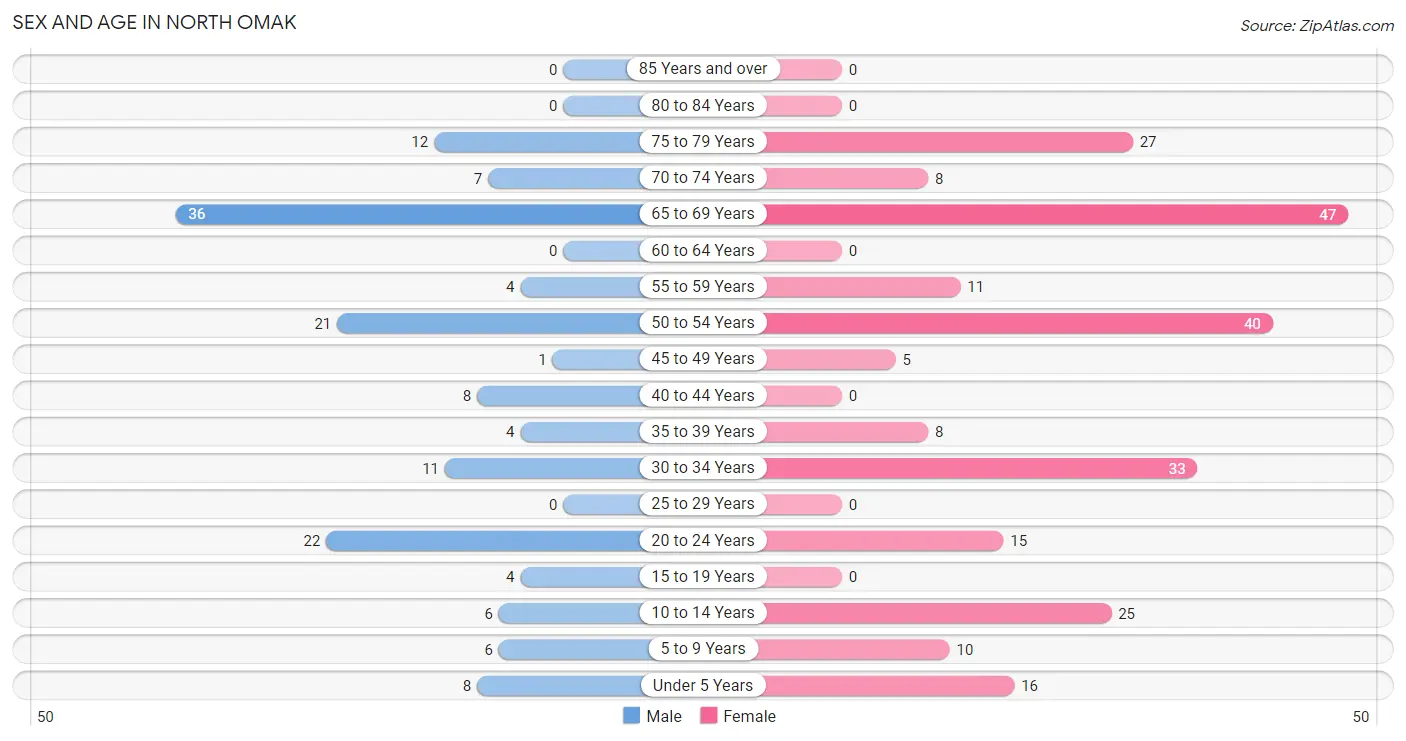
| Age Bracket | Male | Female |
| Under 5 Years | 8 (5.3%) | 16 (6.5%) |
| 5 to 9 Years | 6 (4.0%) | 10 (4.1%) |
| 10 to 14 Years | 6 (4.0%) | 25 (10.2%) |
| 15 to 19 Years | 4 (2.7%) | 0 (0.0%) |
| 20 to 24 Years | 22 (14.7%) | 15 (6.1%) |
| 25 to 29 Years | 0 (0.0%) | 0 (0.0%) |
| 30 to 34 Years | 11 (7.3%) | 33 (13.5%) |
| 35 to 39 Years | 4 (2.7%) | 8 (3.3%) |
| 40 to 44 Years | 8 (5.3%) | 0 (0.0%) |
| 45 to 49 Years | 1 (0.7%) | 5 (2.0%) |
| 50 to 54 Years | 21 (14.0%) | 40 (16.3%) |
| 55 to 59 Years | 4 (2.7%) | 11 (4.5%) |
| 60 to 64 Years | 0 (0.0%) | 0 (0.0%) |
| 65 to 69 Years | 36 (24.0%) | 47 (19.2%) |
| 70 to 74 Years | 7 (4.7%) | 8 (3.3%) |
| 75 to 79 Years | 12 (8.0%) | 27 (11.0%) |
| 80 to 84 Years | 0 (0.0%) | 0 (0.0%) |
| 85 Years and over | 0 (0.0%) | 0 (0.0%) |
| Total | 150 (100.0%) | 245 (100.0%) |
Families and Households in North Omak
Median Family Size in North Omak
The median family size in North Omak is 2.60 persons per family, with single male/father families (11 | 8.9%) accounting for the largest median family size of 3 persons per family. On the other hand, single female/mother families (33 | 26.6%) represent the smallest median family size with 2.55 persons per family.
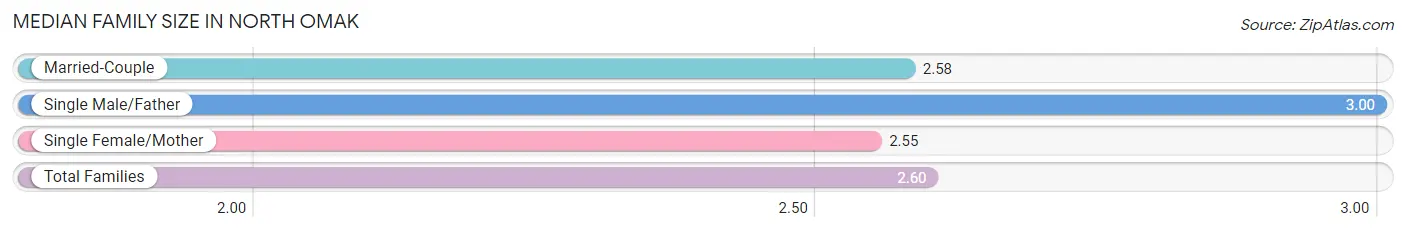
| Family Type | # Families | Family Size |
| Married-Couple | 80 (64.5%) | 2.58 |
| Single Male/Father | 11 (8.9%) | 3.00 |
| Single Female/Mother | 33 (26.6%) | 2.55 |
| Total Families | 124 (100.0%) | 2.60 |
Median Household Size in North Omak
The median household size in North Omak is 2.26 persons per household, with single male/father households (11 | 6.3%) accounting for the largest median household size of 3 persons per household. non-family households (51 | 29.1%) represent the smallest median household size with 1.41 persons per household.
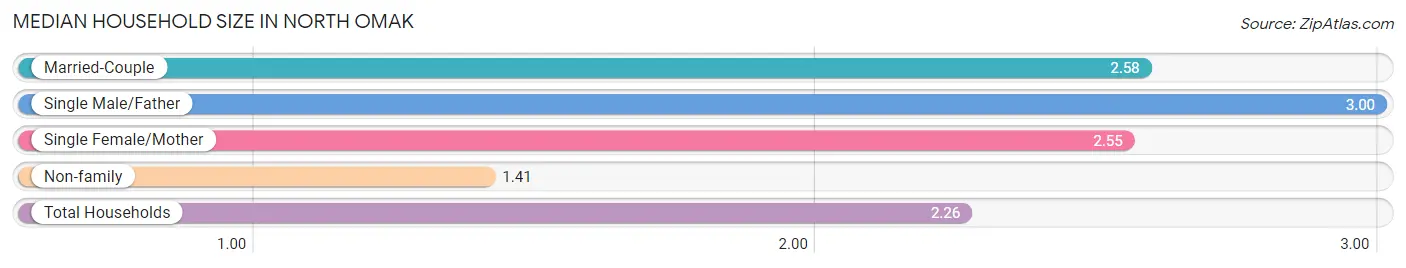
| Household Type | # Households | Household Size |
| Married-Couple | 80 (45.7%) | 2.58 |
| Single Male/Father | 11 (6.3%) | 3.00 |
| Single Female/Mother | 33 (18.9%) | 2.55 |
| Non-family | 51 (29.1%) | 1.41 |
| Total Households | 175 (100.0%) | 2.26 |
Household Size by Marriage Status in North Omak
Out of a total of 175 households in North Omak, 124 (70.9%) are family households, while 51 (29.1%) are nonfamily households. The most numerous type of family households are 2-person households, comprising 67, and the most common type of nonfamily households are 1-person households, comprising 36.
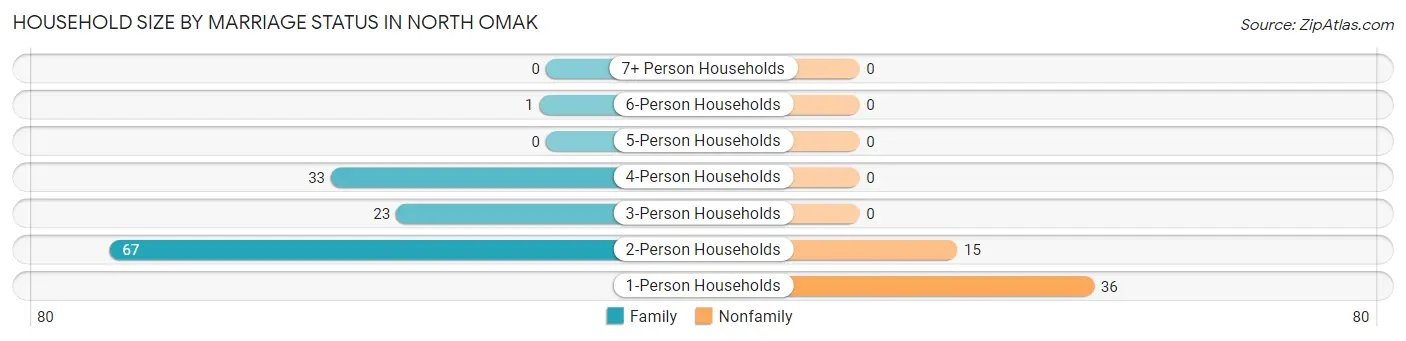
| Household Size | Family Households | Nonfamily Households |
| 1-Person Households | - | 36 (20.6%) |
| 2-Person Households | 67 (38.3%) | 15 (8.6%) |
| 3-Person Households | 23 (13.1%) | 0 (0.0%) |
| 4-Person Households | 33 (18.9%) | 0 (0.0%) |
| 5-Person Households | 0 (0.0%) | 0 (0.0%) |
| 6-Person Households | 1 (0.6%) | 0 (0.0%) |
| 7+ Person Households | 0 (0.0%) | 0 (0.0%) |
| Total | 124 (70.9%) | 51 (29.1%) |
Female Fertility in North Omak
Fertility by Age in North Omak
| Age Bracket | Women with Births | Births / 1,000 Women |
| 15 to 19 years | 0 (0.0%) | 0.0 |
| 20 to 34 years | 0 (0.0%) | 0.0 |
| 35 to 50 years | 0 (0.0%) | 0.0 |
| Total | 0 (0.0%) | 0.0 |
Fertility by Age by Marriage Status in North Omak
| Age Bracket | Married | Unmarried |
| 15 to 19 years | 0 (0.0%) | 0 (0.0%) |
| 20 to 34 years | 0 (0.0%) | 0 (0.0%) |
| 35 to 50 years | 0 (0.0%) | 0 (0.0%) |
| Total | 0 (0.0%) | 0 (0.0%) |
Fertility by Education in North Omak
| Educational Attainment | Women with Births | Births / 1,000 Women |
| Less than High School | 0 (0.0%) | 0.0 |
| High School Diploma | 0 (0.0%) | 0.0 |
| College or Associate's Degree | 0 (0.0%) | 0.0 |
| Bachelor's Degree | 0 (0.0%) | 0.0 |
| Graduate Degree | 0 (0.0%) | 0.0 |
| Total | 0 (0.0%) | 0.0 |
Fertility by Education by Marriage Status in North Omak
| Educational Attainment | Married | Unmarried |
| Less than High School | 0 (0.0%) | 0 (0.0%) |
| High School Diploma | 0 (0.0%) | 0 (0.0%) |
| College or Associate's Degree | 0 (0.0%) | 0 (0.0%) |
| Bachelor's Degree | 0 (0.0%) | 0 (0.0%) |
| Graduate Degree | 0 (0.0%) | 0 (0.0%) |
| Total | 0 (0.0%) | 0 (0.0%) |
Employment Characteristics in North Omak
Employment by Class of Employer in North Omak
Among the 225 employed individuals in North Omak, private company employees (149 | 66.2%), state government employees (33 | 14.7%), and local government employees (30 | 13.3%) make up the most common classes of employment.
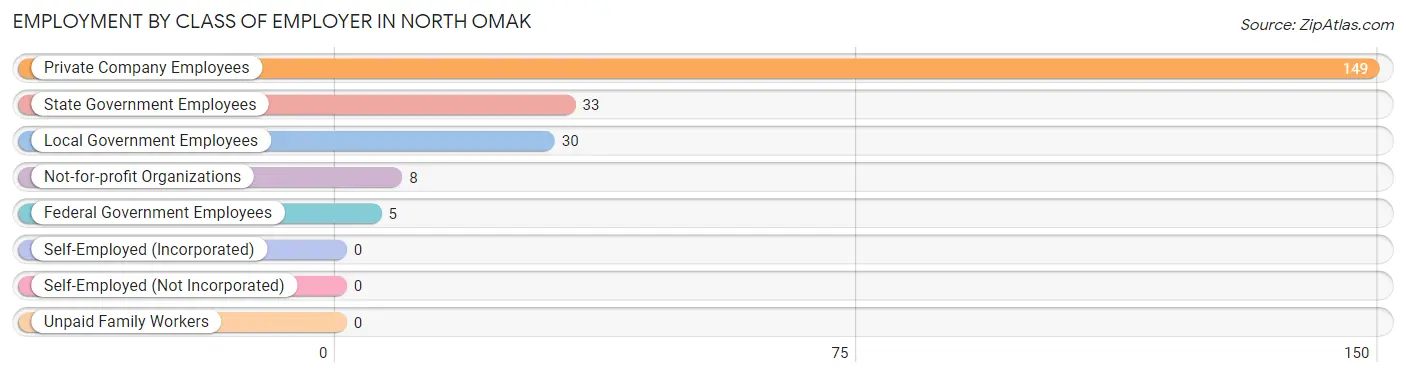
| Employer Class | # Employees | % Employees |
| Private Company Employees | 149 | 66.2% |
| Self-Employed (Incorporated) | 0 | 0.0% |
| Self-Employed (Not Incorporated) | 0 | 0.0% |
| Not-for-profit Organizations | 8 | 3.6% |
| Local Government Employees | 30 | 13.3% |
| State Government Employees | 33 | 14.7% |
| Federal Government Employees | 5 | 2.2% |
| Unpaid Family Workers | 0 | 0.0% |
| Total | 225 | 100.0% |
Employment Status by Age in North Omak
According to the labor force statistics for North Omak, out of the total population over 16 years of age (320), 71.9% or 230 individuals are in the labor force, with 2.2% or 5 of them unemployed. The age group with the highest labor force participation rate is 35 to 44 years, with 100.0% or 20 individuals in the labor force. Within the labor force, the 45 to 54 years age range has the highest percentage of unemployed individuals, with 7.5% or 5 of them being unemployed.
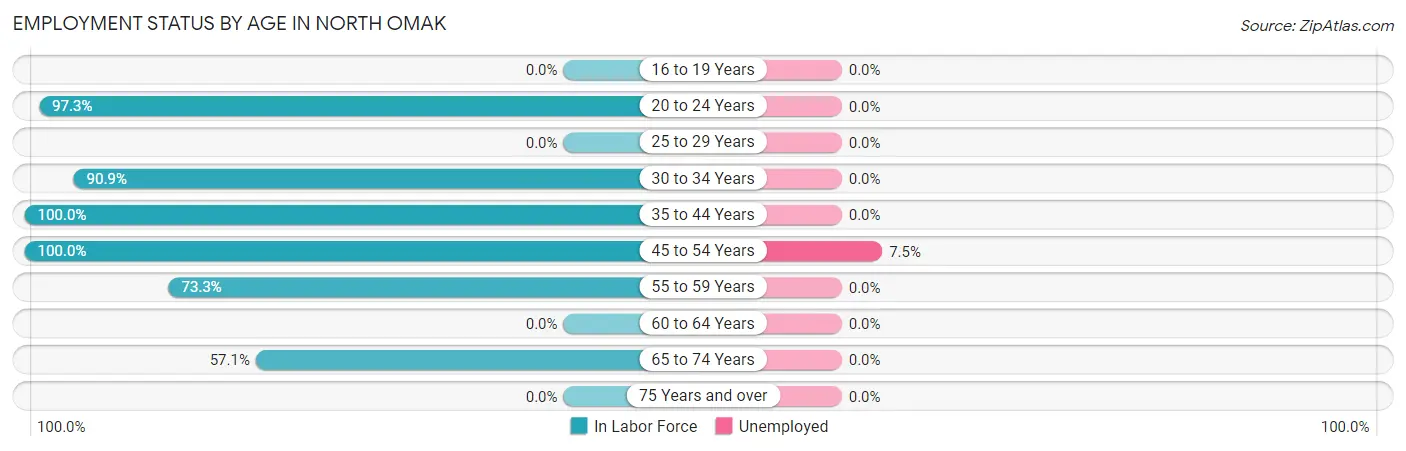
| Age Bracket | In Labor Force | Unemployed |
| 16 to 19 Years | 0 (0.0%) | 0 (0.0%) |
| 20 to 24 Years | 36 (97.3%) | 0 (0.0%) |
| 25 to 29 Years | 0 (0.0%) | 0 (0.0%) |
| 30 to 34 Years | 40 (90.9%) | 0 (0.0%) |
| 35 to 44 Years | 20 (100.0%) | 0 (0.0%) |
| 45 to 54 Years | 67 (100.0%) | 5 (7.5%) |
| 55 to 59 Years | 11 (73.3%) | 0 (0.0%) |
| 60 to 64 Years | 0 (0.0%) | 0 (0.0%) |
| 65 to 74 Years | 56 (57.1%) | 0 (0.0%) |
| 75 Years and over | 0 (0.0%) | 0 (0.0%) |
| Total | 230 (71.9%) | 5 (2.2%) |
Employment Status by Educational Attainment in North Omak
According to labor force statistics for North Omak, 94.5% of individuals (138) out of the total population between 25 and 64 years of age (146) are in the labor force, with 3.6% or 5 of them being unemployed. The group with the highest labor force participation rate are those with the educational attainment of college / associate degree, with 100.0% or 48 individuals in the labor force. Within the labor force, individuals with bachelor's degree or higher education have the highest percentage of unemployment, with 38.5% or 5 of them being unemployed.
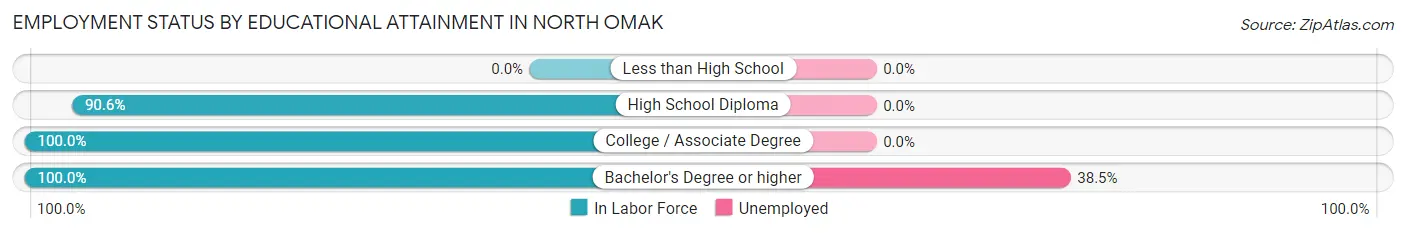
| Educational Attainment | In Labor Force | Unemployed |
| Less than High School | 0 (0.0%) | 0 (0.0%) |
| High School Diploma | 77 (90.6%) | 0 (0.0%) |
| College / Associate Degree | 48 (100.0%) | 0 (0.0%) |
| Bachelor's Degree or higher | 13 (100.0%) | 5 (38.5%) |
| Total | 138 (94.5%) | 5 (3.6%) |
Employment Occupations by Sex in North Omak
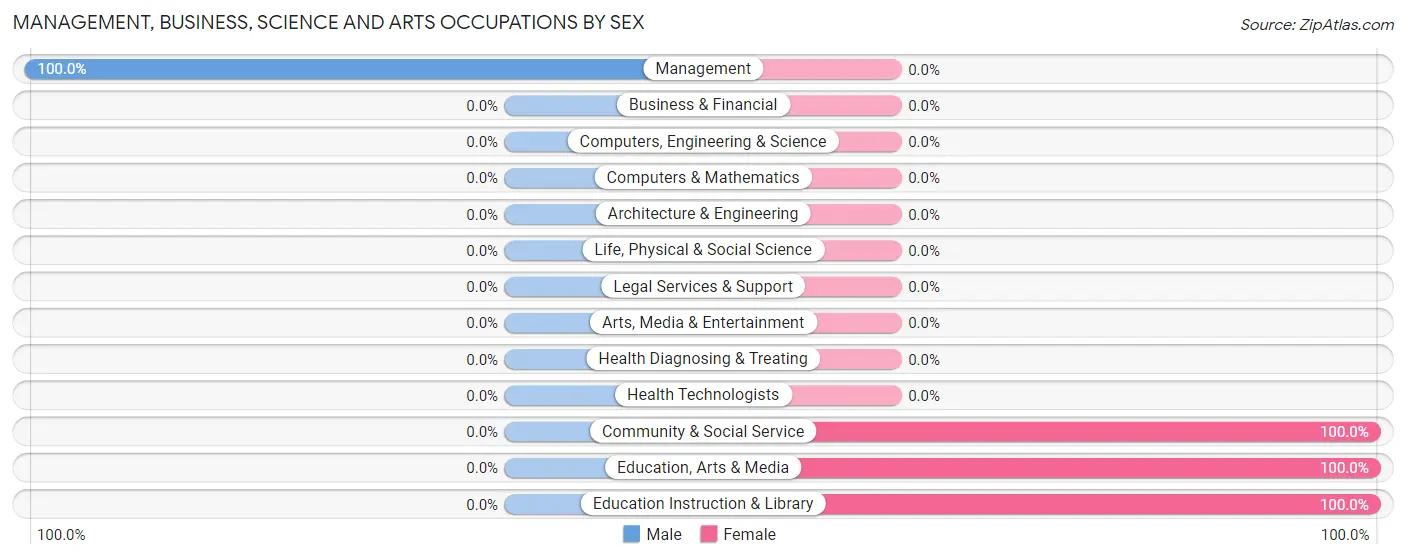
Management, Business, Science and Arts Occupations
The most common Management, Business, Science and Arts occupations in North Omak are Community & Social Service (26 | 11.6%), Education Instruction & Library (20 | 8.9%), Management (19 | 8.4%), and Education, Arts & Media (6 | 2.7%).
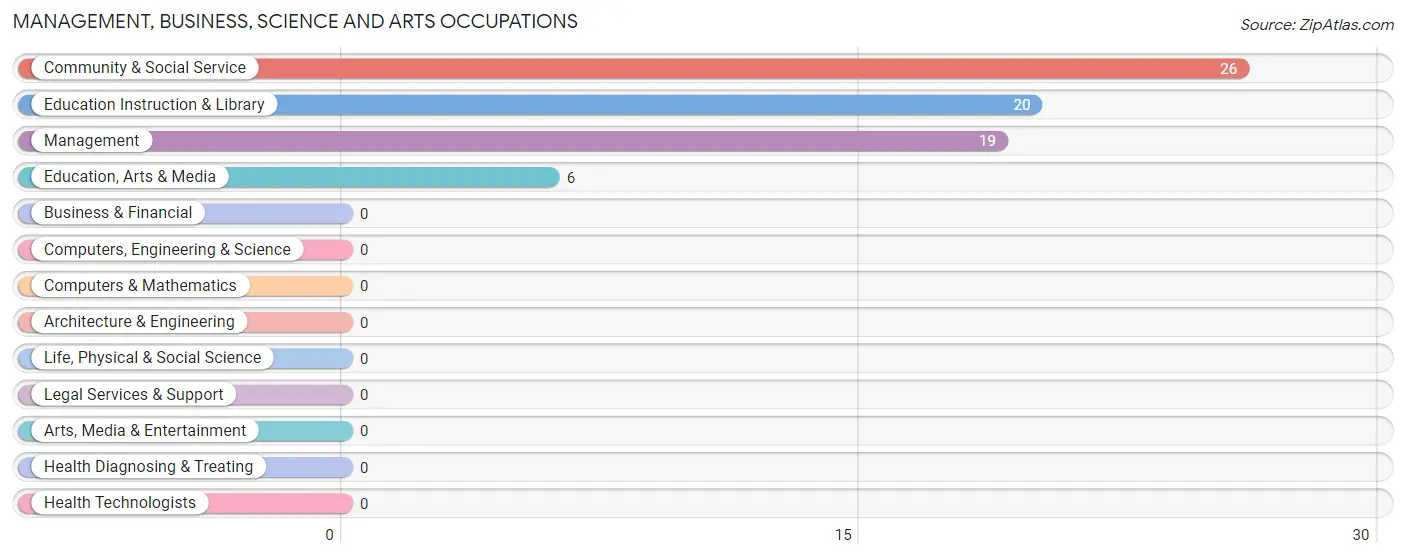
Management, Business, Science and Arts Occupations by Sex
| Occupation | Male | Female |
| Management | 19 (100.0%) | 0 (0.0%) |
| Business & Financial | 0 (0.0%) | 0 (0.0%) |
| Computers, Engineering & Science | 0 (0.0%) | 0 (0.0%) |
| Computers & Mathematics | 0 (0.0%) | 0 (0.0%) |
| Architecture & Engineering | 0 (0.0%) | 0 (0.0%) |
| Life, Physical & Social Science | 0 (0.0%) | 0 (0.0%) |
| Community & Social Service | 0 (0.0%) | 26 (100.0%) |
| Education, Arts & Media | 0 (0.0%) | 6 (100.0%) |
| Legal Services & Support | 0 (0.0%) | 0 (0.0%) |
| Education Instruction & Library | 0 (0.0%) | 20 (100.0%) |
| Arts, Media & Entertainment | 0 (0.0%) | 0 (0.0%) |
| Health Diagnosing & Treating | 0 (0.0%) | 0 (0.0%) |
| Health Technologists | 0 (0.0%) | 0 (0.0%) |
| Total (Category) | 19 (42.2%) | 26 (57.8%) |
| Total (Overall) | 98 (43.6%) | 127 (56.4%) |
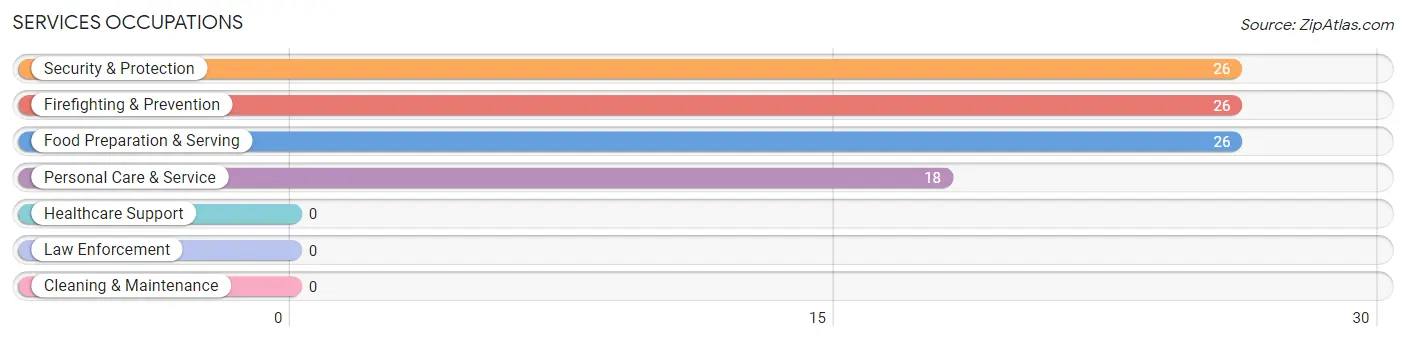
Services Occupations
The most common Services occupations in North Omak are Security & Protection (26 | 11.6%), Firefighting & Prevention (26 | 11.6%), Food Preparation & Serving (26 | 11.6%), and Personal Care & Service (18 | 8.0%).
Services Occupations by Sex
Within the Services occupations in North Omak, the most male-oriented occupations are Security & Protection (80.8%), and Firefighting & Prevention (80.8%), while the most female-oriented occupations are Food Preparation & Serving (100.0%), Personal Care & Service (100.0%), and Security & Protection (19.2%).
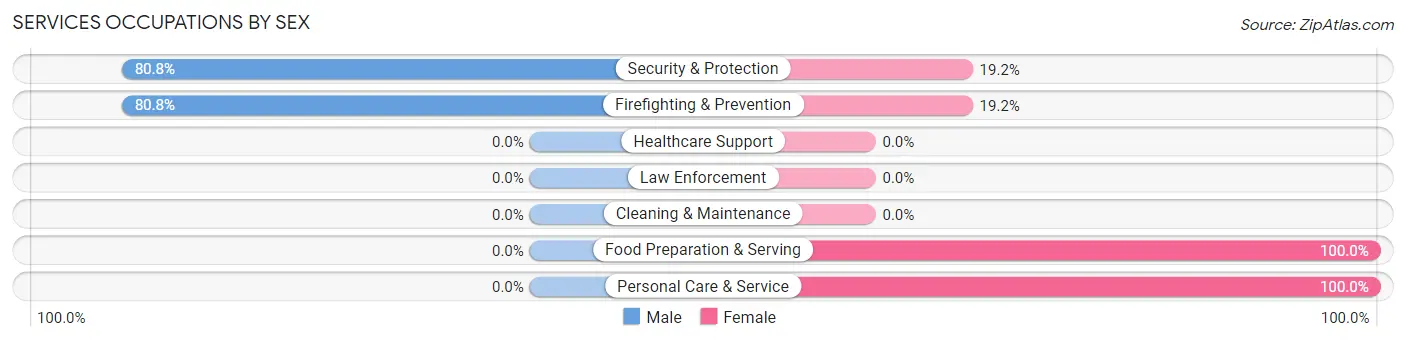
| Occupation | Male | Female |
| Healthcare Support | 0 (0.0%) | 0 (0.0%) |
| Security & Protection | 21 (80.8%) | 5 (19.2%) |
| Firefighting & Prevention | 21 (80.8%) | 5 (19.2%) |
| Law Enforcement | 0 (0.0%) | 0 (0.0%) |
| Food Preparation & Serving | 0 (0.0%) | 26 (100.0%) |
| Cleaning & Maintenance | 0 (0.0%) | 0 (0.0%) |
| Personal Care & Service | 0 (0.0%) | 18 (100.0%) |
| Total (Category) | 21 (30.0%) | 49 (70.0%) |
| Total (Overall) | 98 (43.6%) | 127 (56.4%) |
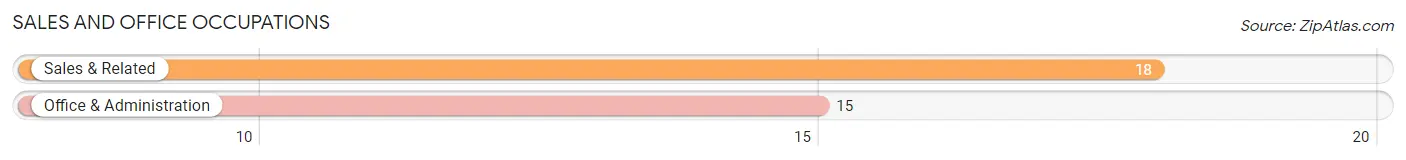
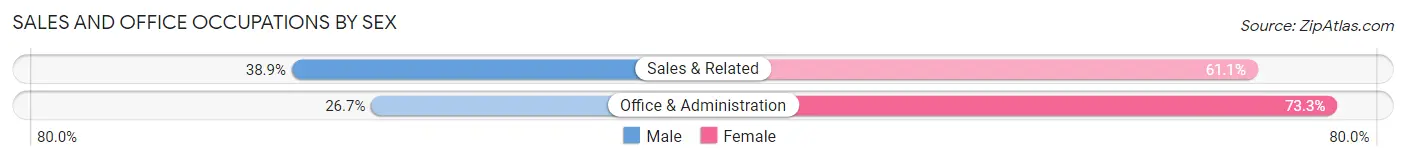
Sales and Office Occupations
The most common Sales and Office occupations in North Omak are Sales & Related (18 | 8.0%), and Office & Administration (15 | 6.7%).
Sales and Office Occupations by Sex
| Occupation | Male | Female |
| Sales & Related | 7 (38.9%) | 11 (61.1%) |
| Office & Administration | 4 (26.7%) | 11 (73.3%) |
| Total (Category) | 11 (33.3%) | 22 (66.7%) |
| Total (Overall) | 98 (43.6%) | 127 (56.4%) |
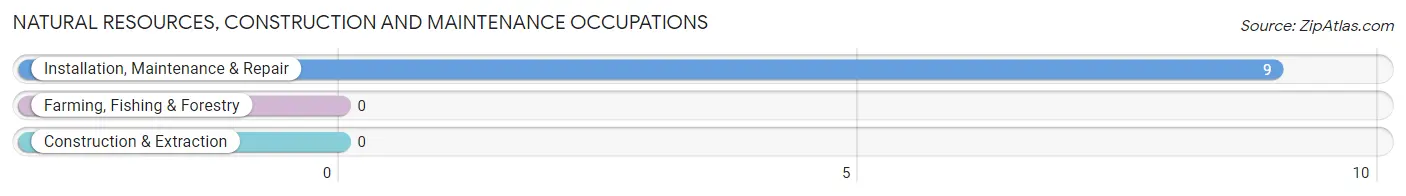
Natural Resources, Construction and Maintenance Occupations
The most common Natural Resources, Construction and Maintenance occupations in North Omak are , and Installation, Maintenance & Repair (9 | 4.0%).
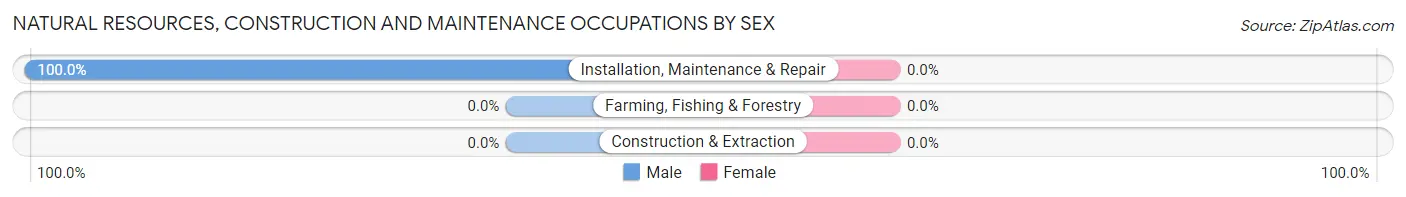
Natural Resources, Construction and Maintenance Occupations by Sex
| Occupation | Male | Female |
| Farming, Fishing & Forestry | 0 (0.0%) | 0 (0.0%) |
| Construction & Extraction | 0 (0.0%) | 0 (0.0%) |
| Installation, Maintenance & Repair | 9 (100.0%) | 0 (0.0%) |
| Total (Category) | 9 (100.0%) | 0 (0.0%) |
| Total (Overall) | 98 (43.6%) | 127 (56.4%) |
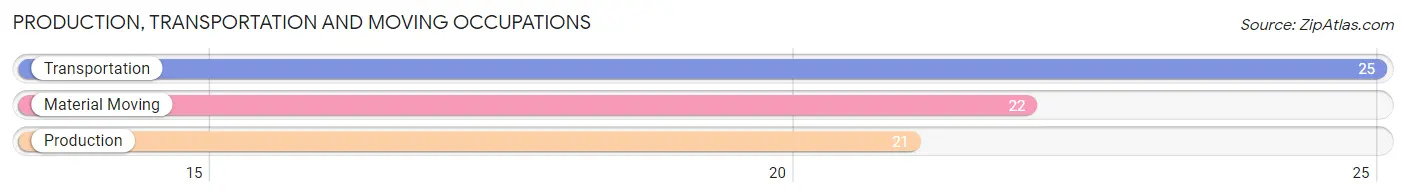
Production, Transportation and Moving Occupations
The most common Production, Transportation and Moving occupations in North Omak are Transportation (25 | 11.1%), Material Moving (22 | 9.8%), and Production (21 | 9.3%).
Production, Transportation and Moving Occupations by Sex
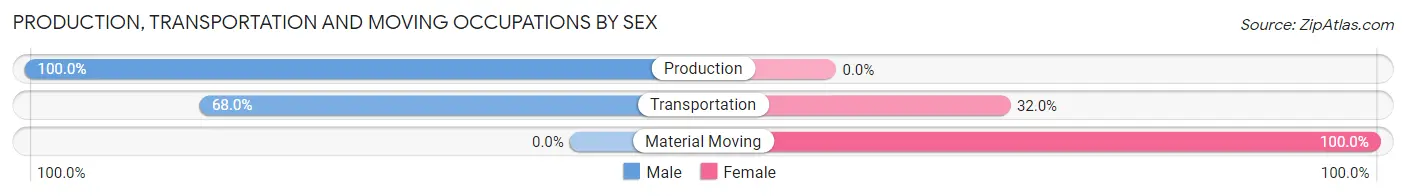
| Occupation | Male | Female |
| Production | 21 (100.0%) | 0 (0.0%) |
| Transportation | 17 (68.0%) | 8 (32.0%) |
| Material Moving | 0 (0.0%) | 22 (100.0%) |
| Total (Category) | 38 (55.9%) | 30 (44.1%) |
| Total (Overall) | 98 (43.6%) | 127 (56.4%) |
Employment Industries by Sex in North Omak
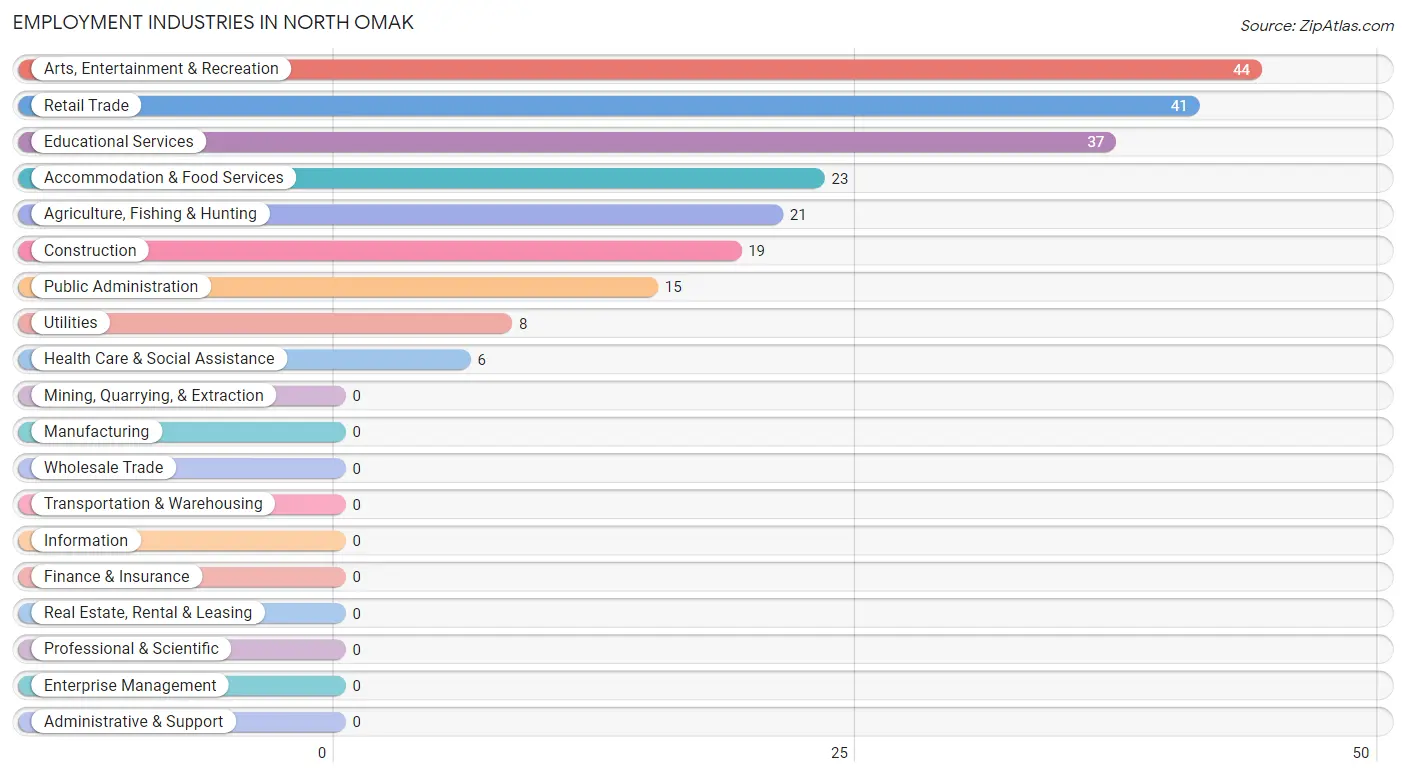
Employment Industries in North Omak
The major employment industries in North Omak include Arts, Entertainment & Recreation (44 | 19.6%), Retail Trade (41 | 18.2%), Educational Services (37 | 16.4%), Accommodation & Food Services (23 | 10.2%), and Agriculture, Fishing & Hunting (21 | 9.3%).
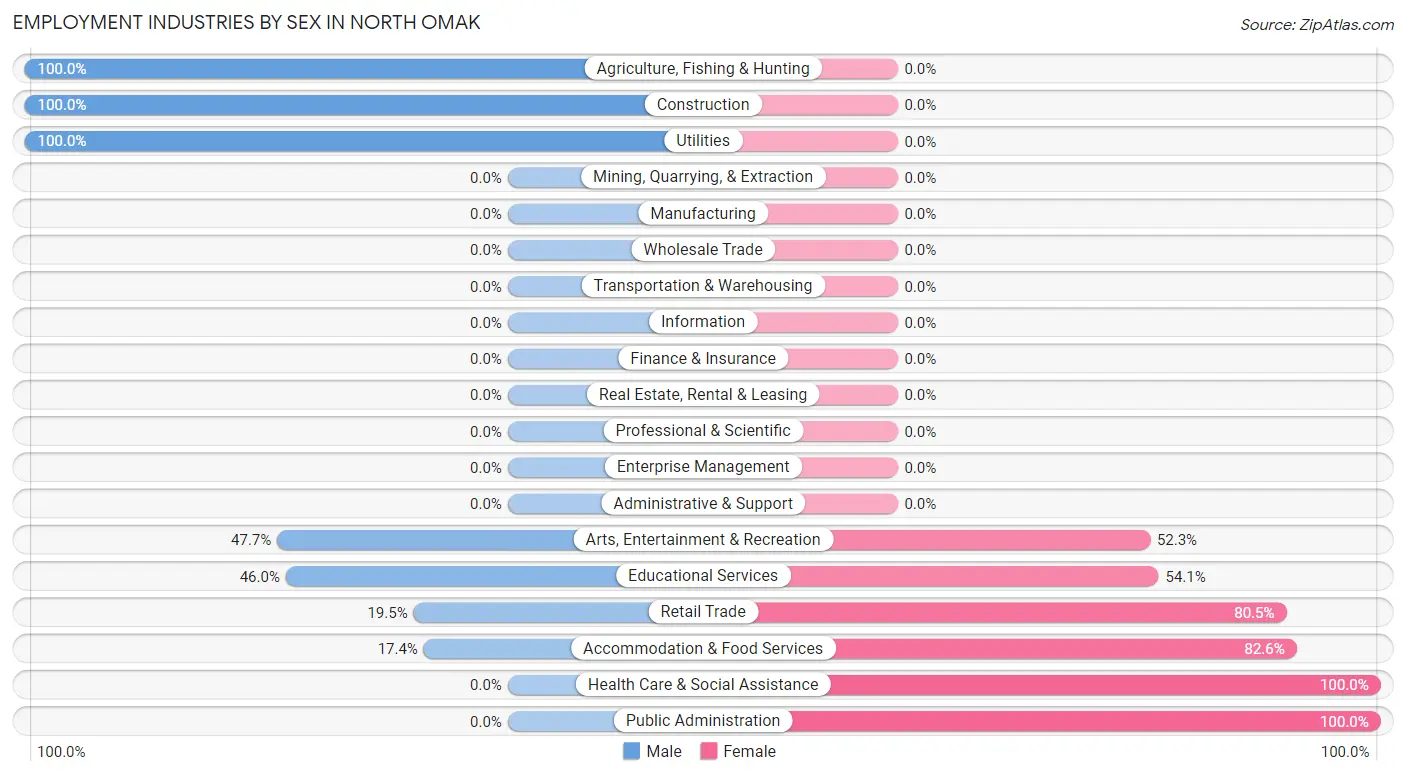
Employment Industries by Sex in North Omak
The North Omak industries that see more men than women are Agriculture, Fishing & Hunting (100.0%), Construction (100.0%), and Utilities (100.0%), whereas the industries that tend to have a higher number of women are Health Care & Social Assistance (100.0%), Public Administration (100.0%), and Accommodation & Food Services (82.6%).
| Industry | Male | Female |
| Agriculture, Fishing & Hunting | 21 (100.0%) | 0 (0.0%) |
| Mining, Quarrying, & Extraction | 0 (0.0%) | 0 (0.0%) |
| Construction | 19 (100.0%) | 0 (0.0%) |
| Manufacturing | 0 (0.0%) | 0 (0.0%) |
| Wholesale Trade | 0 (0.0%) | 0 (0.0%) |
| Retail Trade | 8 (19.5%) | 33 (80.5%) |
| Transportation & Warehousing | 0 (0.0%) | 0 (0.0%) |
| Utilities | 8 (100.0%) | 0 (0.0%) |
| Information | 0 (0.0%) | 0 (0.0%) |
| Finance & Insurance | 0 (0.0%) | 0 (0.0%) |
| Real Estate, Rental & Leasing | 0 (0.0%) | 0 (0.0%) |
| Professional & Scientific | 0 (0.0%) | 0 (0.0%) |
| Enterprise Management | 0 (0.0%) | 0 (0.0%) |
| Administrative & Support | 0 (0.0%) | 0 (0.0%) |
| Educational Services | 17 (46.0%) | 20 (54.0%) |
| Health Care & Social Assistance | 0 (0.0%) | 6 (100.0%) |
| Arts, Entertainment & Recreation | 21 (47.7%) | 23 (52.3%) |
| Accommodation & Food Services | 4 (17.4%) | 19 (82.6%) |
| Public Administration | 0 (0.0%) | 15 (100.0%) |
| Total | 98 (43.6%) | 127 (56.4%) |
Education in North Omak
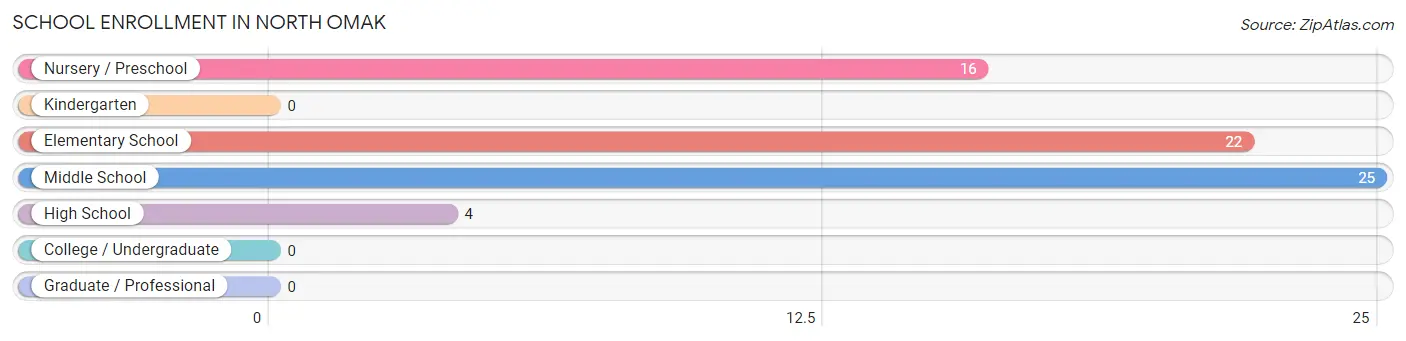
School Enrollment in North Omak
The most common levels of schooling among the 67 students in North Omak are middle school (25 | 37.3%), elementary school (22 | 32.8%), and nursery / preschool (16 | 23.9%).
| School Level | # Students | % Students |
| Nursery / Preschool | 16 | 23.9% |
| Kindergarten | 0 | 0.0% |
| Elementary School | 22 | 32.8% |
| Middle School | 25 | 37.3% |
| High School | 4 | 6.0% |
| College / Undergraduate | 0 | 0.0% |
| Graduate / Professional | 0 | 0.0% |
| Total | 67 | 100.0% |
School Enrollment by Age by Funding Source in North Omak
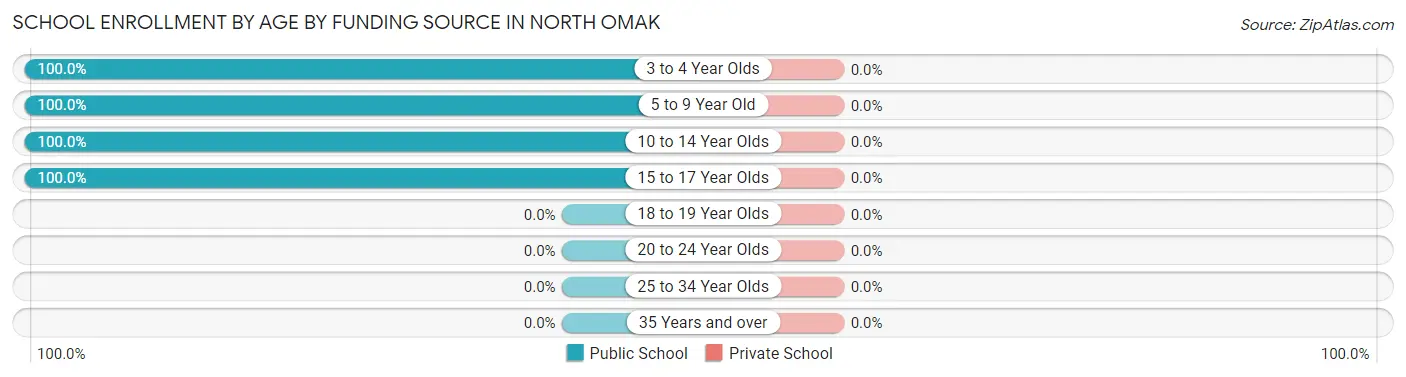
| Age Bracket | Public School | Private School |
| 3 to 4 Year Olds | 16 (100.0%) | 0 (0.0%) |
| 5 to 9 Year Old | 16 (100.0%) | 0 (0.0%) |
| 10 to 14 Year Olds | 31 (100.0%) | 0 (0.0%) |
| 15 to 17 Year Olds | 4 (100.0%) | 0 (0.0%) |
| 18 to 19 Year Olds | 0 (0.0%) | 0 (0.0%) |
| 20 to 24 Year Olds | 0 (0.0%) | 0 (0.0%) |
| 25 to 34 Year Olds | 0 (0.0%) | 0 (0.0%) |
| 35 Years and over | 0 (0.0%) | 0 (0.0%) |
| Total | 67 (100.0%) | 0 (0.0%) |
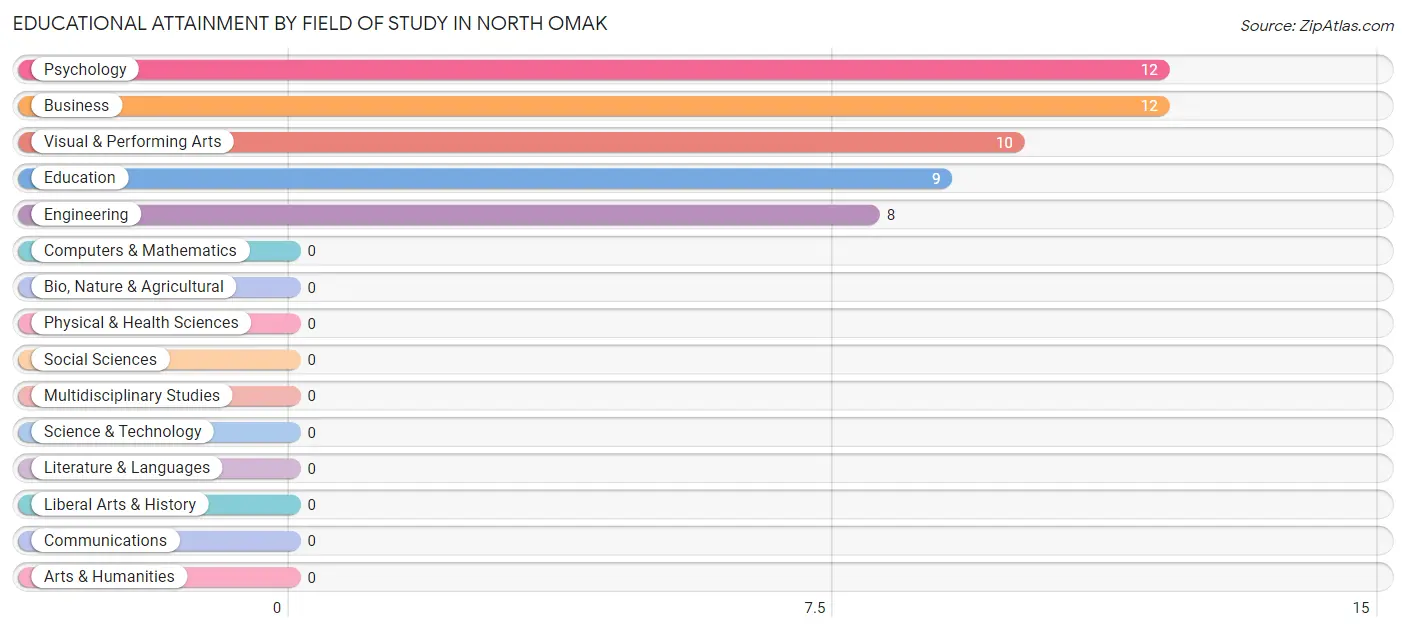
Educational Attainment by Field of Study in North Omak
Psychology (12 | 23.5%), business (12 | 23.5%), visual & performing arts (10 | 19.6%), education (9 | 17.6%), and engineering (8 | 15.7%) are the most common fields of study among 51 individuals in North Omak who have obtained a bachelor's degree or higher.
| Field of Study | # Graduates | % Graduates |
| Computers & Mathematics | 0 | 0.0% |
| Bio, Nature & Agricultural | 0 | 0.0% |
| Physical & Health Sciences | 0 | 0.0% |
| Psychology | 12 | 23.5% |
| Social Sciences | 0 | 0.0% |
| Engineering | 8 | 15.7% |
| Multidisciplinary Studies | 0 | 0.0% |
| Science & Technology | 0 | 0.0% |
| Business | 12 | 23.5% |
| Education | 9 | 17.6% |
| Literature & Languages | 0 | 0.0% |
| Liberal Arts & History | 0 | 0.0% |
| Visual & Performing Arts | 10 | 19.6% |
| Communications | 0 | 0.0% |
| Arts & Humanities | 0 | 0.0% |
| Total | 51 | 100.0% |
Transportation & Commute in North Omak
Vehicle Availability by Sex in North Omak
The most prevalent vehicle ownership categories in North Omak are males with 4 vehicles (39, accounting for 39.8%) and females with 4 vehicles (31, making up 30.7%).
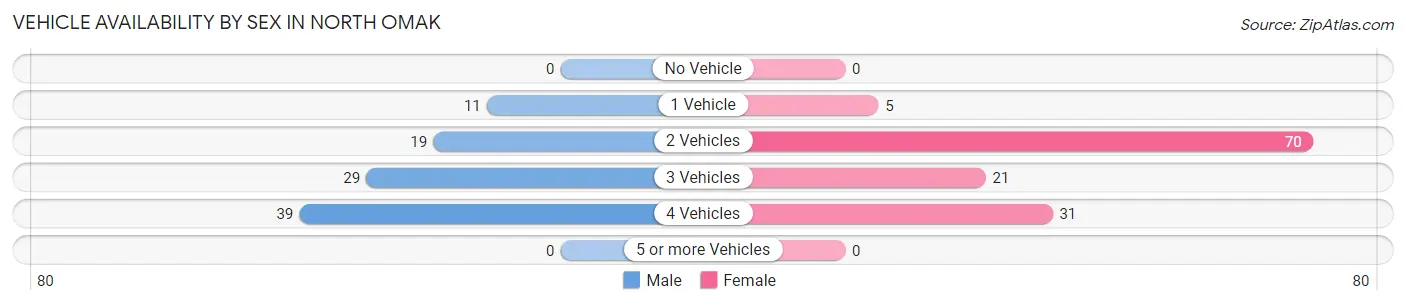
| Vehicles Available | Male | Female |
| No Vehicle | 0 (0.0%) | 0 (0.0%) |
| 1 Vehicle | 11 (11.2%) | 5 (3.9%) |
| 2 Vehicles | 19 (19.4%) | 70 (55.1%) |
| 3 Vehicles | 29 (29.6%) | 21 (16.5%) |
| 4 Vehicles | 39 (39.8%) | 31 (24.4%) |
| 5 or more Vehicles | 0 (0.0%) | 0 (0.0%) |
| Total | 98 (100.0%) | 127 (100.0%) |
Commute Time in North Omak
The most frequently occuring commute durations in North Omak are 5 to 9 minutes (56 commuters, 24.9%), 15 to 19 minutes (52 commuters, 23.1%), and 10 to 14 minutes (47 commuters, 20.9%).
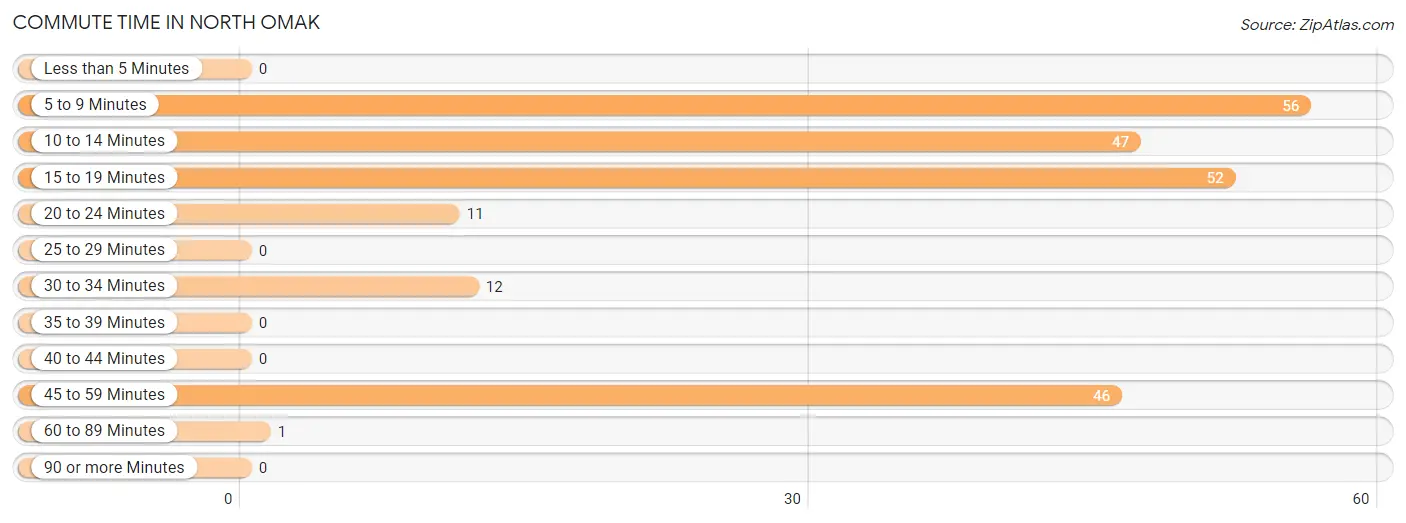
| Commute Time | # Commuters | % Commuters |
| Less than 5 Minutes | 0 | 0.0% |
| 5 to 9 Minutes | 56 | 24.9% |
| 10 to 14 Minutes | 47 | 20.9% |
| 15 to 19 Minutes | 52 | 23.1% |
| 20 to 24 Minutes | 11 | 4.9% |
| 25 to 29 Minutes | 0 | 0.0% |
| 30 to 34 Minutes | 12 | 5.3% |
| 35 to 39 Minutes | 0 | 0.0% |
| 40 to 44 Minutes | 0 | 0.0% |
| 45 to 59 Minutes | 46 | 20.4% |
| 60 to 89 Minutes | 1 | 0.4% |
| 90 or more Minutes | 0 | 0.0% |
Commute Time by Sex in North Omak
The most common commute times in North Omak are 15 to 19 minutes (36 commuters, 36.7%) for males and 5 to 9 minutes (49 commuters, 38.6%) for females.
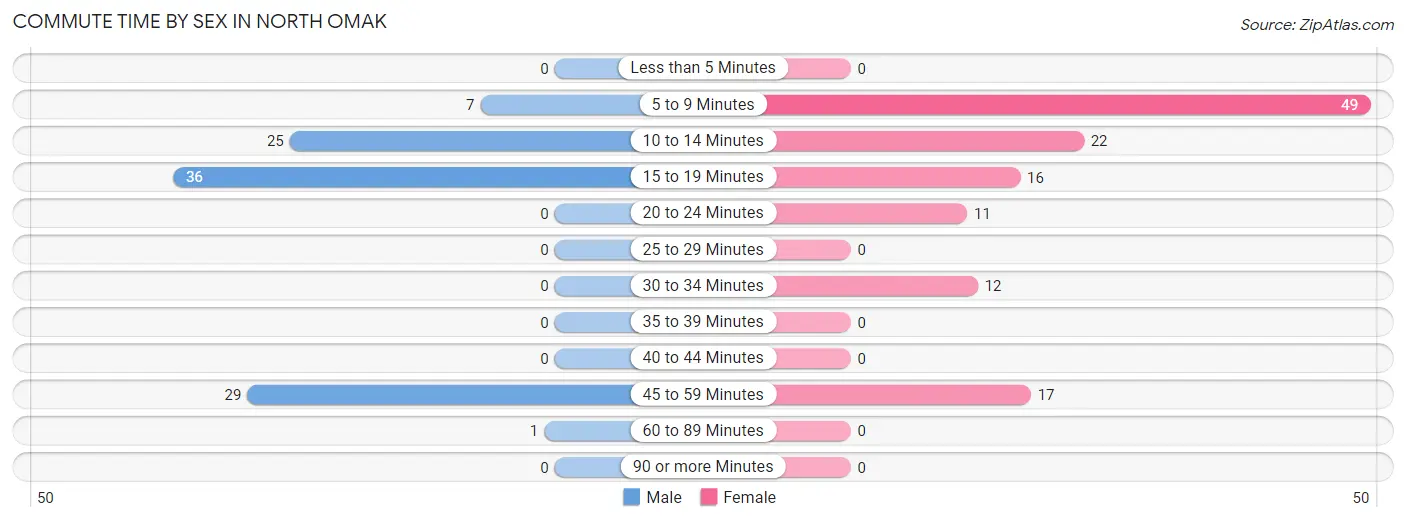
| Commute Time | Male | Female |
| Less than 5 Minutes | 0 (0.0%) | 0 (0.0%) |
| 5 to 9 Minutes | 7 (7.1%) | 49 (38.6%) |
| 10 to 14 Minutes | 25 (25.5%) | 22 (17.3%) |
| 15 to 19 Minutes | 36 (36.7%) | 16 (12.6%) |
| 20 to 24 Minutes | 0 (0.0%) | 11 (8.7%) |
| 25 to 29 Minutes | 0 (0.0%) | 0 (0.0%) |
| 30 to 34 Minutes | 0 (0.0%) | 12 (9.5%) |
| 35 to 39 Minutes | 0 (0.0%) | 0 (0.0%) |
| 40 to 44 Minutes | 0 (0.0%) | 0 (0.0%) |
| 45 to 59 Minutes | 29 (29.6%) | 17 (13.4%) |
| 60 to 89 Minutes | 1 (1.0%) | 0 (0.0%) |
| 90 or more Minutes | 0 (0.0%) | 0 (0.0%) |
Time of Departure to Work by Sex in North Omak
The most frequent times of departure to work in North Omak are 4:00 PM to 11:59 PM (28, 28.6%) for males and 7:00 AM to 7:29 AM (31, 24.4%) for females.
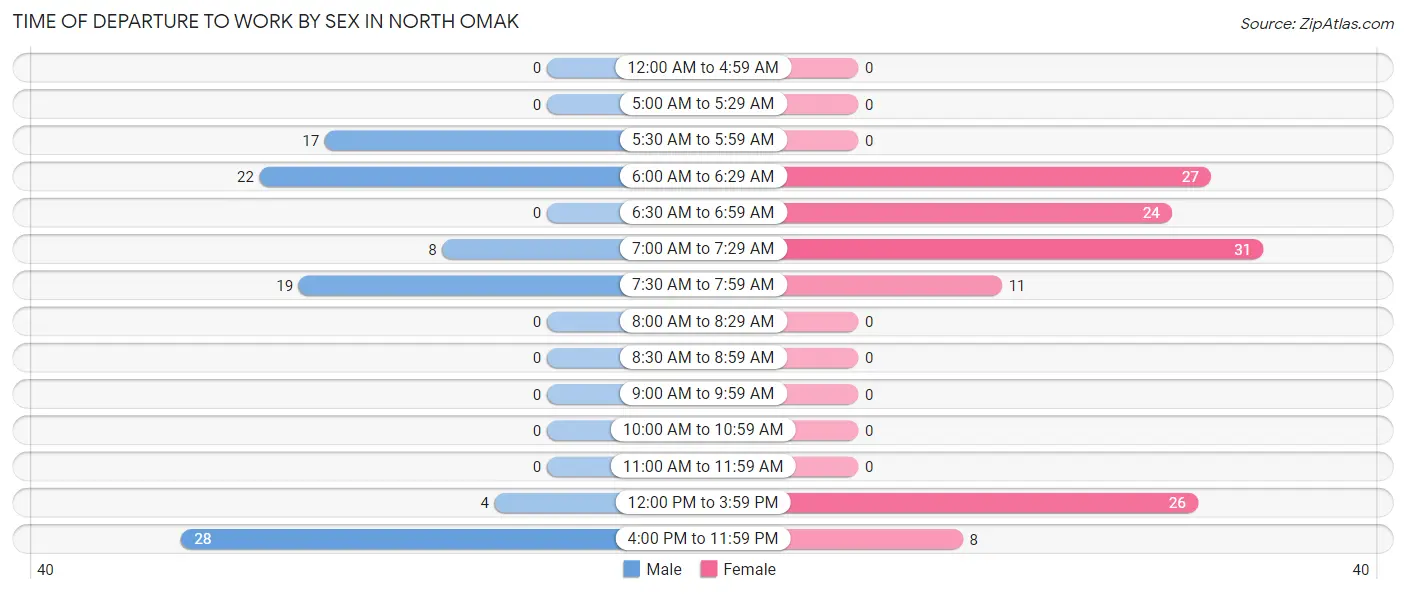
| Time of Departure | Male | Female |
| 12:00 AM to 4:59 AM | 0 (0.0%) | 0 (0.0%) |
| 5:00 AM to 5:29 AM | 0 (0.0%) | 0 (0.0%) |
| 5:30 AM to 5:59 AM | 17 (17.3%) | 0 (0.0%) |
| 6:00 AM to 6:29 AM | 22 (22.5%) | 27 (21.3%) |
| 6:30 AM to 6:59 AM | 0 (0.0%) | 24 (18.9%) |
| 7:00 AM to 7:29 AM | 8 (8.2%) | 31 (24.4%) |
| 7:30 AM to 7:59 AM | 19 (19.4%) | 11 (8.7%) |
| 8:00 AM to 8:29 AM | 0 (0.0%) | 0 (0.0%) |
| 8:30 AM to 8:59 AM | 0 (0.0%) | 0 (0.0%) |
| 9:00 AM to 9:59 AM | 0 (0.0%) | 0 (0.0%) |
| 10:00 AM to 10:59 AM | 0 (0.0%) | 0 (0.0%) |
| 11:00 AM to 11:59 AM | 0 (0.0%) | 0 (0.0%) |
| 12:00 PM to 3:59 PM | 4 (4.1%) | 26 (20.5%) |
| 4:00 PM to 11:59 PM | 28 (28.6%) | 8 (6.3%) |
| Total | 98 (100.0%) | 127 (100.0%) |
Housing Occupancy in North Omak
Occupancy by Ownership in North Omak
Of the total 175 dwellings in North Omak, owner-occupied units account for 104 (59.4%), while renter-occupied units make up 71 (40.6%).
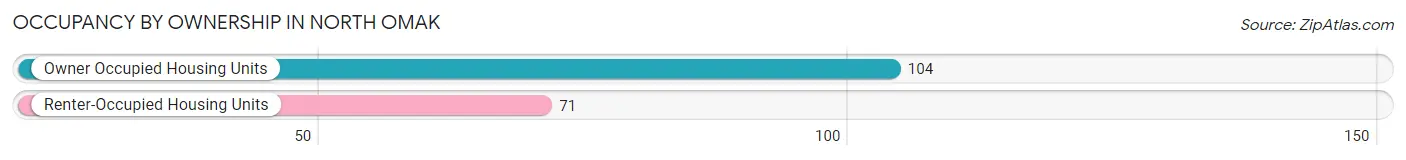
| Occupancy | # Housing Units | % Housing Units |
| Owner Occupied Housing Units | 104 | 59.4% |
| Renter-Occupied Housing Units | 71 | 40.6% |
| Total Occupied Housing Units | 175 | 100.0% |
Occupancy by Household Size in North Omak
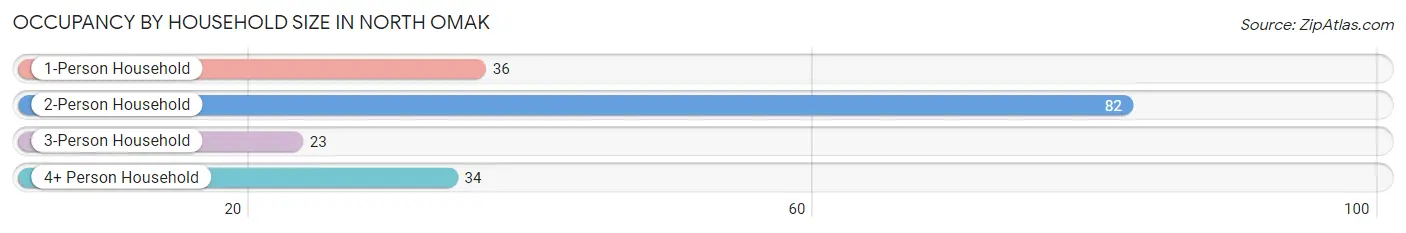
| Household Size | # Housing Units | % Housing Units |
| 1-Person Household | 36 | 20.6% |
| 2-Person Household | 82 | 46.9% |
| 3-Person Household | 23 | 13.1% |
| 4+ Person Household | 34 | 19.4% |
| Total Housing Units | 175 | 100.0% |
Occupancy by Ownership by Household Size in North Omak
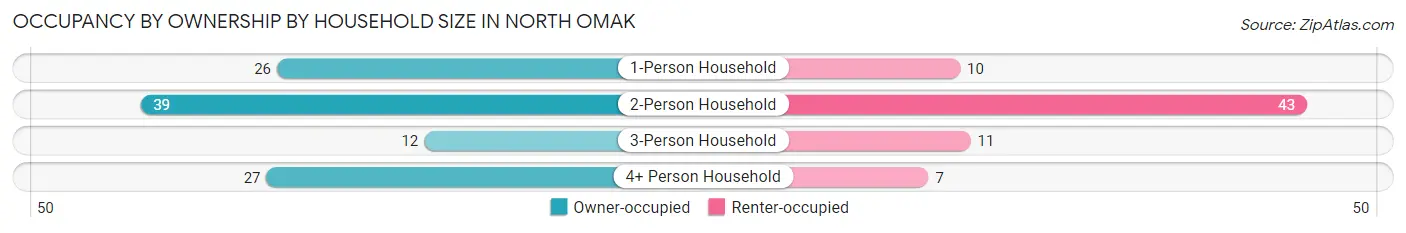
| Household Size | Owner-occupied | Renter-occupied |
| 1-Person Household | 26 (72.2%) | 10 (27.8%) |
| 2-Person Household | 39 (47.6%) | 43 (52.4%) |
| 3-Person Household | 12 (52.2%) | 11 (47.8%) |
| 4+ Person Household | 27 (79.4%) | 7 (20.6%) |
| Total Housing Units | 104 (59.4%) | 71 (40.6%) |
Occupancy by Educational Attainment in North Omak
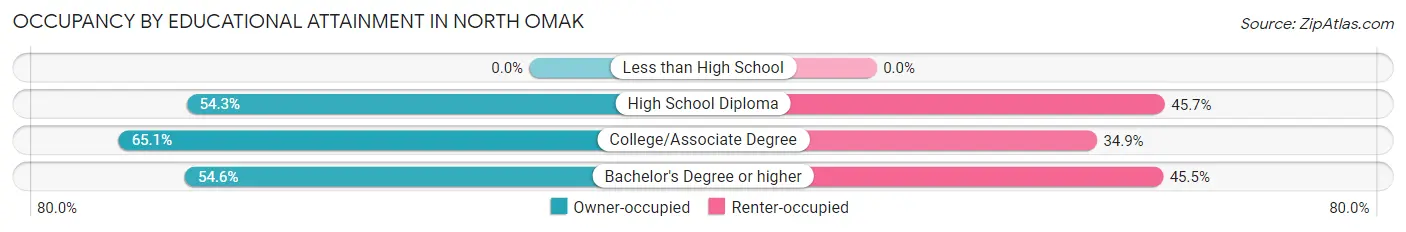
| Household Size | Owner-occupied | Renter-occupied |
| Less than High School | 0 (0.0%) | 0 (0.0%) |
| High School Diploma | 38 (54.3%) | 32 (45.7%) |
| College/Associate Degree | 54 (65.1%) | 29 (34.9%) |
| Bachelor's Degree or higher | 12 (54.5%) | 10 (45.5%) |
Occupancy by Age of Householder in North Omak
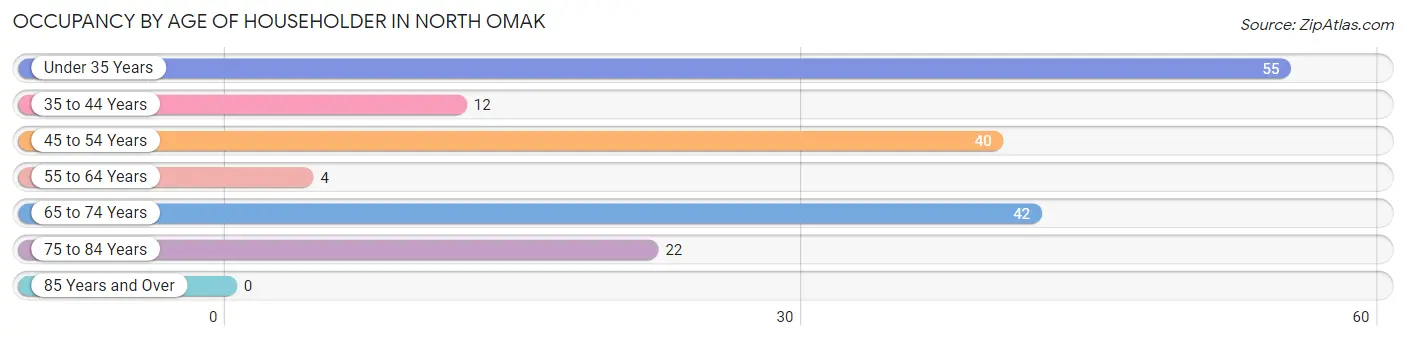
| Age Bracket | # Households | % Households |
| Under 35 Years | 55 | 31.4% |
| 35 to 44 Years | 12 | 6.9% |
| 45 to 54 Years | 40 | 22.9% |
| 55 to 64 Years | 4 | 2.3% |
| 65 to 74 Years | 42 | 24.0% |
| 75 to 84 Years | 22 | 12.6% |
| 85 Years and Over | 0 | 0.0% |
| Total | 175 | 100.0% |
Housing Finances in North Omak
Median Income by Occupancy in North Omak
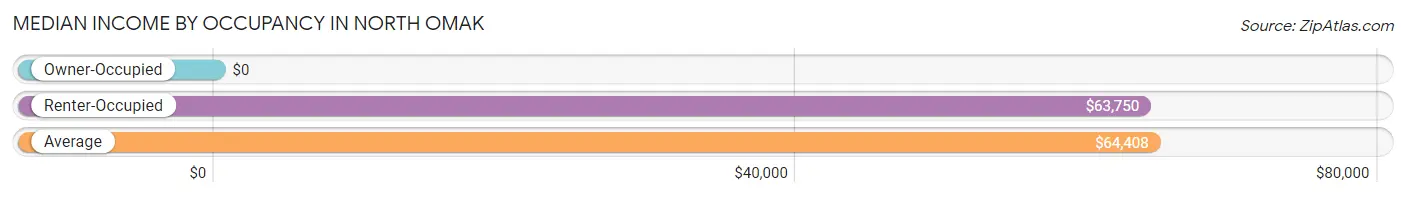
| Occupancy Type | # Households | Median Income |
| Owner-Occupied | 104 (59.4%) | $0 |
| Renter-Occupied | 71 (40.6%) | $63,750 |
| Average | 175 (100.0%) | $64,408 |
Occupancy by Householder Income Bracket in North Omak
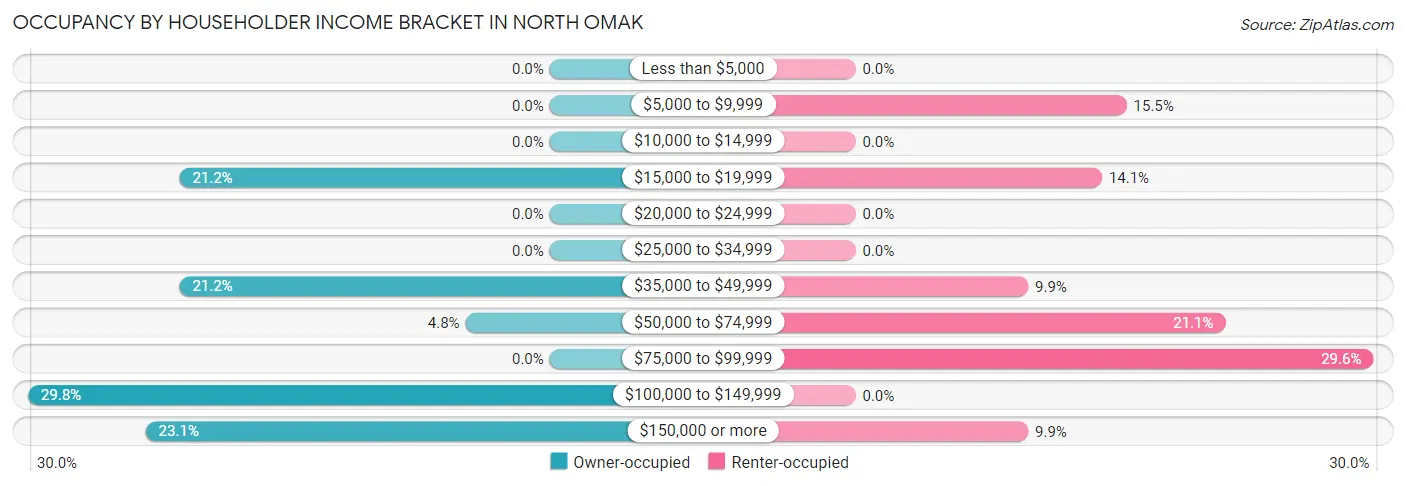
| Income Bracket | Owner-occupied | Renter-occupied |
| Less than $5,000 | 0 (0.0%) | 0 (0.0%) |
| $5,000 to $9,999 | 0 (0.0%) | 11 (15.5%) |
| $10,000 to $14,999 | 0 (0.0%) | 0 (0.0%) |
| $15,000 to $19,999 | 22 (21.1%) | 10 (14.1%) |
| $20,000 to $24,999 | 0 (0.0%) | 0 (0.0%) |
| $25,000 to $34,999 | 0 (0.0%) | 0 (0.0%) |
| $35,000 to $49,999 | 22 (21.1%) | 7 (9.9%) |
| $50,000 to $74,999 | 5 (4.8%) | 15 (21.1%) |
| $75,000 to $99,999 | 0 (0.0%) | 21 (29.6%) |
| $100,000 to $149,999 | 31 (29.8%) | 0 (0.0%) |
| $150,000 or more | 24 (23.1%) | 7 (9.9%) |
| Total | 104 (100.0%) | 71 (100.0%) |
Monthly Housing Cost Tiers in North Omak
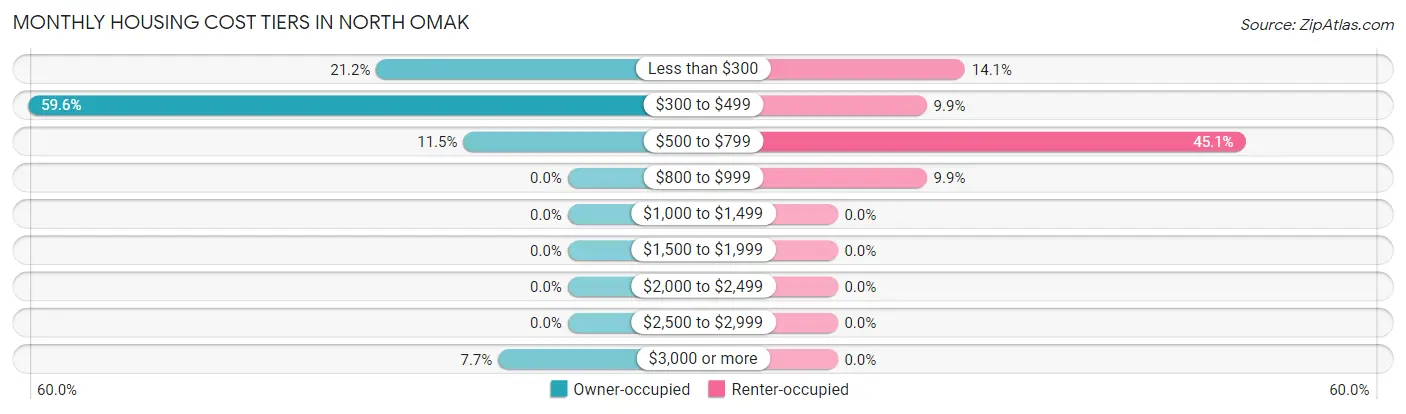
| Monthly Cost | Owner-occupied | Renter-occupied |
| Less than $300 | 22 (21.1%) | 10 (14.1%) |
| $300 to $499 | 62 (59.6%) | 7 (9.9%) |
| $500 to $799 | 12 (11.5%) | 32 (45.1%) |
| $800 to $999 | 0 (0.0%) | 7 (9.9%) |
| $1,000 to $1,499 | 0 (0.0%) | 0 (0.0%) |
| $1,500 to $1,999 | 0 (0.0%) | 0 (0.0%) |
| $2,000 to $2,499 | 0 (0.0%) | 0 (0.0%) |
| $2,500 to $2,999 | 0 (0.0%) | 0 (0.0%) |
| $3,000 or more | 8 (7.7%) | 0 (0.0%) |
| Total | 104 (100.0%) | 71 (100.0%) |
Physical Housing Characteristics in North Omak
Housing Structures in North Omak
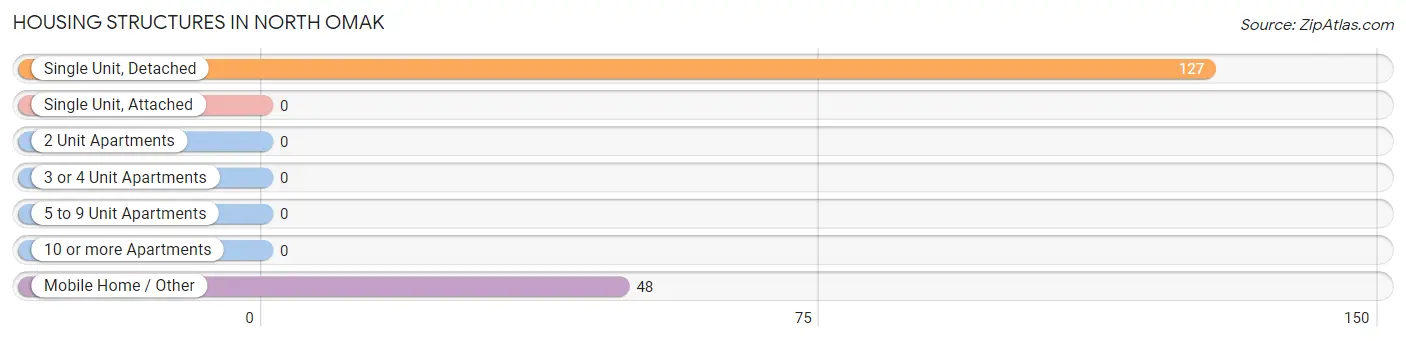
| Structure Type | # Housing Units | % Housing Units |
| Single Unit, Detached | 127 | 72.6% |
| Single Unit, Attached | 0 | 0.0% |
| 2 Unit Apartments | 0 | 0.0% |
| 3 or 4 Unit Apartments | 0 | 0.0% |
| 5 to 9 Unit Apartments | 0 | 0.0% |
| 10 or more Apartments | 0 | 0.0% |
| Mobile Home / Other | 48 | 27.4% |
| Total | 175 | 100.0% |
Housing Structures by Occupancy in North Omak
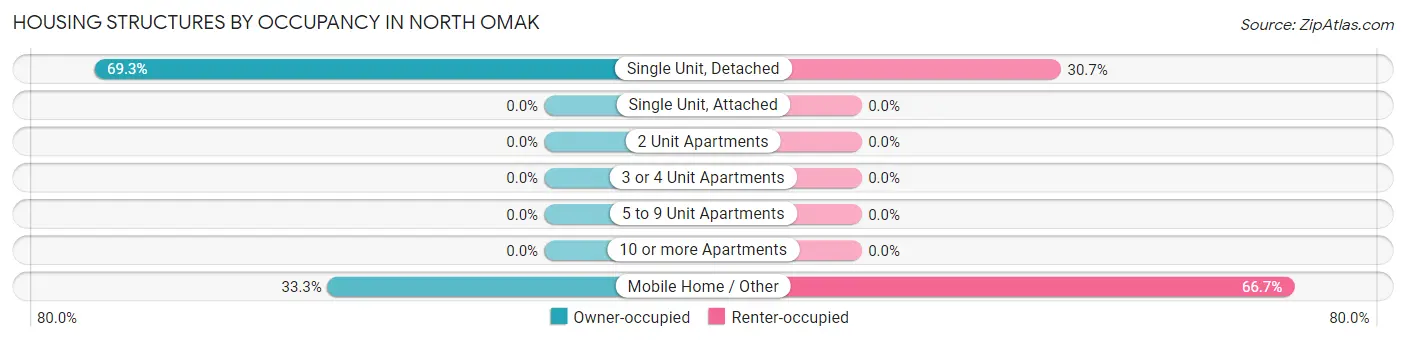
| Structure Type | Owner-occupied | Renter-occupied |
| Single Unit, Detached | 88 (69.3%) | 39 (30.7%) |
| Single Unit, Attached | 0 (0.0%) | 0 (0.0%) |
| 2 Unit Apartments | 0 (0.0%) | 0 (0.0%) |
| 3 or 4 Unit Apartments | 0 (0.0%) | 0 (0.0%) |
| 5 to 9 Unit Apartments | 0 (0.0%) | 0 (0.0%) |
| 10 or more Apartments | 0 (0.0%) | 0 (0.0%) |
| Mobile Home / Other | 16 (33.3%) | 32 (66.7%) |
| Total | 104 (59.4%) | 71 (40.6%) |
Housing Structures by Number of Rooms in North Omak
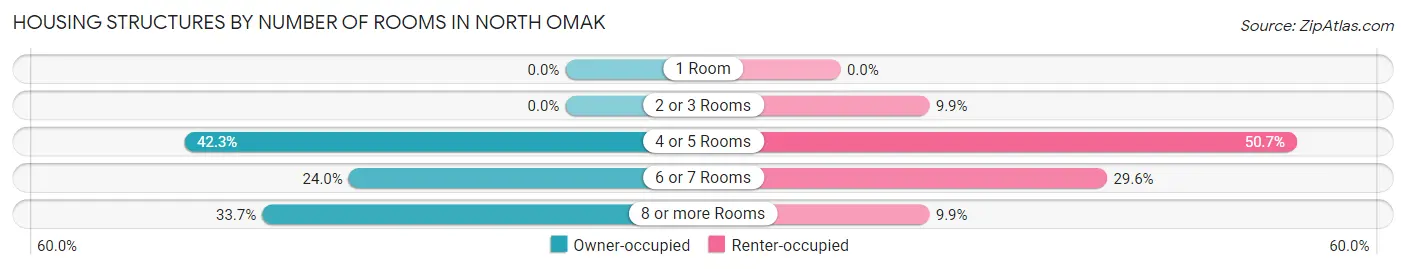
| Number of Rooms | Owner-occupied | Renter-occupied |
| 1 Room | 0 (0.0%) | 0 (0.0%) |
| 2 or 3 Rooms | 0 (0.0%) | 7 (9.9%) |
| 4 or 5 Rooms | 44 (42.3%) | 36 (50.7%) |
| 6 or 7 Rooms | 25 (24.0%) | 21 (29.6%) |
| 8 or more Rooms | 35 (33.7%) | 7 (9.9%) |
| Total | 104 (100.0%) | 71 (100.0%) |
Housing Structure by Heating Type in North Omak
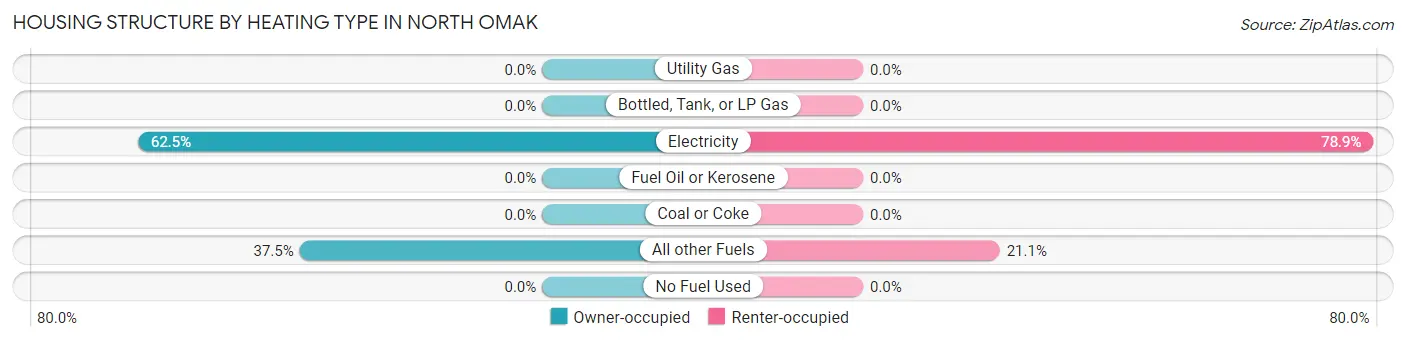
| Heating Type | Owner-occupied | Renter-occupied |
| Utility Gas | 0 (0.0%) | 0 (0.0%) |
| Bottled, Tank, or LP Gas | 0 (0.0%) | 0 (0.0%) |
| Electricity | 65 (62.5%) | 56 (78.9%) |
| Fuel Oil or Kerosene | 0 (0.0%) | 0 (0.0%) |
| Coal or Coke | 0 (0.0%) | 0 (0.0%) |
| All other Fuels | 39 (37.5%) | 15 (21.1%) |
| No Fuel Used | 0 (0.0%) | 0 (0.0%) |
| Total | 104 (100.0%) | 71 (100.0%) |
Household Vehicle Usage in North Omak
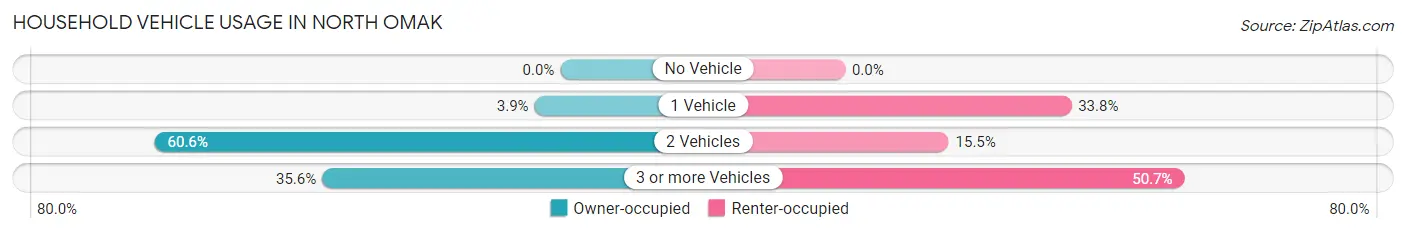
| Vehicles per Household | Owner-occupied | Renter-occupied |
| No Vehicle | 0 (0.0%) | 0 (0.0%) |
| 1 Vehicle | 4 (3.8%) | 24 (33.8%) |
| 2 Vehicles | 63 (60.6%) | 11 (15.5%) |
| 3 or more Vehicles | 37 (35.6%) | 36 (50.7%) |
| Total | 104 (100.0%) | 71 (100.0%) |
Real Estate & Mortgages in North Omak
Real Estate and Mortgage Overview in North Omak
| Characteristic | Without Mortgage | With Mortgage |
| Housing Units | 84 | 20 |
| Median Property Value | - | - |
| Median Household Income | - | - |
| Monthly Housing Costs | $350 | $8 |
| Real Estate Taxes | $2,305 | $12 |
Property Value by Mortgage Status in North Omak
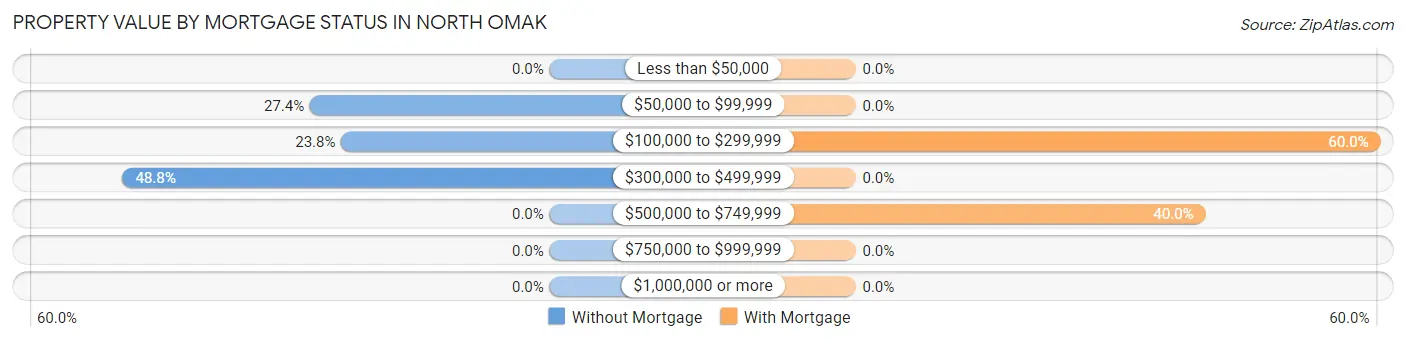
| Property Value | Without Mortgage | With Mortgage |
| Less than $50,000 | 0 (0.0%) | 0 (0.0%) |
| $50,000 to $99,999 | 23 (27.4%) | 0 (0.0%) |
| $100,000 to $299,999 | 20 (23.8%) | 12 (60.0%) |
| $300,000 to $499,999 | 41 (48.8%) | 0 (0.0%) |
| $500,000 to $749,999 | 0 (0.0%) | 8 (40.0%) |
| $750,000 to $999,999 | 0 (0.0%) | 0 (0.0%) |
| $1,000,000 or more | 0 (0.0%) | 0 (0.0%) |
| Total | 84 (100.0%) | 20 (100.0%) |
Household Income by Mortgage Status in North Omak
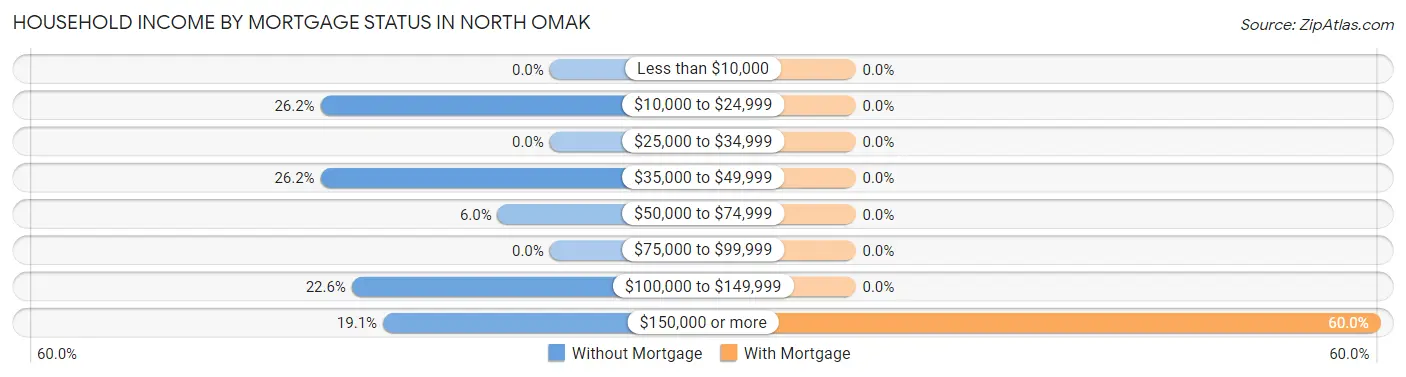
| Household Income | Without Mortgage | With Mortgage |
| Less than $10,000 | 0 (0.0%) | 0 (0.0%) |
| $10,000 to $24,999 | 22 (26.2%) | 0 (0.0%) |
| $25,000 to $34,999 | 0 (0.0%) | 0 (0.0%) |
| $35,000 to $49,999 | 22 (26.2%) | 0 (0.0%) |
| $50,000 to $74,999 | 5 (5.9%) | 0 (0.0%) |
| $75,000 to $99,999 | 0 (0.0%) | 0 (0.0%) |
| $100,000 to $149,999 | 19 (22.6%) | 0 (0.0%) |
| $150,000 or more | 16 (19.1%) | 12 (60.0%) |
| Total | 84 (100.0%) | 20 (100.0%) |
Property Value to Household Income Ratio in North Omak
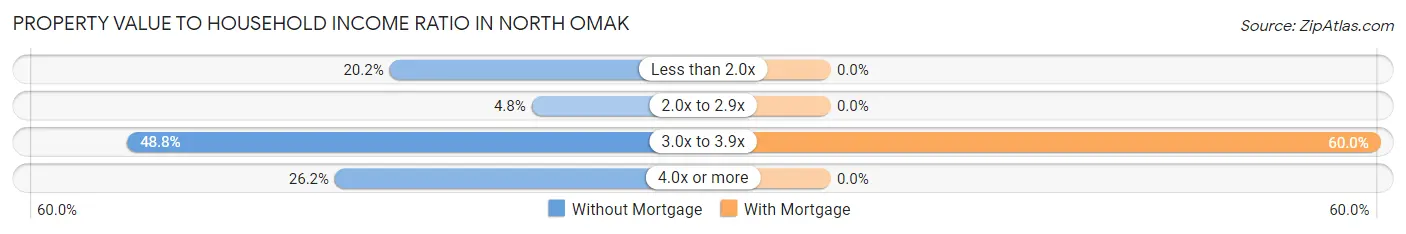
| Value-to-Income Ratio | Without Mortgage | With Mortgage |
| Less than 2.0x | 17 (20.2%) | 0 (0.0%) |
| 2.0x to 2.9x | 4 (4.8%) | 0 (0.0%) |
| 3.0x to 3.9x | 41 (48.8%) | 12 (60.0%) |
| 4.0x or more | 22 (26.2%) | 0 (0.0%) |
| Total | 84 (100.0%) | 20 (100.0%) |
Real Estate Taxes by Mortgage Status in North Omak
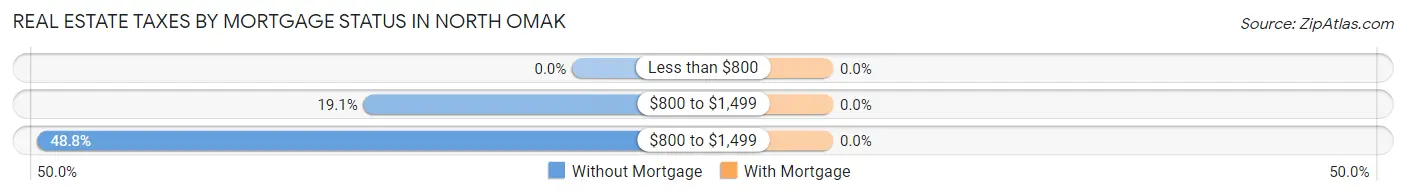
| Property Taxes | Without Mortgage | With Mortgage |
| Less than $800 | 0 (0.0%) | 0 (0.0%) |
| $800 to $1,499 | 16 (19.1%) | 0 (0.0%) |
| $800 to $1,499 | 41 (48.8%) | 0 (0.0%) |
| Total | 84 (100.0%) | 20 (100.0%) |
Health & Disability in North Omak
Health Insurance Coverage by Age in North Omak
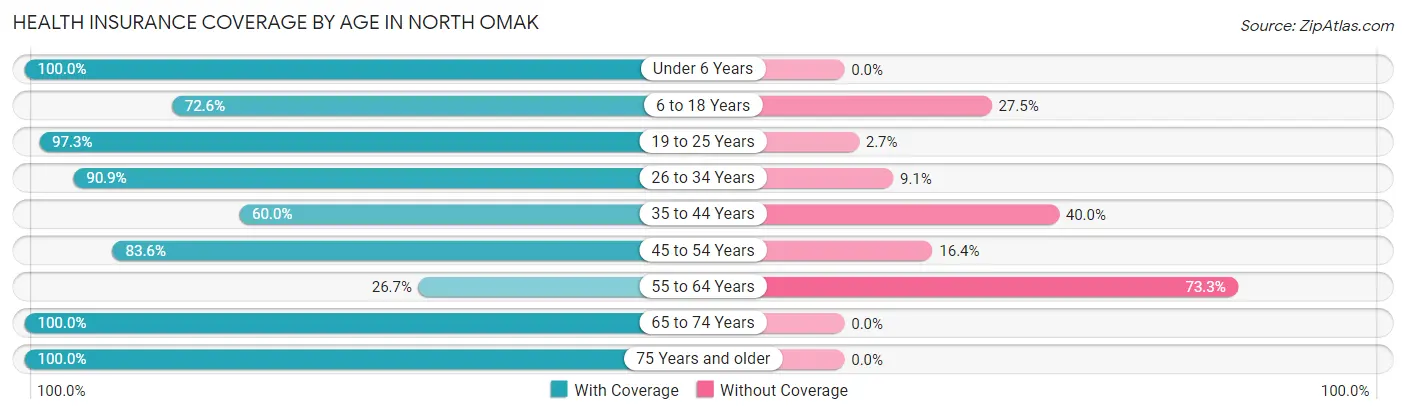
| Age Bracket | With Coverage | Without Coverage |
| Under 6 Years | 24 (100.0%) | 0 (0.0%) |
| 6 to 18 Years | 37 (72.6%) | 14 (27.5%) |
| 19 to 25 Years | 36 (97.3%) | 1 (2.7%) |
| 26 to 34 Years | 40 (90.9%) | 4 (9.1%) |
| 35 to 44 Years | 12 (60.0%) | 8 (40.0%) |
| 45 to 54 Years | 56 (83.6%) | 11 (16.4%) |
| 55 to 64 Years | 4 (26.7%) | 11 (73.3%) |
| 65 to 74 Years | 98 (100.0%) | 0 (0.0%) |
| 75 Years and older | 39 (100.0%) | 0 (0.0%) |
| Total | 346 (87.6%) | 49 (12.4%) |
Health Insurance Coverage by Citizenship Status in North Omak
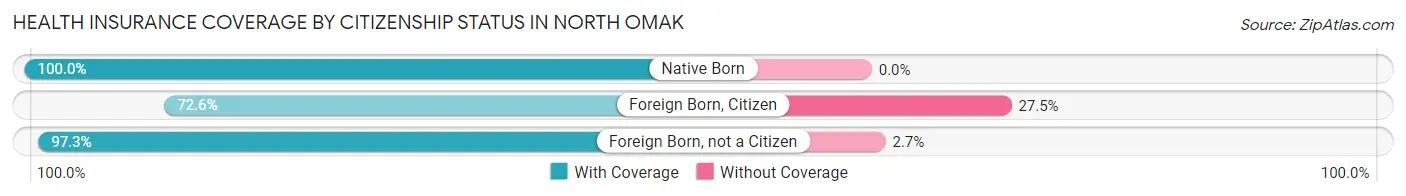
| Citizenship Status | With Coverage | Without Coverage |
| Native Born | 24 (100.0%) | 0 (0.0%) |
| Foreign Born, Citizen | 37 (72.6%) | 14 (27.5%) |
| Foreign Born, not a Citizen | 36 (97.3%) | 1 (2.7%) |
Health Insurance Coverage by Household Income in North Omak
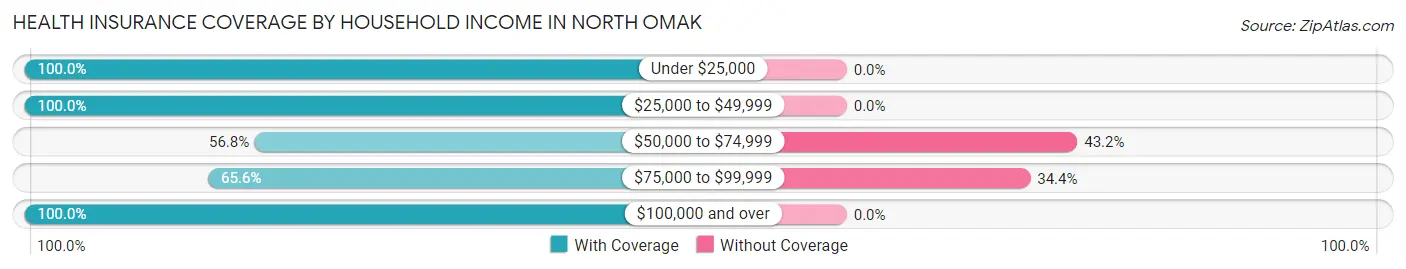
| Household Income | With Coverage | Without Coverage |
| Under $25,000 | 94 (100.0%) | 0 (0.0%) |
| $25,000 to $49,999 | 44 (100.0%) | 0 (0.0%) |
| $50,000 to $74,999 | 50 (56.8%) | 38 (43.2%) |
| $75,000 to $99,999 | 21 (65.6%) | 11 (34.4%) |
| $100,000 and over | 137 (100.0%) | 0 (0.0%) |
Public vs Private Health Insurance Coverage by Age in North Omak
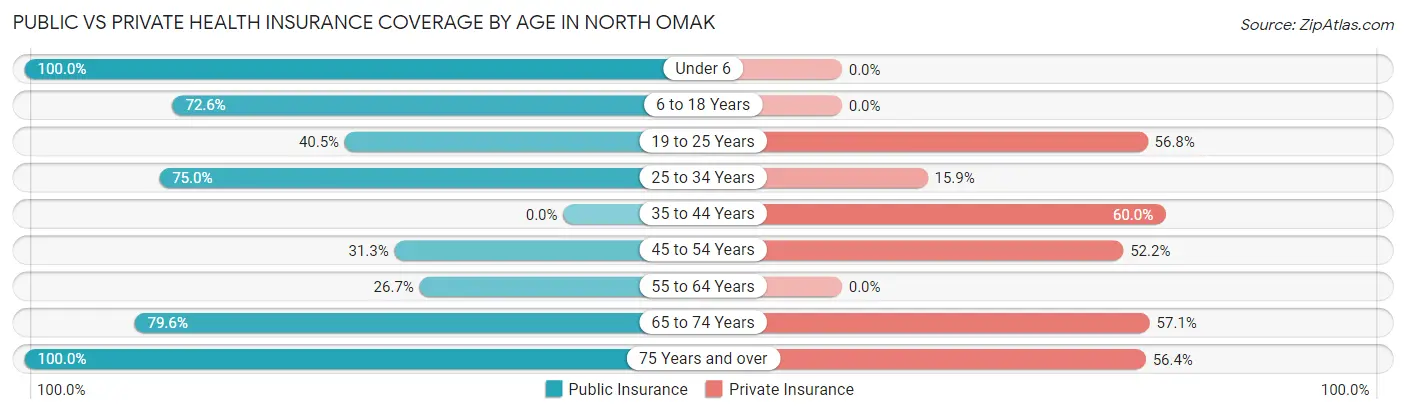
| Age Bracket | Public Insurance | Private Insurance |
| Under 6 | 24 (100.0%) | 0 (0.0%) |
| 6 to 18 Years | 37 (72.6%) | 0 (0.0%) |
| 19 to 25 Years | 15 (40.5%) | 21 (56.8%) |
| 25 to 34 Years | 33 (75.0%) | 7 (15.9%) |
| 35 to 44 Years | 0 (0.0%) | 12 (60.0%) |
| 45 to 54 Years | 21 (31.3%) | 35 (52.2%) |
| 55 to 64 Years | 4 (26.7%) | 0 (0.0%) |
| 65 to 74 Years | 78 (79.6%) | 56 (57.1%) |
| 75 Years and over | 39 (100.0%) | 22 (56.4%) |
| Total | 251 (63.5%) | 153 (38.7%) |
Disability Status by Sex by Age in North Omak
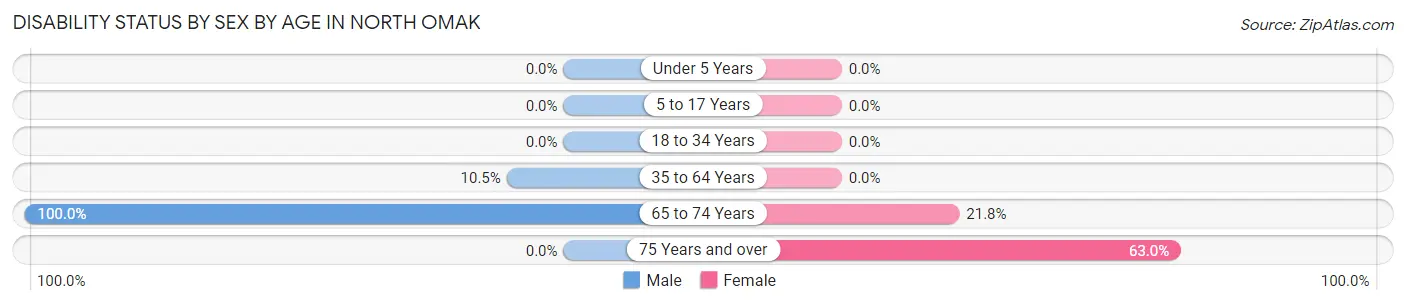
| Age Bracket | Male | Female |
| Under 5 Years | 0 (0.0%) | 0 (0.0%) |
| 5 to 17 Years | 0 (0.0%) | 0 (0.0%) |
| 18 to 34 Years | 0 (0.0%) | 0 (0.0%) |
| 35 to 64 Years | 4 (10.5%) | 0 (0.0%) |
| 65 to 74 Years | 43 (100.0%) | 12 (21.8%) |
| 75 Years and over | 0 (0.0%) | 17 (63.0%) |
Disability Class by Sex by Age in North Omak
Disability Class: Hearing Difficulty
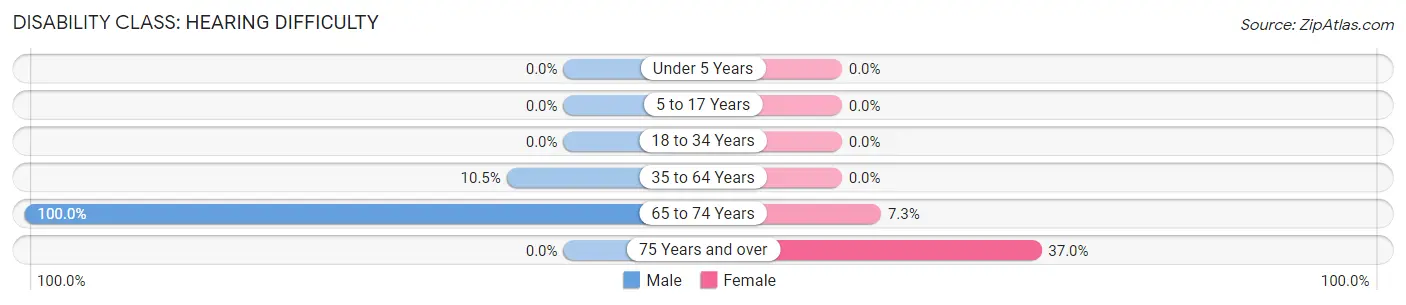
| Age Bracket | Male | Female |
| Under 5 Years | 0 (0.0%) | 0 (0.0%) |
| 5 to 17 Years | 0 (0.0%) | 0 (0.0%) |
| 18 to 34 Years | 0 (0.0%) | 0 (0.0%) |
| 35 to 64 Years | 4 (10.5%) | 0 (0.0%) |
| 65 to 74 Years | 43 (100.0%) | 4 (7.3%) |
| 75 Years and over | 0 (0.0%) | 10 (37.0%) |
Disability Class: Vision Difficulty
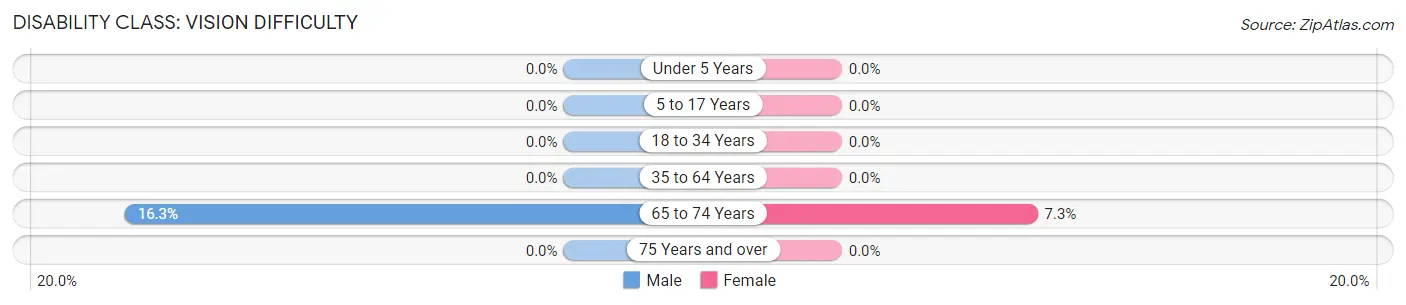
| Age Bracket | Male | Female |
| Under 5 Years | 0 (0.0%) | 0 (0.0%) |
| 5 to 17 Years | 0 (0.0%) | 0 (0.0%) |
| 18 to 34 Years | 0 (0.0%) | 0 (0.0%) |
| 35 to 64 Years | 0 (0.0%) | 0 (0.0%) |
| 65 to 74 Years | 7 (16.3%) | 4 (7.3%) |
| 75 Years and over | 0 (0.0%) | 0 (0.0%) |
Disability Class: Cognitive Difficulty
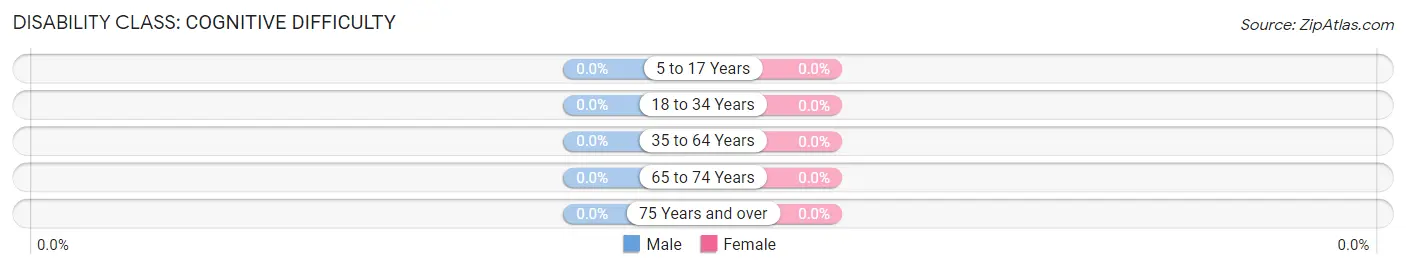
| Age Bracket | Male | Female |
| 5 to 17 Years | 0 (0.0%) | 0 (0.0%) |
| 18 to 34 Years | 0 (0.0%) | 0 (0.0%) |
| 35 to 64 Years | 0 (0.0%) | 0 (0.0%) |
| 65 to 74 Years | 0 (0.0%) | 0 (0.0%) |
| 75 Years and over | 0 (0.0%) | 0 (0.0%) |
Disability Class: Ambulatory Difficulty
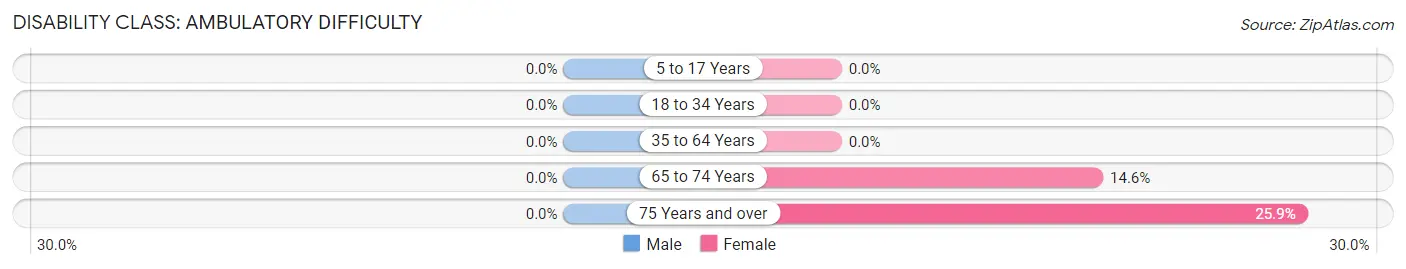
| Age Bracket | Male | Female |
| 5 to 17 Years | 0 (0.0%) | 0 (0.0%) |
| 18 to 34 Years | 0 (0.0%) | 0 (0.0%) |
| 35 to 64 Years | 0 (0.0%) | 0 (0.0%) |
| 65 to 74 Years | 0 (0.0%) | 8 (14.5%) |
| 75 Years and over | 0 (0.0%) | 7 (25.9%) |
Disability Class: Self-Care Difficulty
| Age Bracket | Male | Female |
| 5 to 17 Years | 0 (0.0%) | 0 (0.0%) |
| 18 to 34 Years | 0 (0.0%) | 0 (0.0%) |
| 35 to 64 Years | 0 (0.0%) | 0 (0.0%) |
| 65 to 74 Years | 0 (0.0%) | 0 (0.0%) |
| 75 Years and over | 0 (0.0%) | 0 (0.0%) |
Technology Access in North Omak
Computing Device Access in North Omak
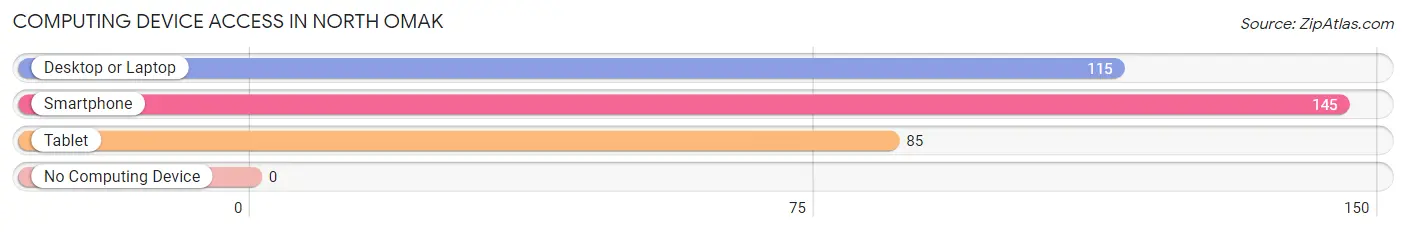
| Device Type | # Households | % Households |
| Desktop or Laptop | 115 | 65.7% |
| Smartphone | 145 | 82.9% |
| Tablet | 85 | 48.6% |
| No Computing Device | 0 | 0.0% |
| Total | 175 | 100.0% |
Internet Access in North Omak
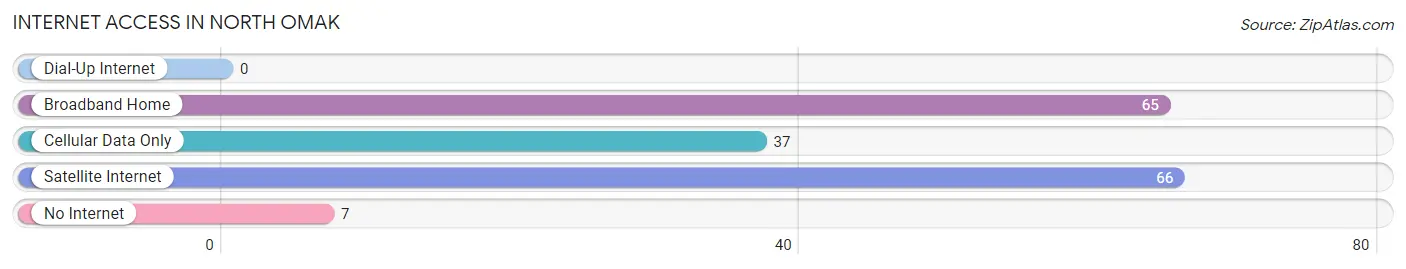
| Internet Type | # Households | % Households |
| Dial-Up Internet | 0 | 0.0% |
| Broadband Home | 65 | 37.1% |
| Cellular Data Only | 37 | 21.1% |
| Satellite Internet | 66 | 37.7% |
| No Internet | 7 | 4.0% |
| Total | 175 | 100.0% |
North Omak Summary
History
North Omak is a small unincorporated community located in Okanogan County, Washington. It is situated on the banks of the Okanogan River, approximately 10 miles north of the city of Omak. The area was first settled in the late 1800s by homesteaders and ranchers, and the town was officially established in 1909.
The area was originally inhabited by the Colville Confederated Tribes, who had lived in the area for thousands of years. The first white settlers arrived in the late 1800s, and the town was officially established in 1909. The town was named after the nearby Omak Creek, which was named after a Native American word meaning “place of many fish”.
The town grew slowly over the years, and by the 1950s it had become a popular destination for tourists and outdoor enthusiasts. The area is known for its beautiful scenery, including the nearby Okanogan National Forest and the Columbia River.
Geography
North Omak is located in Okanogan County, Washington, approximately 10 miles north of the city of Omak. The town is situated on the banks of the Okanogan River, and is surrounded by the Okanogan National Forest. The area is known for its beautiful scenery, including the nearby Columbia River.
The climate in North Omak is semi-arid, with hot summers and cold winters. The average annual temperature is around 50°F (10°C), and the average annual precipitation is around 12 inches (30 cm).
Economy
The economy of North Omak is largely based on agriculture and tourism. The area is known for its beautiful scenery, and is a popular destination for outdoor enthusiasts. The town is also home to several small businesses, including restaurants, shops, and a local winery.
The area is also home to several large agricultural operations, including cattle ranches, fruit orchards, and vineyards. The nearby Okanogan National Forest is also a major source of employment for the area, providing jobs in forestry, recreation, and conservation.
Demographics
As of the 2010 census, the population of North Omak was 1,845. The racial makeup of the town was 94.3% White, 0.7% Native American, 0.3% Asian, 0.2% African American, 0.1% Pacific Islander, and 4.4% from other races. The median household income was $37,917, and the median family income was $41,250.
The town is served by the Omak School District, which includes two elementary schools, one middle school, and one high school. The town is also home to several churches, including the North Omak United Methodist Church and the North Omak Community Church.
Conclusion
North Omak is a small unincorporated community located in Okanogan County, Washington. It is situated on the banks of the Okanogan River, and is surrounded by the Okanogan National Forest. The area is known for its beautiful scenery, and is a popular destination for outdoor enthusiasts. The economy of North Omak is largely based on agriculture and tourism, and the town is also home to several small businesses. The population of North Omak was 1,845 as of the 2010 census, and the median household income was $37,917. The town is served by the Omak School District, and is home to several churches.
Common Questions
What is Per Capita Income in North Omak?
Per Capita income in North Omak is $35,323.
What is the Median Family Income in North Omak?
Median Family Income in North Omak is $84,048.
What is the Median Household income in North Omak?
Median Household Income in North Omak is $64,408.
What is Income or Wage Gap in North Omak?
Income or Wage Gap in North Omak is 10.9%.
Women in North Omak earn 89.1 cents for every dollar earned by a man.
What is Inequality or Gini Index in North Omak?
Inequality or Gini Index in North Omak is 0.41.
What is the Total Population of North Omak?
Total Population of North Omak is 395.
What is the Total Male Population of North Omak?
Total Male Population of North Omak is 150.
What is the Total Female Population of North Omak?
Total Female Population of North Omak is 245.
What is the Ratio of Males per 100 Females in North Omak?
There are 61.22 Males per 100 Females in North Omak.
What is the Ratio of Females per 100 Males in North Omak?
There are 163.33 Females per 100 Males in North Omak.
What is the Median Population Age in North Omak?
Median Population Age in North Omak is 50.9 Years.
What is the Average Family Size in North Omak
Average Family Size in North Omak is 2.6 People.
What is the Average Household Size in North Omak
Average Household Size in North Omak is 2.3 People.
How Large is the Labor Force in North Omak?
There are 230 People in the Labor Forcein in North Omak.
What is the Percentage of People in the Labor Force in North Omak?
71.9% of People are in the Labor Force in North Omak.
What is the Unemployment Rate in North Omak?
Unemployment Rate in North Omak is 2.2%.