Cities with the Largest Welsh Community in Washington
RELATED REPORTS & OPTIONS
Welsh
Washington
Compare Cities
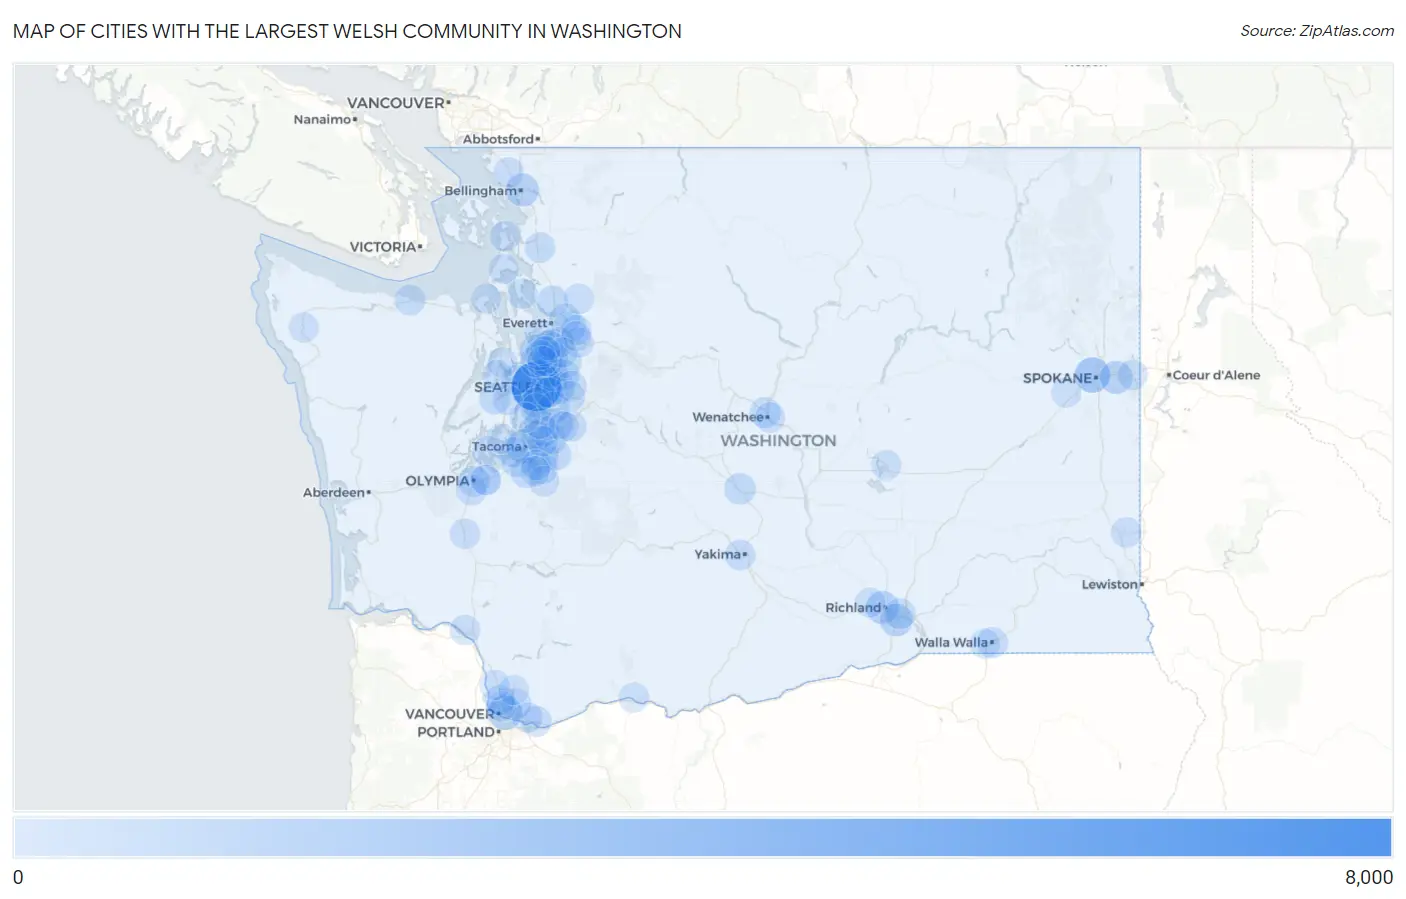
Map of Cities with the Largest Welsh Community in Washington
0
8,000
Cities with the Largest Welsh Community in Washington
| City | Welsh | vs State | vs National | |
| 1. | Seattle | 6,993 | 65,396(10.69%)#1 | 1,736,338(0.40%)#4 |
| 2. | Spokane | 1,899 | 65,396(2.90%)#2 | 1,736,338(0.11%)#52 |
| 3. | Vancouver | 1,613 | 65,396(2.47%)#3 | 1,736,338(0.09%)#67 |
| 4. | Tacoma | 1,448 | 65,396(2.21%)#4 | 1,736,338(0.08%)#85 |
| 5. | Richland | 1,127 | 65,396(1.72%)#5 | 1,736,338(0.06%)#117 |
| 6. | Spokane Valley | 1,068 | 65,396(1.63%)#6 | 1,736,338(0.06%)#131 |
| 7. | Bellingham | 1,065 | 65,396(1.63%)#7 | 1,736,338(0.06%)#133 |
| 8. | Kennewick | 997 | 65,396(1.52%)#8 | 1,736,338(0.06%)#147 |
| 9. | Kirkland | 975 | 65,396(1.49%)#9 | 1,736,338(0.06%)#155 |
| 10. | Shoreline | 835 | 65,396(1.28%)#10 | 1,736,338(0.05%)#195 |
| 11. | Bellevue | 718 | 65,396(1.10%)#11 | 1,736,338(0.04%)#235 |
| 12. | Renton | 704 | 65,396(1.08%)#12 | 1,736,338(0.04%)#242 |
| 13. | Kent | 641 | 65,396(0.98%)#13 | 1,736,338(0.04%)#276 |
| 14. | Everett | 616 | 65,396(0.94%)#14 | 1,736,338(0.04%)#288 |
| 15. | Ellensburg | 595 | 65,396(0.91%)#15 | 1,736,338(0.03%)#303 |
| 16. | Bothell | 574 | 65,396(0.88%)#16 | 1,736,338(0.03%)#318 |
| 17. | Marysville | 545 | 65,396(0.83%)#17 | 1,736,338(0.03%)#350 |
| 18. | Bremerton | 536 | 65,396(0.82%)#18 | 1,736,338(0.03%)#365 |
| 19. | Puyallup | 492 | 65,396(0.75%)#19 | 1,736,338(0.03%)#402 |
| 20. | Olympia | 486 | 65,396(0.74%)#20 | 1,736,338(0.03%)#410 |
| 21. | Burien | 471 | 65,396(0.72%)#21 | 1,736,338(0.03%)#436 |
| 22. | Redmond | 452 | 65,396(0.69%)#22 | 1,736,338(0.03%)#465 |
| 23. | Pasco | 449 | 65,396(0.69%)#23 | 1,736,338(0.03%)#470 |
| 24. | Lakewood | 443 | 65,396(0.68%)#24 | 1,736,338(0.03%)#479 |
| 25. | Auburn | 435 | 65,396(0.67%)#25 | 1,736,338(0.03%)#493 |
| 26. | Spanaway | 430 | 65,396(0.66%)#26 | 1,736,338(0.02%)#499 |
| 27. | Wenatchee | 412 | 65,396(0.63%)#27 | 1,736,338(0.02%)#532 |
| 28. | Federal Way | 410 | 65,396(0.63%)#28 | 1,736,338(0.02%)#536 |
| 29. | Cottage Lake | 396 | 65,396(0.61%)#29 | 1,736,338(0.02%)#564 |
| 30. | Edmonds | 365 | 65,396(0.56%)#30 | 1,736,338(0.02%)#637 |
| 31. | Walla Walla | 353 | 65,396(0.54%)#31 | 1,736,338(0.02%)#664 |
| 32. | Port Angeles | 351 | 65,396(0.54%)#32 | 1,736,338(0.02%)#668 |
| 33. | Lake Stevens | 347 | 65,396(0.53%)#33 | 1,736,338(0.02%)#679 |
| 34. | Lakeland North | 345 | 65,396(0.53%)#34 | 1,736,338(0.02%)#686 |
| 35. | Sammamish | 327 | 65,396(0.50%)#35 | 1,736,338(0.02%)#728 |
| 36. | Kenmore | 323 | 65,396(0.49%)#36 | 1,736,338(0.02%)#741 |
| 37. | Yakima | 320 | 65,396(0.49%)#37 | 1,736,338(0.02%)#746 |
| 38. | Fairwood Cdp Spokane County | 317 | 65,396(0.48%)#38 | 1,736,338(0.02%)#758 |
| 39. | Mount Vernon | 315 | 65,396(0.48%)#39 | 1,736,338(0.02%)#763 |
| 40. | Silver Firs | 306 | 65,396(0.47%)#40 | 1,736,338(0.02%)#791 |
| 41. | Maple Valley | 304 | 65,396(0.46%)#41 | 1,736,338(0.02%)#800 |
| 42. | Washougal | 298 | 65,396(0.46%)#42 | 1,736,338(0.02%)#821 |
| 43. | South Hill | 297 | 65,396(0.45%)#43 | 1,736,338(0.02%)#822 |
| 44. | Bonney Lake | 294 | 65,396(0.45%)#44 | 1,736,338(0.02%)#834 |
| 45. | Tumwater | 285 | 65,396(0.44%)#45 | 1,736,338(0.02%)#863 |
| 46. | East Wenatchee | 283 | 65,396(0.43%)#46 | 1,736,338(0.02%)#872 |
| 47. | Graham | 275 | 65,396(0.42%)#47 | 1,736,338(0.02%)#910 |
| 48. | Lakeland South | 262 | 65,396(0.40%)#48 | 1,736,338(0.02%)#948 |
| 49. | Des Moines | 256 | 65,396(0.39%)#49 | 1,736,338(0.01%)#977 |
| 50. | Orchards | 250 | 65,396(0.38%)#50 | 1,736,338(0.01%)#1,004 |
| 51. | Covington | 237 | 65,396(0.36%)#51 | 1,736,338(0.01%)#1,068 |
| 52. | Lynnwood | 235 | 65,396(0.36%)#52 | 1,736,338(0.01%)#1,080 |
| 53. | Pullman | 233 | 65,396(0.36%)#53 | 1,736,338(0.01%)#1,091 |
| 54. | Longview | 224 | 65,396(0.34%)#54 | 1,736,338(0.01%)#1,145 |
| 55. | University Place | 223 | 65,396(0.34%)#55 | 1,736,338(0.01%)#1,149 |
| 56. | Camas | 223 | 65,396(0.34%)#56 | 1,736,338(0.01%)#1,151 |
| 57. | Summit View | 223 | 65,396(0.34%)#57 | 1,736,338(0.01%)#1,156 |
| 58. | Monroe | 221 | 65,396(0.34%)#58 | 1,736,338(0.01%)#1,170 |
| 59. | White Center | 221 | 65,396(0.34%)#59 | 1,736,338(0.01%)#1,171 |
| 60. | Vashon | 220 | 65,396(0.34%)#60 | 1,736,338(0.01%)#1,178 |
| 61. | Anacortes | 217 | 65,396(0.33%)#61 | 1,736,338(0.01%)#1,196 |
| 62. | Lacey | 207 | 65,396(0.32%)#62 | 1,736,338(0.01%)#1,239 |
| 63. | Salmon Creek | 205 | 65,396(0.31%)#63 | 1,736,338(0.01%)#1,251 |
| 64. | Hazel Dell | 204 | 65,396(0.31%)#64 | 1,736,338(0.01%)#1,263 |
| 65. | Centralia | 203 | 65,396(0.31%)#65 | 1,736,338(0.01%)#1,269 |
| 66. | Liberty Lake | 189 | 65,396(0.29%)#66 | 1,736,338(0.01%)#1,369 |
| 67. | Camano | 184 | 65,396(0.28%)#67 | 1,736,338(0.01%)#1,403 |
| 68. | Mill Creek | 180 | 65,396(0.28%)#68 | 1,736,338(0.01%)#1,438 |
| 69. | Ferndale | 180 | 65,396(0.28%)#69 | 1,736,338(0.01%)#1,441 |
| 70. | Three Lakes | 180 | 65,396(0.28%)#70 | 1,736,338(0.01%)#1,445 |
| 71. | Issaquah | 175 | 65,396(0.27%)#71 | 1,736,338(0.01%)#1,491 |
| 72. | Mill Creek East | 175 | 65,396(0.27%)#72 | 1,736,338(0.01%)#1,496 |
| 73. | Bainbridge Island | 175 | 65,396(0.27%)#73 | 1,736,338(0.01%)#1,497 |
| 74. | Moses Lake | 172 | 65,396(0.26%)#74 | 1,736,338(0.01%)#1,528 |
| 75. | Mukilteo | 170 | 65,396(0.26%)#75 | 1,736,338(0.01%)#1,552 |
| 76. | Medical Lake | 167 | 65,396(0.26%)#76 | 1,736,338(0.01%)#1,584 |
| 77. | Poulsbo | 164 | 65,396(0.25%)#77 | 1,736,338(0.01%)#1,609 |
| 78. | Garrett | 164 | 65,396(0.25%)#78 | 1,736,338(0.01%)#1,613 |
| 79. | Mercer Island | 163 | 65,396(0.25%)#79 | 1,736,338(0.01%)#1,616 |
| 80. | Martha Lake | 162 | 65,396(0.25%)#80 | 1,736,338(0.01%)#1,628 |
| 81. | Parkwood | 161 | 65,396(0.25%)#81 | 1,736,338(0.01%)#1,649 |
| 82. | White Salmon | 161 | 65,396(0.25%)#82 | 1,736,338(0.01%)#1,652 |
| 83. | Maltby | 160 | 65,396(0.24%)#83 | 1,736,338(0.01%)#1,661 |
| 84. | Fairwood Cdp King County | 157 | 65,396(0.24%)#84 | 1,736,338(0.01%)#1,685 |
| 85. | Tanglewilde | 155 | 65,396(0.24%)#85 | 1,736,338(0.01%)#1,717 |
| 86. | Frederickson | 151 | 65,396(0.23%)#86 | 1,736,338(0.01%)#1,768 |
| 87. | Longbranch | 150 | 65,396(0.23%)#87 | 1,736,338(0.01%)#1,791 |
| 88. | Battle Ground | 148 | 65,396(0.23%)#88 | 1,736,338(0.01%)#1,812 |
| 89. | Forks | 146 | 65,396(0.22%)#89 | 1,736,338(0.01%)#1,845 |
| 90. | Canyon Creek | 145 | 65,396(0.22%)#90 | 1,736,338(0.01%)#1,866 |
| 91. | Ridgefield | 143 | 65,396(0.22%)#91 | 1,736,338(0.01%)#1,900 |
| 92. | Silverdale | 140 | 65,396(0.21%)#92 | 1,736,338(0.01%)#1,939 |
| 93. | Port Townsend | 138 | 65,396(0.21%)#93 | 1,736,338(0.01%)#1,971 |
| 94. | Artondale | 137 | 65,396(0.21%)#94 | 1,736,338(0.01%)#1,986 |
| 95. | Mountlake Terrace | 130 | 65,396(0.20%)#95 | 1,736,338(0.01%)#2,064 |
| 96. | West Richland | 129 | 65,396(0.20%)#96 | 1,736,338(0.01%)#2,082 |
| 97. | Alderwood Manor | 127 | 65,396(0.19%)#97 | 1,736,338(0.01%)#2,108 |
| 98. | Lake Forest Park | 126 | 65,396(0.19%)#98 | 1,736,338(0.01%)#2,118 |
| 99. | Chain Lake | 123 | 65,396(0.19%)#99 | 1,736,338(0.01%)#2,170 |
| 100. | Oak Harbor | 121 | 65,396(0.19%)#100 | 1,736,338(0.01%)#2,192 |
Common Questions
What are the Top 10 Cities with the Largest Welsh Community in Washington?
Top 10 Cities with the Largest Welsh Community in Washington are:
#1
6,993
#2
1,899
#3
1,613
#4
1,448
#5
1,127
#6
1,068
#7
1,065
#8
997
#9
975
#10
835
What city has the Largest Welsh Community in Washington?
Seattle has the Largest Welsh Community in Washington with 6,993.
What is the Total Welsh Population in the State of Washington?
Total Welsh Population in Washington is 65,396.
What is the Total Welsh Population in the United States?
Total Welsh Population in the United States is 1,736,338.