Cities with the Highest Percentage of Immigrants from Netherlands in Washington
RELATED REPORTS & OPTIONS
Netherlands
Washington
Compare Cities
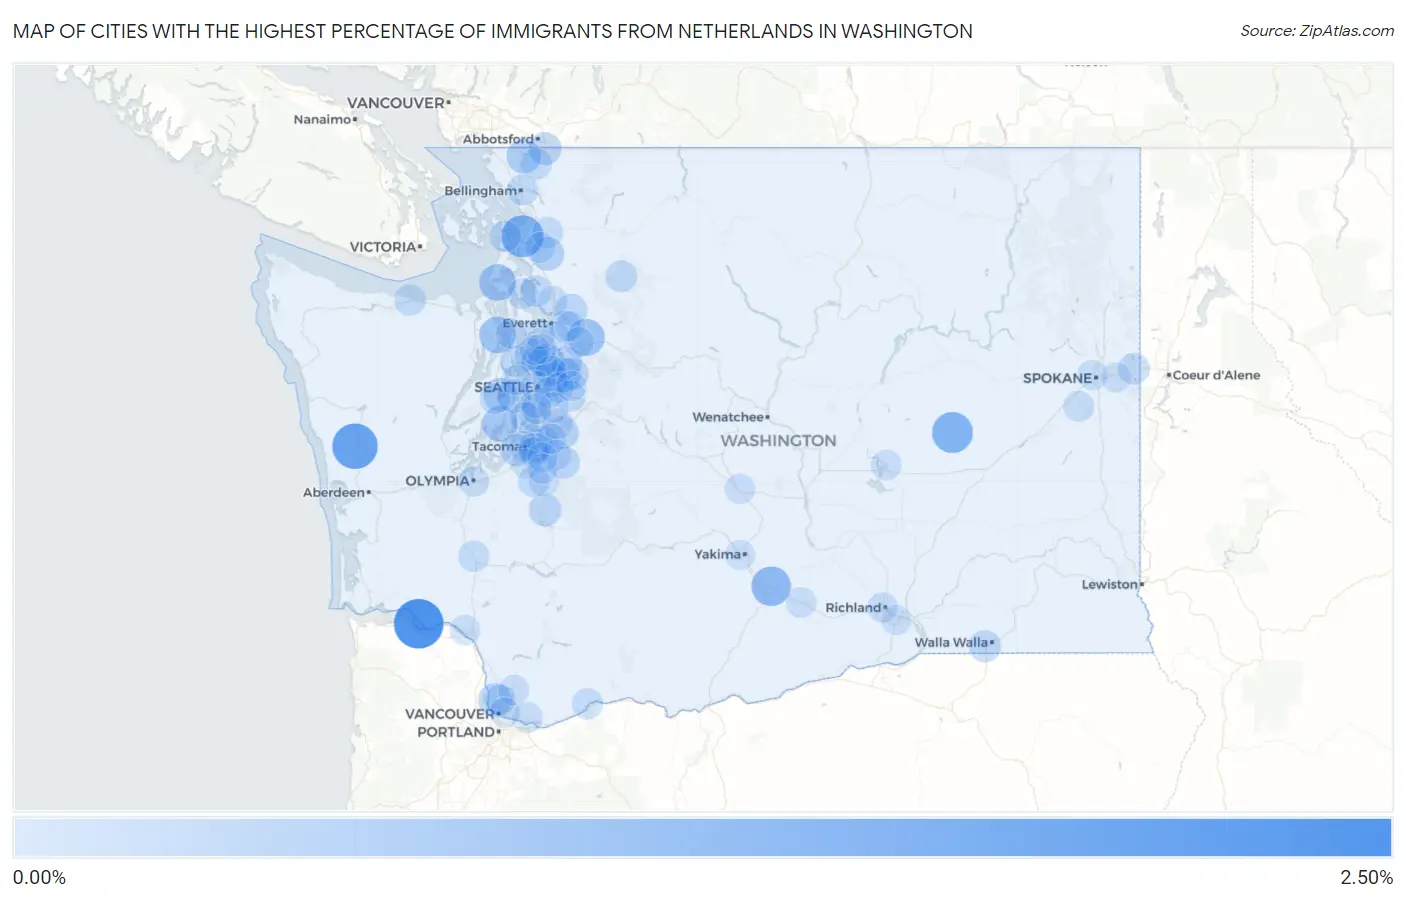
Map of Cities with the Highest Percentage of Immigrants from Netherlands in Washington
0.00%
2.50%
Cities with the Highest Percentage of Immigrants from Netherlands in Washington
| City | Netherlands | vs State | vs National | |
| 1. | Puget Island | 2.08% | 0.044%(+2.04)#1 | 0.025%(+2.06)#34 |
| 2. | Humptulips | 1.63% | 0.044%(+1.59)#2 | 0.025%(+1.61)#48 |
| 3. | Bay View | 1.26% | 0.044%(+1.22)#3 | 0.025%(+1.23)#70 |
| 4. | Odessa | 1.13% | 0.044%(+1.08)#4 | 0.025%(+1.10)#82 |
| 5. | Zillah | 0.98% | 0.044%(+0.939)#5 | 0.025%(+0.958)#102 |
| 6. | Woods Creek | 0.72% | 0.044%(+0.679)#6 | 0.025%(+0.698)#154 |
| 7. | Coupeville | 0.69% | 0.044%(+0.642)#7 | 0.025%(+0.661)#166 |
| 8. | Port Ludlow | 0.68% | 0.044%(+0.634)#8 | 0.025%(+0.653)#171 |
| 9. | Wauna | 0.58% | 0.044%(+0.531)#9 | 0.025%(+0.551)#208 |
| 10. | Yarrow Point | 0.47% | 0.044%(+0.424)#10 | 0.025%(+0.444)#256 |
| 11. | Lynden | 0.46% | 0.044%(+0.414)#11 | 0.025%(+0.433)#262 |
| 12. | Kenmore | 0.44% | 0.044%(+0.396)#12 | 0.025%(+0.415)#270 |
| 13. | Redmond | 0.42% | 0.044%(+0.376)#13 | 0.025%(+0.395)#281 |
| 14. | Roche Harbor | 0.40% | 0.044%(+0.354)#14 | 0.025%(+0.373)#310 |
| 15. | Felida | 0.38% | 0.044%(+0.336)#15 | 0.025%(+0.355)#328 |
| 16. | Clear Lake Cdp Skagit County | 0.36% | 0.044%(+0.312)#16 | 0.025%(+0.332)#348 |
| 17. | Big Lake | 0.35% | 0.044%(+0.308)#17 | 0.025%(+0.328)#358 |
| 18. | Navy Yard City | 0.34% | 0.044%(+0.296)#18 | 0.025%(+0.315)#375 |
| 19. | Manchester | 0.33% | 0.044%(+0.287)#19 | 0.025%(+0.306)#390 |
| 20. | Sumas | 0.29% | 0.044%(+0.242)#20 | 0.025%(+0.261)#462 |
| 21. | Lake Morton Berrydale | 0.28% | 0.044%(+0.233)#21 | 0.025%(+0.252)#483 |
| 22. | Woodway | 0.27% | 0.044%(+0.224)#22 | 0.025%(+0.243)#500 |
| 23. | Union Hill Novelty Hill | 0.27% | 0.044%(+0.223)#23 | 0.025%(+0.242)#503 |
| 24. | Fife Heights | 0.25% | 0.044%(+0.210)#24 | 0.025%(+0.229)#532 |
| 25. | Eatonville | 0.25% | 0.044%(+0.202)#25 | 0.025%(+0.221)#553 |
| 26. | Lochsloy | 0.22% | 0.044%(+0.180)#26 | 0.025%(+0.199)#594 |
| 27. | Fircrest | 0.21% | 0.044%(+0.167)#27 | 0.025%(+0.186)#624 |
| 28. | Prairie Heights | 0.21% | 0.044%(+0.162)#28 | 0.025%(+0.181)#633 |
| 29. | Cottage Lake | 0.20% | 0.044%(+0.158)#29 | 0.025%(+0.177)#639 |
| 30. | College Place | 0.19% | 0.044%(+0.150)#30 | 0.025%(+0.169)#658 |
| 31. | Fife | 0.18% | 0.044%(+0.139)#31 | 0.025%(+0.159)#686 |
| 32. | Normandy Park | 0.18% | 0.044%(+0.135)#32 | 0.025%(+0.154)#696 |
| 33. | Indianola | 0.17% | 0.044%(+0.124)#33 | 0.025%(+0.144)#733 |
| 34. | Darrington | 0.16% | 0.044%(+0.118)#34 | 0.025%(+0.137)#754 |
| 35. | Warm Beach | 0.16% | 0.044%(+0.114)#35 | 0.025%(+0.133)#762 |
| 36. | Otis Orchards East Farms | 0.16% | 0.044%(+0.114)#36 | 0.025%(+0.133)#766 |
| 37. | Anacortes | 0.15% | 0.044%(+0.108)#37 | 0.025%(+0.128)#790 |
| 38. | Port Angeles | 0.15% | 0.044%(+0.106)#38 | 0.025%(+0.125)#803 |
| 39. | Elk Plain | 0.14% | 0.044%(+0.096)#39 | 0.025%(+0.115)#840 |
| 40. | Bunk Foss | 0.14% | 0.044%(+0.093)#40 | 0.025%(+0.112)#853 |
| 41. | Everson | 0.14% | 0.044%(+0.091)#41 | 0.025%(+0.110)#862 |
| 42. | Sedro Woolley | 0.12% | 0.044%(+0.076)#42 | 0.025%(+0.095)#931 |
| 43. | Issaquah | 0.12% | 0.044%(+0.075)#43 | 0.025%(+0.094)#938 |
| 44. | Stevenson | 0.12% | 0.044%(+0.073)#44 | 0.025%(+0.093)#948 |
| 45. | Napavine | 0.12% | 0.044%(+0.073)#45 | 0.025%(+0.093)#950 |
| 46. | Bellingham | 0.11% | 0.044%(+0.062)#46 | 0.025%(+0.081)#1,006 |
| 47. | White Center | 0.10% | 0.044%(+0.059)#47 | 0.025%(+0.078)#1,025 |
| 48. | Lakeland South | 0.10% | 0.044%(+0.059)#48 | 0.025%(+0.078)#1,028 |
| 49. | Vashon | 0.091% | 0.044%(+0.047)#49 | 0.025%(+0.066)#1,088 |
| 50. | Camano | 0.085% | 0.044%(+0.041)#50 | 0.025%(+0.060)#1,129 |
| 51. | Cheney | 0.078% | 0.044%(+0.033)#51 | 0.025%(+0.053)#1,183 |
| 52. | Salmon Creek | 0.074% | 0.044%(+0.029)#52 | 0.025%(+0.049)#1,219 |
| 53. | Bremerton | 0.070% | 0.044%(+0.026)#53 | 0.025%(+0.045)#1,245 |
| 54. | Shoreline | 0.070% | 0.044%(+0.025)#54 | 0.025%(+0.045)#1,253 |
| 55. | Kirkland | 0.068% | 0.044%(+0.024)#55 | 0.025%(+0.043)#1,264 |
| 56. | Tacoma | 0.064% | 0.044%(+0.020)#56 | 0.025%(+0.039)#1,305 |
| 57. | Bonney Lake | 0.062% | 0.044%(+0.018)#57 | 0.025%(+0.037)#1,332 |
| 58. | Seattle | 0.062% | 0.044%(+0.018)#58 | 0.025%(+0.037)#1,333 |
| 59. | Camas | 0.061% | 0.044%(+0.016)#59 | 0.025%(+0.036)#1,346 |
| 60. | Lake Forest Park | 0.059% | 0.044%(+0.015)#60 | 0.025%(+0.034)#1,356 |
| 61. | Mount Vernon | 0.057% | 0.044%(+0.013)#61 | 0.025%(+0.032)#1,376 |
| 62. | Mukilteo | 0.056% | 0.044%(+0.012)#62 | 0.025%(+0.031)#1,381 |
| 63. | Olympia | 0.054% | 0.044%(+0.010)#63 | 0.025%(+0.029)#1,396 |
| 64. | Moses Lake | 0.052% | 0.044%(+0.007)#64 | 0.025%(+0.027)#1,418 |
| 65. | Bainbridge Island | 0.049% | 0.044%(+0.004)#65 | 0.025%(+0.023)#1,451 |
| 66. | Battle Ground | 0.048% | 0.044%(+0.003)#66 | 0.025%(+0.023)#1,461 |
| 67. | Eastmont | 0.047% | 0.044%(+0.003)#67 | 0.025%(+0.022)#1,467 |
| 68. | Longview | 0.045% | 0.044%(+0.001)#68 | 0.025%(+0.020)#1,494 |
| 69. | Sunnyside | 0.043% | 0.044%(-0.002)#69 | 0.025%(+0.018)#1,514 |
| 70. | Lynnwood | 0.043% | 0.044%(-0.002)#70 | 0.025%(+0.018)#1,524 |
| 71. | Bellevue | 0.040% | 0.044%(-0.005)#71 | 0.025%(+0.015)#1,571 |
| 72. | Mercer Island | 0.039% | 0.044%(-0.005)#72 | 0.025%(+0.014)#1,574 |
| 73. | Waller | 0.038% | 0.044%(-0.007)#73 | 0.025%(+0.012)#1,600 |
| 74. | Graham | 0.037% | 0.044%(-0.007)#74 | 0.025%(+0.012)#1,604 |
| 75. | Renton | 0.036% | 0.044%(-0.008)#75 | 0.025%(+0.011)#1,623 |
| 76. | Kent | 0.035% | 0.044%(-0.010)#76 | 0.025%(+0.010)#1,645 |
| 77. | Sammamish | 0.032% | 0.044%(-0.013)#77 | 0.025%(+0.006)#1,704 |
| 78. | Hansville | 0.031% | 0.044%(-0.014)#78 | 0.025%(+0.006)#1,708 |
| 79. | Monroe | 0.031% | 0.044%(-0.014)#79 | 0.025%(+0.005)#1,710 |
| 80. | Burien | 0.029% | 0.044%(-0.015)#80 | 0.025%(+0.004)#1,727 |
| 81. | Marysville | 0.028% | 0.044%(-0.016)#81 | 0.025%(+0.003)#1,741 |
| 82. | Richland | 0.025% | 0.044%(-0.020)#82 | 0.025%(-0.000)#1,802 |
| 83. | Ellensburg | 0.021% | 0.044%(-0.023)#83 | 0.025%(-0.004)#1,855 |
| 84. | Auburn | 0.021% | 0.044%(-0.023)#84 | 0.025%(-0.004)#1,857 |
| 85. | Spokane | 0.021% | 0.044%(-0.024)#85 | 0.025%(-0.005)#1,865 |
| 86. | Parkland | 0.015% | 0.044%(-0.029)#86 | 0.025%(-0.010)#1,957 |
| 87. | Puyallup | 0.014% | 0.044%(-0.030)#87 | 0.025%(-0.011)#1,977 |
| 88. | South Hill | 0.012% | 0.044%(-0.033)#88 | 0.025%(-0.013)#2,023 |
| 89. | Vancouver | 0.011% | 0.044%(-0.033)#89 | 0.025%(-0.014)#2,038 |
| 90. | Everett | 0.011% | 0.044%(-0.034)#90 | 0.025%(-0.014)#2,041 |
| 91. | Yakima | 0.010% | 0.044%(-0.034)#91 | 0.025%(-0.015)#2,049 |
| 92. | Kennewick | 0.0095% | 0.044%(-0.035)#92 | 0.025%(-0.016)#2,067 |
| 93. | Spokane Valley | 0.0087% | 0.044%(-0.036)#93 | 0.025%(-0.016)#2,082 |
| 94. | Edmonds | 0.0070% | 0.044%(-0.037)#94 | 0.025%(-0.018)#2,109 |
Common Questions
What are the Top 10 Cities with the Highest Percentage of Immigrants from Netherlands in Washington?
Top 10 Cities with the Highest Percentage of Immigrants from Netherlands in Washington are:
#1
2.08%
#2
1.63%
#3
1.26%
#4
1.13%
#5
0.98%
#6
0.72%
#7
0.69%
#8
0.68%
#9
0.58%
#10
0.47%
What city has the Highest Percentage of Immigrants from Netherlands in Washington?
Puget Island has the Highest Percentage of Immigrants from Netherlands in Washington with 2.08%.
What is the Percentage of Immigrants from Netherlands in the State of Washington?
Percentage of Immigrants from Netherlands in Washington is 0.044%.
What is the Percentage of Immigrants from Netherlands in the United States?
Percentage of Immigrants from Netherlands in the United States is 0.025%.