Cities with the Highest Percentage of Population Employed in Health Care & Social Assistance in Washington
RELATED REPORTS & OPTIONS
Health Care & Social Assistance
Washington
Compare Cities
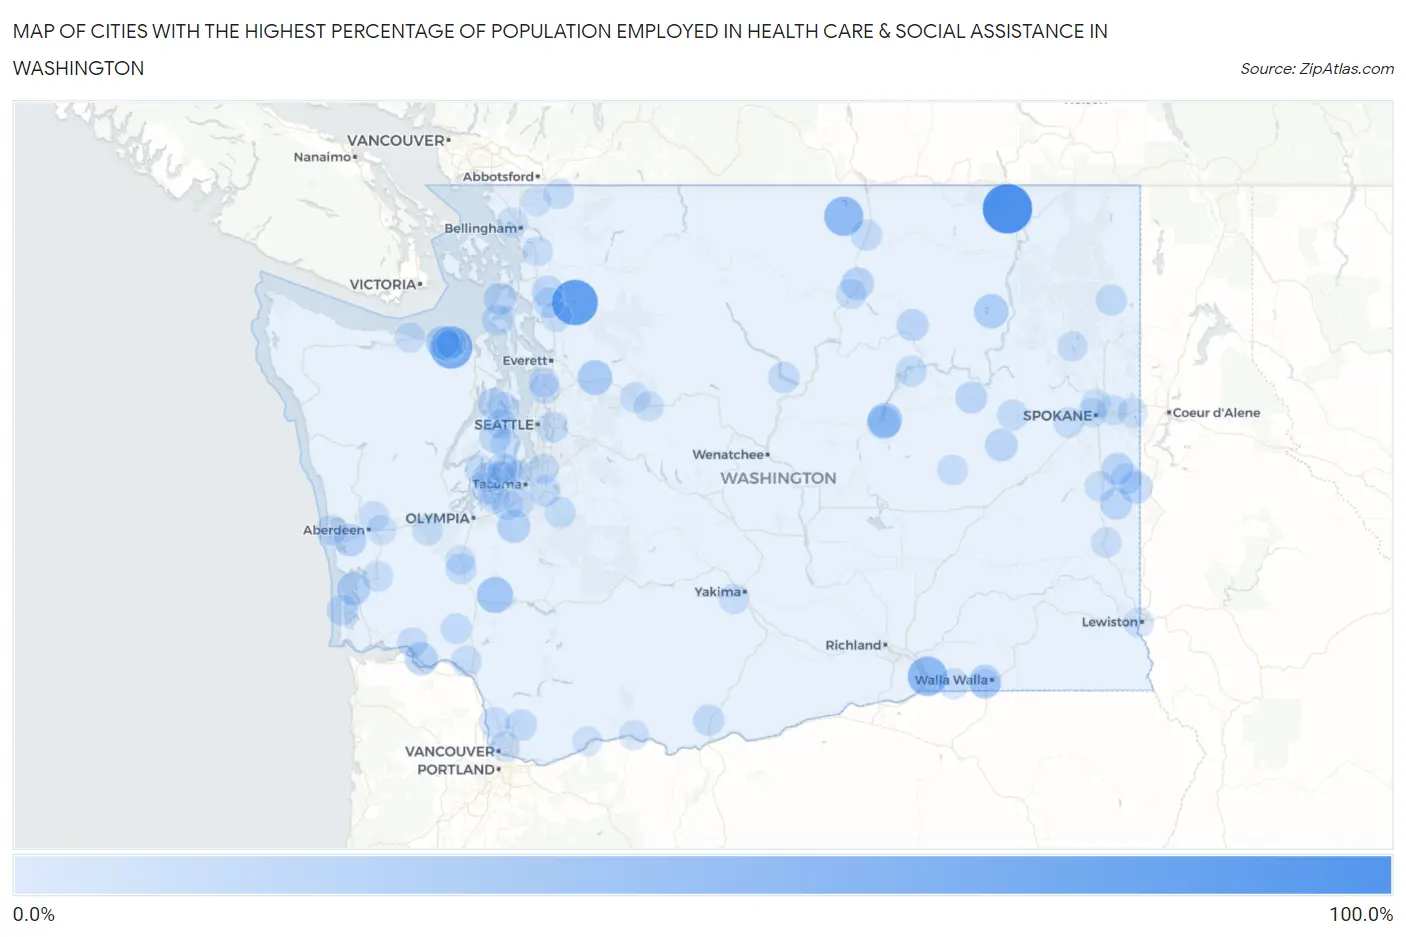
Map of Cities with the Highest Percentage of Population Employed in Health Care & Social Assistance in Washington
0.0%
100.0%
Cities with the Highest Percentage of Population Employed in Health Care & Social Assistance in Washington
| City | % Employed | vs State | vs National | |
| 1. | Orient | 100.0% | 13.0%(+87.0)#1 | 13.9%(+86.1)#37 |
| 2. | Lake Cavanaugh | 83.3% | 13.0%(+70.3)#2 | 13.9%(+69.4)#86 |
| 3. | Bell Hill | 69.0% | 13.0%(+56.0)#3 | 13.9%(+55.1)#124 |
| 4. | Wallula | 56.5% | 13.0%(+43.5)#4 | 13.9%(+42.6)#219 |
| 5. | Loomis | 55.6% | 13.0%(+42.5)#5 | 13.9%(+41.6)#232 |
| 6. | Onalaska | 42.7% | 13.0%(+29.6)#6 | 13.9%(+28.7)#509 |
| 7. | North Sultan | 36.9% | 13.0%(+23.9)#7 | 13.9%(+23.0)#740 |
| 8. | Banks Lake South | 36.0% | 13.0%(+23.0)#8 | 13.9%(+22.1)#800 |
| 9. | Twin Lakes | 35.3% | 13.0%(+22.3)#9 | 13.9%(+21.4)#857 |
| 10. | Coulee City | 32.1% | 13.0%(+19.0)#10 | 13.9%(+18.1)#1,185 |
| 11. | Carlsborg | 31.5% | 13.0%(+18.4)#11 | 13.9%(+17.5)#1,268 |
| 12. | Roy | 30.9% | 13.0%(+17.9)#12 | 13.9%(+17.0)#1,338 |
| 13. | Bay Center | 30.4% | 13.0%(+17.4)#13 | 13.9%(+16.5)#1,401 |
| 14. | East Cathlamet | 30.3% | 13.0%(+17.3)#14 | 13.9%(+16.4)#1,411 |
| 15. | Garrett | 29.6% | 13.0%(+16.6)#15 | 13.9%(+15.7)#1,532 |
| 16. | Markham | 29.3% | 13.0%(+16.2)#16 | 13.9%(+15.3)#1,590 |
| 17. | Omak | 29.0% | 13.0%(+16.0)#17 | 13.9%(+15.1)#1,631 |
| 18. | Whidbey Island Station | 28.4% | 13.0%(+15.3)#18 | 13.9%(+14.4)#1,770 |
| 19. | Harrington | 28.3% | 13.0%(+15.3)#19 | 13.9%(+14.4)#1,788 |
| 20. | Tekoa | 27.2% | 13.0%(+14.2)#20 | 13.9%(+13.3)#1,994 |
| 21. | Beverly | 26.5% | 13.0%(+13.4)#21 | 13.9%(+12.6)#2,174 |
| 22. | Nespelem Community | 26.4% | 13.0%(+13.3)#22 | 13.9%(+12.4)#2,207 |
| 23. | Waverly | 25.8% | 13.0%(+12.8)#23 | 13.9%(+11.9)#2,343 |
| 24. | Creston | 25.7% | 13.0%(+12.6)#24 | 13.9%(+11.7)#2,394 |
| 25. | Oakesdale | 25.6% | 13.0%(+12.6)#25 | 13.9%(+11.7)#2,403 |
| 26. | Gorst | 25.3% | 13.0%(+12.3)#26 | 13.9%(+11.4)#2,489 |
| 27. | Big Lake | 24.8% | 13.0%(+11.8)#27 | 13.9%(+10.9)#2,707 |
| 28. | Bangor Base | 24.6% | 13.0%(+11.5)#28 | 13.9%(+10.6)#2,779 |
| 29. | Cusick | 23.6% | 13.0%(+10.6)#29 | 13.9%(+9.70)#3,132 |
| 30. | Goldendale | 23.6% | 13.0%(+10.6)#30 | 13.9%(+9.68)#3,143 |
| 31. | Manson | 23.4% | 13.0%(+10.4)#31 | 13.9%(+9.49)#3,241 |
| 32. | Venersborg | 23.4% | 13.0%(+10.4)#32 | 13.9%(+9.49)#3,245 |
| 33. | Latah | 23.4% | 13.0%(+10.4)#33 | 13.9%(+9.47)#3,258 |
| 34. | Ocean Park | 23.3% | 13.0%(+10.2)#34 | 13.9%(+9.32)#3,313 |
| 35. | Coupeville | 23.1% | 13.0%(+10.0)#35 | 13.9%(+9.14)#3,396 |
| 36. | Tonasket | 22.8% | 13.0%(+9.78)#36 | 13.9%(+8.88)#3,532 |
| 37. | Crocker | 22.8% | 13.0%(+9.73)#37 | 13.9%(+8.83)#3,560 |
| 38. | Sunland Estates | 22.7% | 13.0%(+9.69)#38 | 13.9%(+8.79)#3,585 |
| 39. | North Puyallup | 22.5% | 13.0%(+9.41)#39 | 13.9%(+8.52)#3,695 |
| 40. | Electric City | 22.4% | 13.0%(+9.37)#40 | 13.9%(+8.47)#3,722 |
| 41. | Touchet | 22.4% | 13.0%(+9.33)#41 | 13.9%(+8.43)#3,739 |
| 42. | Davenport | 22.1% | 13.0%(+9.05)#42 | 13.9%(+8.15)#3,885 |
| 43. | Ryderwood | 22.0% | 13.0%(+9.00)#43 | 13.9%(+8.10)#3,919 |
| 44. | Bryant | 21.7% | 13.0%(+8.67)#44 | 13.9%(+7.77)#4,127 |
| 45. | Beacon Hill | 21.6% | 13.0%(+8.58)#45 | 13.9%(+7.68)#4,189 |
| 46. | Longbranch | 21.6% | 13.0%(+8.57)#46 | 13.9%(+7.67)#4,192 |
| 47. | Fords Prairie | 21.6% | 13.0%(+8.55)#47 | 13.9%(+7.66)#4,202 |
| 48. | Lake Mcmurray | 21.6% | 13.0%(+8.55)#48 | 13.9%(+7.66)#4,203 |
| 49. | Ridgefield | 21.5% | 13.0%(+8.42)#49 | 13.9%(+7.52)#4,280 |
| 50. | Odessa | 21.2% | 13.0%(+8.20)#50 | 13.9%(+7.31)#4,425 |
| 51. | Keyport | 21.2% | 13.0%(+8.13)#51 | 13.9%(+7.23)#4,498 |
| 52. | North Fort Lewis | 21.1% | 13.0%(+8.09)#52 | 13.9%(+7.19)#4,521 |
| 53. | Raymond | 21.0% | 13.0%(+7.96)#53 | 13.9%(+7.06)#4,622 |
| 54. | Alderwood Manor | 21.0% | 13.0%(+7.96)#54 | 13.9%(+7.06)#4,627 |
| 55. | Fairchild Afb | 20.9% | 13.0%(+7.90)#55 | 13.9%(+7.00)#4,675 |
| 56. | Grapeview | 20.9% | 13.0%(+7.87)#56 | 13.9%(+6.97)#4,698 |
| 57. | Gig Harbor | 20.9% | 13.0%(+7.87)#57 | 13.9%(+6.97)#4,702 |
| 58. | Peaceful Valley | 20.7% | 13.0%(+7.66)#58 | 13.9%(+6.77)#4,847 |
| 59. | Longview Heights | 20.6% | 13.0%(+7.60)#59 | 13.9%(+6.70)#4,909 |
| 60. | Rosalia | 20.6% | 13.0%(+7.56)#60 | 13.9%(+6.66)#4,940 |
| 61. | College Place | 20.6% | 13.0%(+7.55)#61 | 13.9%(+6.66)#4,944 |
| 62. | Skamokawa Valley | 20.6% | 13.0%(+7.55)#62 | 13.9%(+6.65)#4,950 |
| 63. | Ocean Shores | 20.4% | 13.0%(+7.38)#63 | 13.9%(+6.49)#5,078 |
| 64. | Okanogan | 20.4% | 13.0%(+7.37)#64 | 13.9%(+6.47)#5,084 |
| 65. | Millwood | 20.3% | 13.0%(+7.30)#65 | 13.9%(+6.41)#5,135 |
| 66. | Lakeland North | 20.3% | 13.0%(+7.28)#66 | 13.9%(+6.39)#5,163 |
| 67. | Beaux Arts Village | 20.3% | 13.0%(+7.25)#67 | 13.9%(+6.35)#5,183 |
| 68. | Malone | 20.3% | 13.0%(+7.23)#68 | 13.9%(+6.33)#5,199 |
| 69. | Ahtanum | 20.3% | 13.0%(+7.23)#69 | 13.9%(+6.33)#5,202 |
| 70. | Tracyton | 20.2% | 13.0%(+7.17)#70 | 13.9%(+6.28)#5,245 |
| 71. | Marietta Alderwood | 20.1% | 13.0%(+7.10)#71 | 13.9%(+6.20)#5,311 |
| 72. | Ruston | 20.1% | 13.0%(+7.05)#72 | 13.9%(+6.15)#5,353 |
| 73. | Baring | 20.0% | 13.0%(+6.96)#73 | 13.9%(+6.06)#5,427 |
| 74. | Pataha | 20.0% | 13.0%(+6.96)#74 | 13.9%(+6.06)#5,446 |
| 75. | North Lynnwood | 20.0% | 13.0%(+6.94)#75 | 13.9%(+6.04)#5,472 |
| 76. | Colfax | 20.0% | 13.0%(+6.92)#76 | 13.9%(+6.02)#5,490 |
| 77. | River Road | 19.9% | 13.0%(+6.82)#77 | 13.9%(+5.92)#5,572 |
| 78. | Clarkston | 19.8% | 13.0%(+6.76)#78 | 13.9%(+5.86)#5,617 |
| 79. | Mcchord Afb | 19.7% | 13.0%(+6.70)#79 | 13.9%(+5.80)#5,665 |
| 80. | Loon Lake | 19.6% | 13.0%(+6.57)#80 | 13.9%(+5.67)#5,781 |
| 81. | Aberdeen Gardens | 19.6% | 13.0%(+6.57)#81 | 13.9%(+5.67)#5,783 |
| 82. | Minnehaha | 19.3% | 13.0%(+6.27)#82 | 13.9%(+5.38)#6,043 |
| 83. | Home | 19.2% | 13.0%(+6.13)#83 | 13.9%(+5.23)#6,174 |
| 84. | Artondale | 19.1% | 13.0%(+6.05)#84 | 13.9%(+5.15)#6,257 |
| 85. | Alger | 18.9% | 13.0%(+5.86)#85 | 13.9%(+4.97)#6,452 |
| 86. | Port Angeles | 18.9% | 13.0%(+5.85)#86 | 13.9%(+4.95)#6,469 |
| 87. | Liberty Lake | 18.9% | 13.0%(+5.83)#87 | 13.9%(+4.93)#6,483 |
| 88. | Skykomish | 18.8% | 13.0%(+5.71)#88 | 13.9%(+4.81)#6,597 |
| 89. | Town And Country | 18.7% | 13.0%(+5.71)#89 | 13.9%(+4.81)#6,604 |
| 90. | Suncrest | 18.6% | 13.0%(+5.59)#90 | 13.9%(+4.70)#6,722 |
| 91. | Grand Mound | 18.6% | 13.0%(+5.53)#91 | 13.9%(+4.63)#6,795 |
| 92. | Central Park | 18.5% | 13.0%(+5.49)#92 | 13.9%(+4.59)#6,834 |
| 93. | Stevenson | 18.5% | 13.0%(+5.43)#93 | 13.9%(+4.54)#6,893 |
| 94. | Spokane | 18.3% | 13.0%(+5.31)#94 | 13.9%(+4.41)#7,022 |
| 95. | Everson | 18.3% | 13.0%(+5.30)#95 | 13.9%(+4.40)#7,032 |
| 96. | Anderson Island | 18.3% | 13.0%(+5.22)#96 | 13.9%(+4.33)#7,115 |
| 97. | Bethel | 18.2% | 13.0%(+5.20)#97 | 13.9%(+4.30)#7,142 |
| 98. | Sequim | 18.2% | 13.0%(+5.19)#98 | 13.9%(+4.29)#7,151 |
| 99. | White Salmon | 18.2% | 13.0%(+5.13)#99 | 13.9%(+4.23)#7,249 |
| 100. | Rosedale | 18.1% | 13.0%(+5.08)#100 | 13.9%(+4.18)#7,305 |
Common Questions
What are the Top 10 Cities with the Highest Percentage of Population Employed in Health Care & Social Assistance in Washington?
Top 10 Cities with the Highest Percentage of Population Employed in Health Care & Social Assistance in Washington are:
#1
100.0%
#2
83.3%
#3
69.0%
#4
56.5%
#5
55.6%
#6
42.7%
#7
36.9%
#8
36.0%
#9
35.3%
#10
32.1%
What city has the Highest Percentage of Population Employed in Health Care & Social Assistance in Washington?
Orient has the Highest Percentage of Population Employed in Health Care & Social Assistance in Washington with 100.0%.
What is the Percentage of Population Employed in Health Care & Social Assistance in the State of Washington?
Percentage of Population Employed in Health Care & Social Assistance in Washington is 13.0%.
What is the Percentage of Population Employed in Health Care & Social Assistance in the United States?
Percentage of Population Employed in Health Care & Social Assistance in the United States is 13.9%.