Cities with the Highest Percentage of Households Heated by Bottled Gas / Liquid Propane in Washington
RELATED REPORTS & OPTIONS
Bottled Gas / LP Heating
Washington
Compare Cities
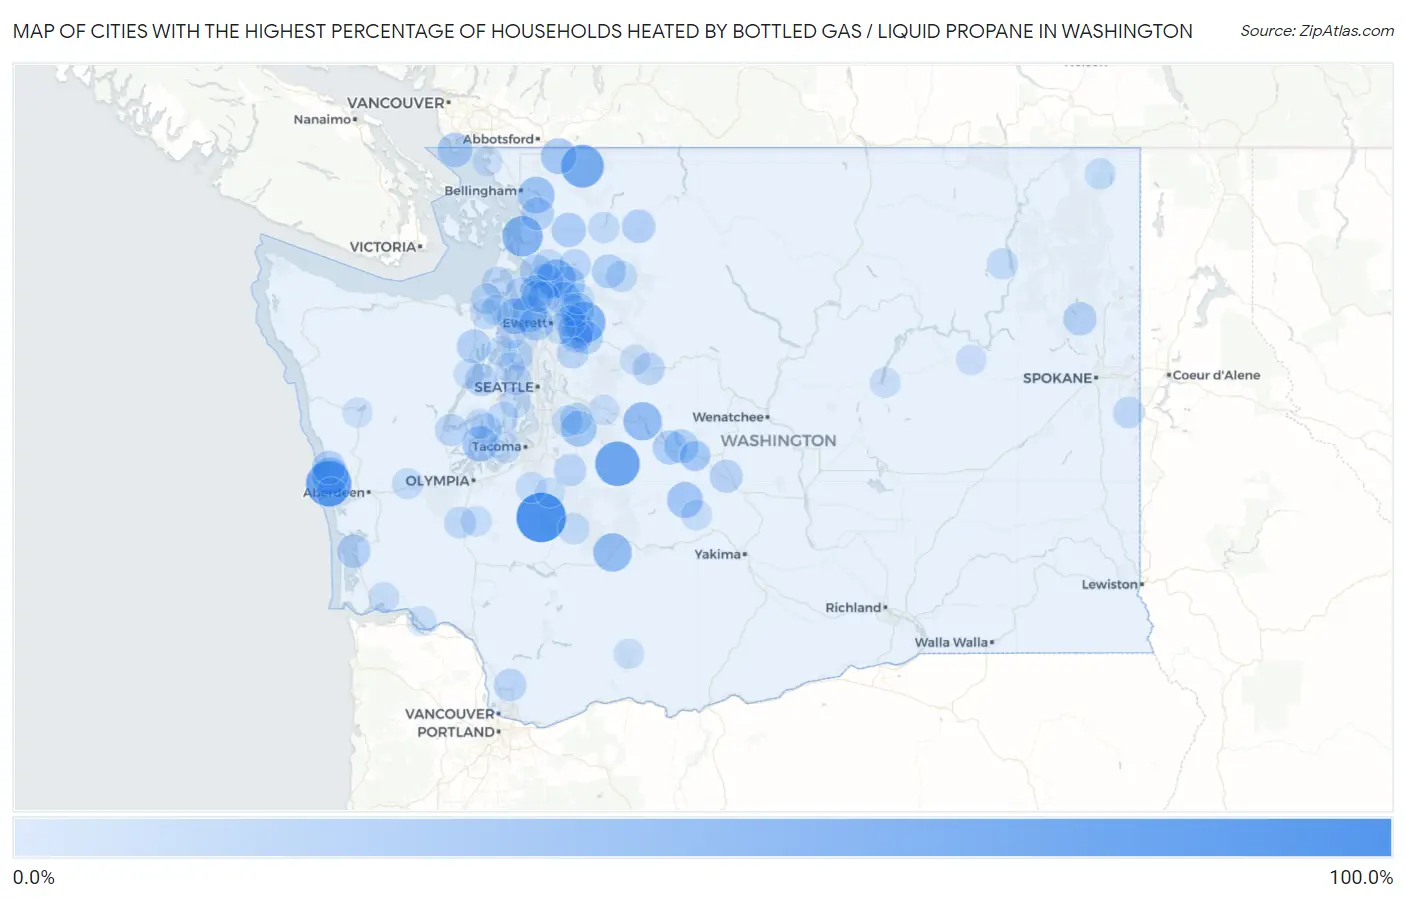
Map of Cities with the Highest Percentage of Households Heated by Bottled Gas / Liquid Propane in Washington
0.0%
100.0%
Cities with the Highest Percentage of Households Heated by Bottled Gas / Liquid Propane in Washington
| City | Bottled Gas / LP Heating | vs State | vs National | |
| 1. | La Grande | 89.1% | 3.1%(+86.0)#1 | 4.9%(+84.2)#420 |
| 2. | Oyehut | 72.0% | 3.1%(+68.9)#2 | 4.9%(+67.1)#1,029 |
| 3. | Greenwater | 68.3% | 3.1%(+65.2)#3 | 4.9%(+63.4)#1,220 |
| 4. | Glacier | 61.0% | 3.1%(+57.9)#4 | 4.9%(+56.1)#1,628 |
| 5. | Lake Roesiger | 53.6% | 3.1%(+50.5)#5 | 4.9%(+48.7)#2,147 |
| 6. | Bay View | 51.7% | 3.1%(+48.6)#6 | 4.9%(+46.8)#2,283 |
| 7. | Bryant | 43.8% | 3.1%(+40.7)#7 | 4.9%(+38.9)#2,904 |
| 8. | Packwood | 43.7% | 3.1%(+40.6)#8 | 4.9%(+38.8)#2,922 |
| 9. | Snoqualmie Pass | 42.9% | 3.1%(+39.8)#9 | 4.9%(+38.0)#2,986 |
| 10. | Ocean City | 38.6% | 3.1%(+35.5)#10 | 4.9%(+33.7)#3,358 |
| 11. | Langley | 38.2% | 3.1%(+35.1)#11 | 4.9%(+33.3)#3,389 |
| 12. | Sudden Valley | 36.2% | 3.1%(+33.1)#12 | 4.9%(+31.3)#3,574 |
| 13. | Three Lakes | 35.0% | 3.1%(+31.9)#13 | 4.9%(+30.1)#3,683 |
| 14. | Cliffdell | 33.3% | 3.1%(+30.2)#14 | 4.9%(+28.4)#3,854 |
| 15. | Peaceful Valley | 33.0% | 3.1%(+29.9)#15 | 4.9%(+28.1)#3,888 |
| 16. | Freeland | 32.3% | 3.1%(+29.2)#16 | 4.9%(+27.4)#3,961 |
| 17. | Ravensdale | 32.2% | 3.1%(+29.1)#17 | 4.9%(+27.3)#3,983 |
| 18. | Herron Island | 31.3% | 3.1%(+28.2)#18 | 4.9%(+26.4)#4,077 |
| 19. | Arlington Heights | 29.2% | 3.1%(+26.1)#19 | 4.9%(+24.3)#4,322 |
| 20. | Point Roberts | 28.4% | 3.1%(+25.3)#20 | 4.9%(+23.5)#4,432 |
| 21. | Sunday Lake | 28.1% | 3.1%(+25.0)#21 | 4.9%(+23.2)#4,463 |
| 22. | Lyman | 27.1% | 3.1%(+24.0)#22 | 4.9%(+22.2)#4,594 |
| 23. | Sisco Heights | 26.5% | 3.1%(+23.4)#23 | 4.9%(+21.6)#4,676 |
| 24. | Easton | 26.3% | 3.1%(+23.2)#24 | 4.9%(+21.4)#4,708 |
| 25. | Lake Bosworth | 25.8% | 3.1%(+22.7)#25 | 4.9%(+20.9)#4,777 |
| 26. | Roslyn | 25.4% | 3.1%(+22.3)#26 | 4.9%(+20.5)#4,840 |
| 27. | Clinton | 25.2% | 3.1%(+22.1)#27 | 4.9%(+20.3)#4,862 |
| 28. | Swede Heaven | 24.9% | 3.1%(+21.8)#28 | 4.9%(+20.0)#4,933 |
| 29. | Quilcene | 24.2% | 3.1%(+21.1)#29 | 4.9%(+19.3)#5,025 |
| 30. | Camano | 23.7% | 3.1%(+20.6)#30 | 4.9%(+18.8)#5,089 |
| 31. | Copalis Beach | 23.7% | 3.1%(+20.6)#31 | 4.9%(+18.8)#5,102 |
| 32. | Marblemount | 23.4% | 3.1%(+20.3)#32 | 4.9%(+18.5)#5,137 |
| 33. | Clayton | 23.1% | 3.1%(+20.0)#33 | 4.9%(+18.2)#5,183 |
| 34. | Lake Ketchum | 22.9% | 3.1%(+19.8)#34 | 4.9%(+18.0)#5,208 |
| 35. | Bay Center | 22.9% | 3.1%(+19.8)#35 | 4.9%(+18.0)#5,221 |
| 36. | Thorp | 22.0% | 3.1%(+18.9)#36 | 4.9%(+17.1)#5,360 |
| 37. | Woods Creek | 21.8% | 3.1%(+18.7)#37 | 4.9%(+16.9)#5,372 |
| 38. | Alger | 21.6% | 3.1%(+18.5)#38 | 4.9%(+16.7)#5,427 |
| 39. | Roche Harbor | 20.7% | 3.1%(+17.6)#39 | 4.9%(+15.8)#5,556 |
| 40. | Chain Lake | 20.6% | 3.1%(+17.5)#40 | 4.9%(+15.7)#5,565 |
| 41. | Seabeck | 20.5% | 3.1%(+17.4)#41 | 4.9%(+15.6)#5,593 |
| 42. | Cherry Grove | 20.1% | 3.1%(+17.0)#42 | 4.9%(+15.2)#5,669 |
| 43. | Warm Beach | 19.8% | 3.1%(+16.7)#43 | 4.9%(+14.9)#5,729 |
| 44. | Lochsloy | 19.8% | 3.1%(+16.7)#44 | 4.9%(+14.9)#5,731 |
| 45. | Union | 19.0% | 3.1%(+15.9)#45 | 4.9%(+14.1)#5,856 |
| 46. | Skykomish | 19.0% | 3.1%(+15.9)#46 | 4.9%(+14.1)#5,864 |
| 47. | Wilkeson | 18.9% | 3.1%(+15.8)#47 | 4.9%(+14.0)#5,878 |
| 48. | Clear Lake Cdp Skagit County | 18.8% | 3.1%(+15.7)#48 | 4.9%(+13.9)#5,892 |
| 49. | High Bridge | 18.1% | 3.1%(+15.0)#49 | 4.9%(+13.2)#6,047 |
| 50. | Lake Goodwin | 17.9% | 3.1%(+14.8)#50 | 4.9%(+13.0)#6,082 |
| 51. | Kayak Point | 17.8% | 3.1%(+14.7)#51 | 4.9%(+12.9)#6,116 |
| 52. | Lake Cavanaugh | 17.7% | 3.1%(+14.6)#52 | 4.9%(+12.8)#6,147 |
| 53. | Hobart | 17.6% | 3.1%(+14.5)#53 | 4.9%(+12.7)#6,155 |
| 54. | Machias | 17.4% | 3.1%(+14.3)#54 | 4.9%(+12.5)#6,221 |
| 55. | Ocosta | 17.4% | 3.1%(+14.3)#55 | 4.9%(+12.5)#6,237 |
| 56. | Grand Mound | 17.1% | 3.1%(+14.0)#56 | 4.9%(+12.2)#6,286 |
| 57. | Rockford | 16.5% | 3.1%(+13.4)#57 | 4.9%(+11.6)#6,429 |
| 58. | Coupeville | 16.3% | 3.1%(+13.2)#58 | 4.9%(+11.4)#6,461 |
| 59. | Shadow Lake | 15.9% | 3.1%(+12.8)#59 | 4.9%(+11.0)#6,551 |
| 60. | Lake Mcmurray | 15.9% | 3.1%(+12.8)#60 | 4.9%(+11.0)#6,560 |
| 61. | Burley | 15.7% | 3.1%(+12.6)#61 | 4.9%(+10.8)#6,592 |
| 62. | Concrete | 15.7% | 3.1%(+12.6)#62 | 4.9%(+10.8)#6,595 |
| 63. | Ashford | 15.7% | 3.1%(+12.6)#63 | 4.9%(+10.8)#6,598 |
| 64. | Kingston | 15.4% | 3.1%(+12.3)#64 | 4.9%(+10.5)#6,666 |
| 65. | Fox Island | 15.3% | 3.1%(+12.2)#65 | 4.9%(+10.4)#6,698 |
| 66. | Port Hadlock Irondale | 15.2% | 3.1%(+12.1)#66 | 4.9%(+10.3)#6,723 |
| 67. | Darrington | 15.2% | 3.1%(+12.1)#67 | 4.9%(+10.3)#6,730 |
| 68. | Inchelium | 15.0% | 3.1%(+11.9)#68 | 4.9%(+10.1)#6,782 |
| 69. | Canyon Creek | 14.8% | 3.1%(+11.7)#69 | 4.9%(+9.90)#6,819 |
| 70. | Satsop | 14.2% | 3.1%(+11.1)#70 | 4.9%(+9.30)#6,970 |
| 71. | Port Townsend | 14.1% | 3.1%(+11.0)#71 | 4.9%(+9.20)#6,981 |
| 72. | Metaline | 14.1% | 3.1%(+11.0)#72 | 4.9%(+9.20)#7,004 |
| 73. | Cle Elum | 14.0% | 3.1%(+10.9)#73 | 4.9%(+9.10)#7,006 |
| 74. | South Creek | 13.9% | 3.1%(+10.8)#74 | 4.9%(+9.00)#7,027 |
| 75. | Vaughn | 13.6% | 3.1%(+10.5)#75 | 4.9%(+8.70)#7,104 |
| 76. | Fobes Hill | 13.5% | 3.1%(+10.4)#76 | 4.9%(+8.60)#7,126 |
| 77. | Southworth | 13.5% | 3.1%(+10.4)#77 | 4.9%(+8.60)#7,127 |
| 78. | Marrowstone | 13.5% | 3.1%(+10.4)#78 | 4.9%(+8.60)#7,136 |
| 79. | Deep River | 13.5% | 3.1%(+10.4)#79 | 4.9%(+8.60)#7,149 |
| 80. | Lofall | 13.3% | 3.1%(+10.2)#80 | 4.9%(+8.40)#7,183 |
| 81. | Nile | 13.2% | 3.1%(+10.1)#81 | 4.9%(+8.30)#7,236 |
| 82. | Bainbridge Island | 12.6% | 3.1%(+9.50)#82 | 4.9%(+7.70)#7,388 |
| 83. | Pataha | 12.5% | 3.1%(+9.40)#83 | 4.9%(+7.60)#7,440 |
| 84. | Bucoda | 12.4% | 3.1%(+9.30)#84 | 4.9%(+7.50)#7,475 |
| 85. | Riverpoint | 12.3% | 3.1%(+9.20)#85 | 4.9%(+7.40)#7,493 |
| 86. | Riverbend | 12.1% | 3.1%(+9.00)#86 | 4.9%(+7.20)#7,559 |
| 87. | Baring | 12.1% | 3.1%(+9.00)#87 | 4.9%(+7.20)#7,584 |
| 88. | Creston | 11.8% | 3.1%(+8.70)#88 | 4.9%(+6.90)#7,682 |
| 89. | Banks Lake South | 11.8% | 3.1%(+8.70)#89 | 4.9%(+6.90)#7,685 |
| 90. | Allyn | 11.7% | 3.1%(+8.60)#90 | 4.9%(+6.80)#7,703 |
| 91. | Suquamish | 11.6% | 3.1%(+8.50)#91 | 4.9%(+6.70)#7,728 |
| 92. | Hansville | 11.4% | 3.1%(+8.30)#92 | 4.9%(+6.50)#7,798 |
| 93. | Trout Lake | 11.3% | 3.1%(+8.20)#93 | 4.9%(+6.40)#7,846 |
| 94. | Ocean Shores | 11.2% | 3.1%(+8.10)#94 | 4.9%(+6.30)#7,862 |
| 95. | South Cle Elum | 11.1% | 3.1%(+8.00)#95 | 4.9%(+6.20)#7,914 |
| 96. | Brinnon | 11.0% | 3.1%(+7.90)#96 | 4.9%(+6.10)#7,950 |
| 97. | East Cathlamet | 10.7% | 3.1%(+7.60)#97 | 4.9%(+5.80)#8,038 |
| 98. | Amanda Park | 10.7% | 3.1%(+7.60)#98 | 4.9%(+5.80)#8,056 |
| 99. | Birch Bay | 10.4% | 3.1%(+7.30)#99 | 4.9%(+5.50)#8,134 |
| 100. | Kapowsin | 10.3% | 3.1%(+7.20)#100 | 4.9%(+5.40)#8,184 |
Common Questions
What are the Top 10 Cities with the Highest Percentage of Households Heated by Bottled Gas / Liquid Propane in Washington?
Top 10 Cities with the Highest Percentage of Households Heated by Bottled Gas / Liquid Propane in Washington are:
#1
89.1%
#2
72.0%
#3
68.3%
#4
61.0%
#5
53.6%
#6
51.7%
#7
43.8%
#8
43.7%
#9
42.9%
#10
38.6%
What city has the Highest Percentage of Households Heated by Bottled Gas / Liquid Propane in Washington?
La Grande has the Highest Percentage of Households Heated by Bottled Gas / Liquid Propane in Washington with 89.1%.
What is the Percentage of Households Heated by Bottled Gas / Liquid Propane in the State of Washington?
Percentage of Households Heated by Bottled Gas / Liquid Propane in Washington is 3.1%.
What is the Percentage of Households Heated by Bottled Gas / Liquid Propane in the United States?
Percentage of Households Heated by Bottled Gas / Liquid Propane in the United States is 4.9%.