Cities with the Highest Percentage of Immigrants from Nigeria in Washington
RELATED REPORTS & OPTIONS
Nigeria
Washington
Compare Cities
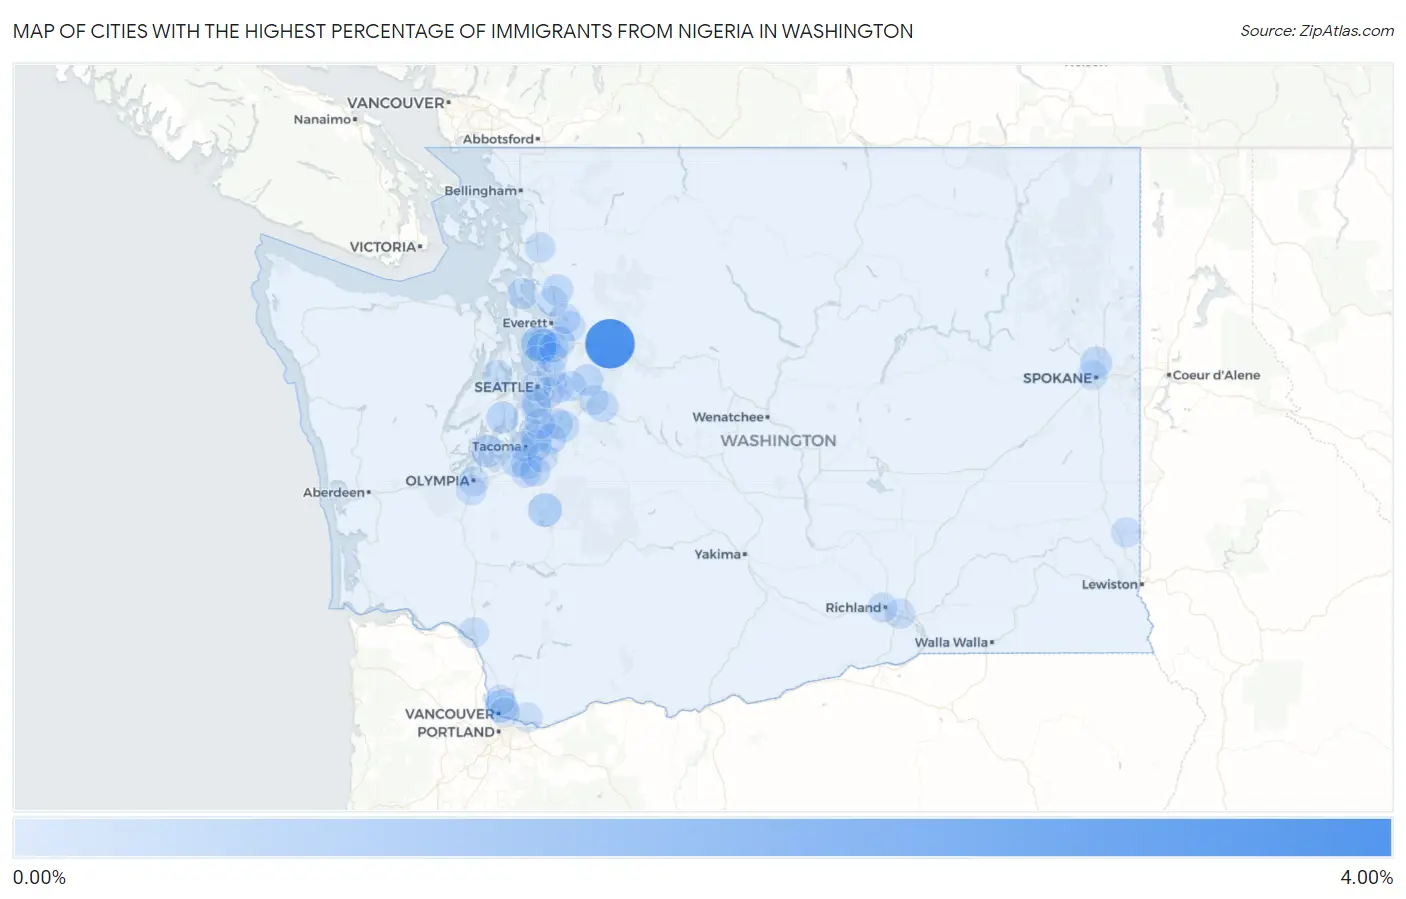
Map of Cities with the Highest Percentage of Immigrants from Nigeria in Washington
0.00%
4.00%
Cities with the Highest Percentage of Immigrants from Nigeria in Washington
| City | Nigeria | vs State | vs National | |
| 1. | Gold Bar | 3.68% | 0.035%(+3.64)#-1 | 0.13%(+3.55)#0 |
| 2. | Meadowdale | 0.93% | 0.035%(+0.900)#0 | 0.13%(+0.809)#1 |
| 3. | Eatonville | 0.67% | 0.035%(+0.633)#1 | 0.13%(+0.542)#2 |
| 4. | Hazel Dell | 0.48% | 0.035%(+0.441)#2 | 0.13%(+0.350)#3 |
| 5. | North Lynnwood | 0.43% | 0.035%(+0.399)#56 | 0.13%(+0.307)#1,628 |
| 6. | Longbranch | 0.42% | 0.035%(+0.382)#57 | 0.13%(+0.291)#1,629 |
| 7. | Burley | 0.36% | 0.035%(+0.322)#58 | 0.13%(+0.230)#1,630 |
| 8. | Country Homes | 0.32% | 0.035%(+0.286)#59 | 0.13%(+0.194)#1,631 |
| 9. | Silver Firs | 0.31% | 0.035%(+0.280)#60 | 0.13%(+0.189)#1,632 |
| 10. | Carnation | 0.28% | 0.035%(+0.244)#61 | 0.13%(+0.153)#1,633 |
| 11. | Arlington | 0.26% | 0.035%(+0.222)#62 | 0.13%(+0.131)#1,634 |
| 12. | Federal Way | 0.23% | 0.035%(+0.200)#67 | 0.13%(+0.109)#1,934 |
| 13. | Camano | 0.22% | 0.035%(+0.181)#68 | 0.13%(+0.090)#1,935 |
| 14. | Covington | 0.20% | 0.035%(+0.167)#69 | 0.13%(+0.076)#1,936 |
| 15. | North Bend | 0.20% | 0.035%(+0.164)#70 | 0.13%(+0.073)#1,937 |
| 16. | Lakewood | 0.18% | 0.035%(+0.141)#71 | 0.13%(+0.050)#1,938 |
| 17. | Parkland | 0.15% | 0.035%(+0.115)#72 | 0.13%(+0.024)#1,939 |
| 18. | Burien | 0.14% | 0.035%(+0.109)#73 | 0.13%(+0.018)#1,940 |
| 19. | Everett | 0.13% | 0.035%(+0.094)#74 | 0.13%(+0.003)#1,941 |
| 20. | Fife Heights | 0.13% | 0.035%(+0.093)#75 | 0.13%(+0.001)#1,942 |
| 21. | Kent | 0.12% | 0.035%(+0.090)#76 | 0.13%(-0.001)#1,943 |
| 22. | Frederickson | 0.12% | 0.035%(+0.083)#77 | 0.13%(-0.009)#1,944 |
| 23. | Mount Vernon | 0.12% | 0.035%(+0.082)#78 | 0.13%(-0.009)#1,945 |
| 24. | Lake Stevens | 0.12% | 0.035%(+0.081)#79 | 0.13%(-0.010)#1,946 |
| 25. | Kelso | 0.095% | 0.035%(+0.060)#80 | 0.13%(-0.031)#1,947 |
| 26. | Silverdale | 0.087% | 0.035%(+0.053)#81 | 0.13%(-0.039)#1,948 |
| 27. | Marysville | 0.085% | 0.035%(+0.050)#82 | 0.13%(-0.041)#2,011 |
| 28. | Salmon Creek | 0.079% | 0.035%(+0.044)#83 | 0.13%(-0.047)#2,012 |
| 29. | Auburn | 0.078% | 0.035%(+0.044)#84 | 0.13%(-0.048)#2,013 |
| 30. | Bellevue | 0.071% | 0.035%(+0.036)#85 | 0.13%(-0.055)#2,014 |
| 31. | Lynnwood | 0.070% | 0.035%(+0.036)#86 | 0.13%(-0.056)#2,015 |
| 32. | Des Moines | 0.067% | 0.035%(+0.033)#87 | 0.13%(-0.058)#2,016 |
| 33. | Sammamish | 0.060% | 0.035%(+0.025)#88 | 0.13%(-0.066)#2,017 |
| 34. | Mercer Island | 0.059% | 0.035%(+0.024)#89 | 0.13%(-0.067)#2,018 |
| 35. | White Center | 0.058% | 0.035%(+0.024)#90 | 0.13%(-0.068)#2,019 |
| 36. | Pasco | 0.056% | 0.035%(+0.021)#91 | 0.13%(-0.070)#2,020 |
| 37. | Tumwater | 0.055% | 0.035%(+0.020)#92 | 0.13%(-0.071)#2,021 |
| 38. | Seattle | 0.049% | 0.035%(+0.014)#93 | 0.13%(-0.077)#2,022 |
| 39. | Pullman | 0.038% | 0.035%(+0.003)#94 | 0.13%(-0.088)#2,023 |
| 40. | Spanaway | 0.032% | 0.035%(-0.002)#95 | 0.13%(-0.093)#2,024 |
| 41. | Bothell | 0.031% | 0.035%(-0.003)#96 | 0.13%(-0.094)#2,025 |
| 42. | Camas | 0.030% | 0.035%(-0.004)#97 | 0.13%(-0.095)#2,026 |
| 43. | Tacoma | 0.030% | 0.035%(-0.005)#98 | 0.13%(-0.096)#2,027 |
| 44. | Snoqualmie | 0.029% | 0.035%(-0.006)#99 | 0.13%(-0.097)#2,028 |
| 45. | Vancouver | 0.027% | 0.035%(-0.008)#100 | 0.13%(-0.099)#2,029 |
| 46. | Richland | 0.025% | 0.035%(-0.010)#101 | 0.13%(-0.101)#2,030 |
| 47. | Shoreline | 0.024% | 0.035%(-0.011)#102 | 0.13%(-0.102)#2,031 |
| 48. | Mill Creek East | 0.024% | 0.035%(-0.011)#103 | 0.13%(-0.102)#2,032 |
| 49. | Spokane | 0.019% | 0.035%(-0.016)#104 | 0.13%(-0.107)#2,033 |
| 50. | Puyallup | 0.019% | 0.035%(-0.016)#105 | 0.13%(-0.107)#2,034 |
| 51. | Olympia | 0.013% | 0.035%(-0.022)#106 | 0.13%(-0.113)#2,035 |
| 52. | Kirkland | 0.0098% | 0.035%(-0.025)#107 | 0.13%(-0.116)#2,036 |
Common Questions
What are the Top 10 Cities with the Highest Percentage of Immigrants from Nigeria in Washington?
Top 10 Cities with the Highest Percentage of Immigrants from Nigeria in Washington are:
#1
3.68%
#2
0.93%
#3
0.67%
#4
0.48%
#5
0.43%
#6
0.42%
#7
0.36%
#8
0.32%
#9
0.31%
#10
0.28%
What city has the Highest Percentage of Immigrants from Nigeria in Washington?
Gold Bar has the Highest Percentage of Immigrants from Nigeria in Washington with 3.68%.
What is the Percentage of Immigrants from Nigeria in the State of Washington?
Percentage of Immigrants from Nigeria in Washington is 0.035%.
What is the Percentage of Immigrants from Nigeria in the United States?
Percentage of Immigrants from Nigeria in the United States is 0.13%.