Roslyn, WA Map & Demographics
Roslyn Map
Roslyn Overview
$41,980
PER CAPITA INCOME
$79,500
AVG FAMILY INCOME
$64,500
AVG HOUSEHOLD INCOME
6.6%
WAGE / INCOME GAP [ % ]
93.4¢/ $1
WAGE / INCOME GAP [ $ ]
0.47
INEQUALITY / GINI INDEX
827
TOTAL POPULATION
479
MALE POPULATION
348
FEMALE POPULATION
137.64
MALES / 100 FEMALES
72.65
FEMALES / 100 MALES
42.5
MEDIAN AGE
2.6
AVG FAMILY SIZE
2.2
AVG HOUSEHOLD SIZE
431
LABOR FORCE [ PEOPLE ]
62.9%
PERCENT IN LABOR FORCE
6.5%
UNEMPLOYMENT RATE
Roslyn Zip Codes
Roslyn Area Codes
Income in Roslyn
Income Overview in Roslyn
Per Capita Income in Roslyn is $41,980, while median incomes of families and households are $79,500 and $64,500 respectively.
| Characteristic | Number | Measure |
| Per Capita Income | 827 | $41,980 |
| Median Family Income | 220 | $79,500 |
| Mean Family Income | 220 | $100,717 |
| Median Household Income | 378 | $64,500 |
| Mean Household Income | 378 | $89,756 |
| Income Deficit | 220 | $0 |
| Wage / Income Gap (%) | 827 | 6.55% |
| Wage / Income Gap ($) | 827 | 93.45¢ per $1 |
| Gini / Inequality Index | 827 | 0.47 |
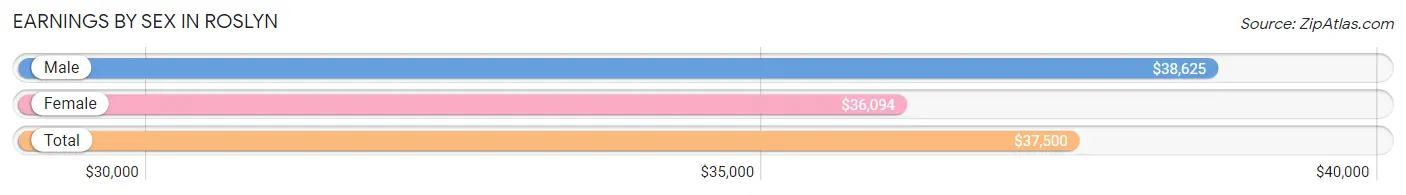
Earnings by Sex in Roslyn
Average Earnings in Roslyn are $37,500, $38,625 for men and $36,094 for women, a difference of 6.6%.
| Sex | Number | Average Earnings |
| Male | 285 (63.9%) | $38,625 |
| Female | 161 (36.1%) | $36,094 |
| Total | 446 (100.0%) | $37,500 |
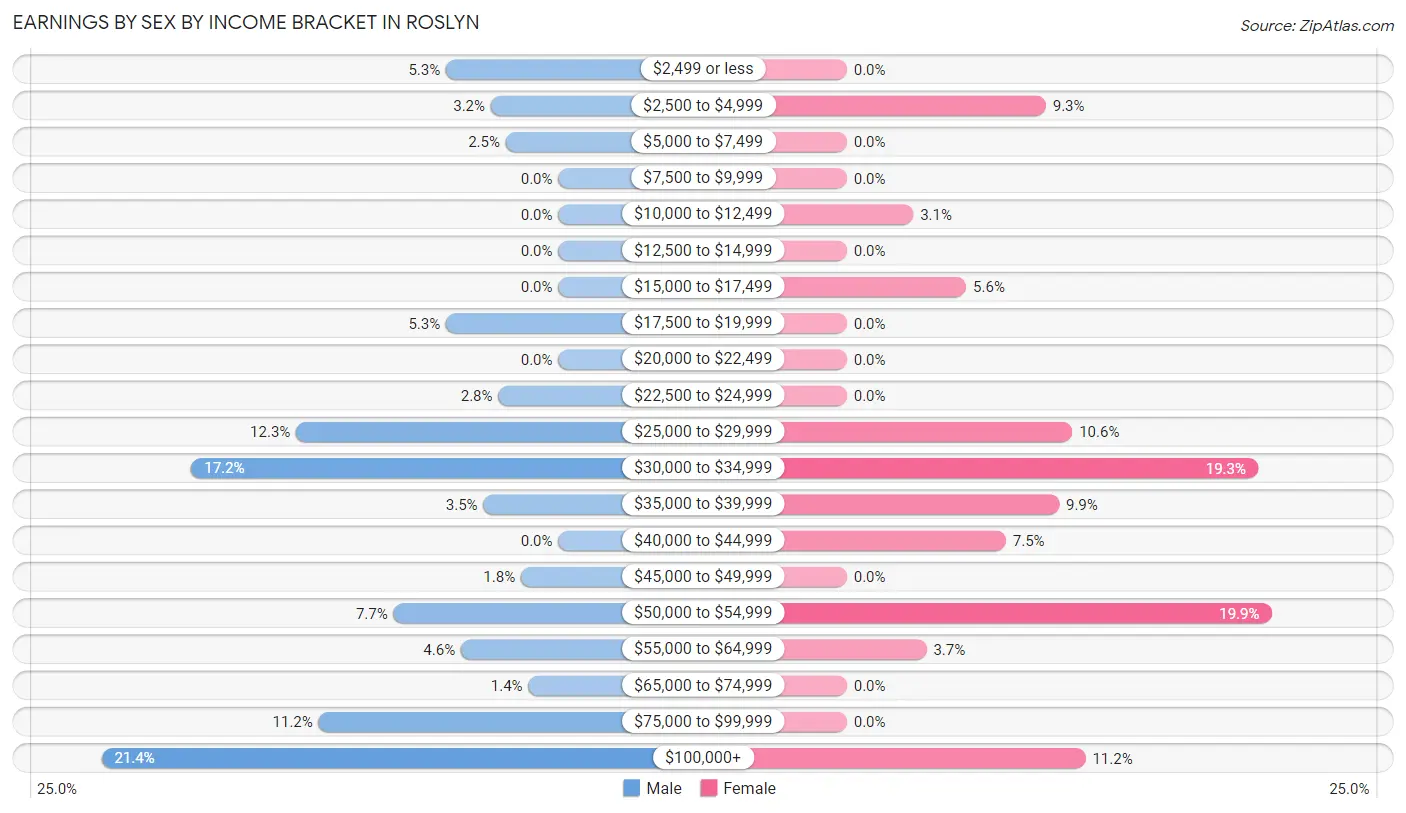
Earnings by Sex by Income Bracket in Roslyn
The most common earnings brackets in Roslyn are $100,000+ for men (61 | 21.4%) and $50,000 to $54,999 for women (32 | 19.9%).
| Income | Male | Female |
| $2,499 or less | 15 (5.3%) | 0 (0.0%) |
| $2,500 to $4,999 | 9 (3.2%) | 15 (9.3%) |
| $5,000 to $7,499 | 7 (2.5%) | 0 (0.0%) |
| $7,500 to $9,999 | 0 (0.0%) | 0 (0.0%) |
| $10,000 to $12,499 | 0 (0.0%) | 5 (3.1%) |
| $12,500 to $14,999 | 0 (0.0%) | 0 (0.0%) |
| $15,000 to $17,499 | 0 (0.0%) | 9 (5.6%) |
| $17,500 to $19,999 | 15 (5.3%) | 0 (0.0%) |
| $20,000 to $22,499 | 0 (0.0%) | 0 (0.0%) |
| $22,500 to $24,999 | 8 (2.8%) | 0 (0.0%) |
| $25,000 to $29,999 | 35 (12.3%) | 17 (10.6%) |
| $30,000 to $34,999 | 49 (17.2%) | 31 (19.3%) |
| $35,000 to $39,999 | 10 (3.5%) | 16 (9.9%) |
| $40,000 to $44,999 | 0 (0.0%) | 12 (7.4%) |
| $45,000 to $49,999 | 5 (1.8%) | 0 (0.0%) |
| $50,000 to $54,999 | 22 (7.7%) | 32 (19.9%) |
| $55,000 to $64,999 | 13 (4.6%) | 6 (3.7%) |
| $65,000 to $74,999 | 4 (1.4%) | 0 (0.0%) |
| $75,000 to $99,999 | 32 (11.2%) | 0 (0.0%) |
| $100,000+ | 61 (21.4%) | 18 (11.2%) |
| Total | 285 (100.0%) | 161 (100.0%) |
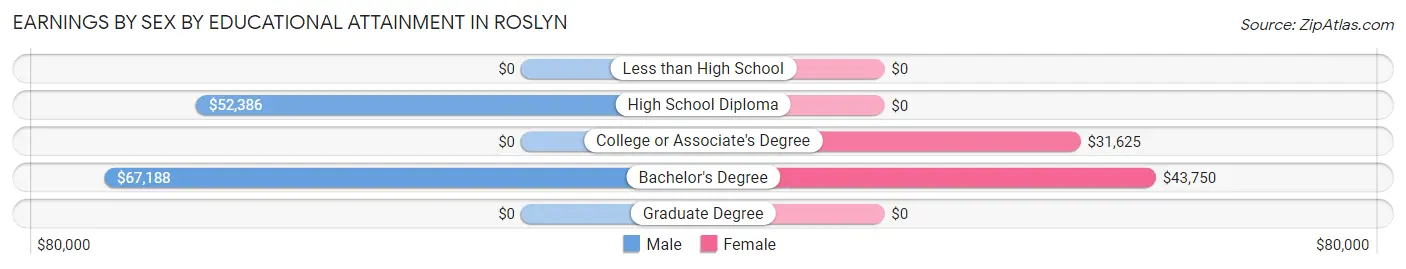
Earnings by Sex by Educational Attainment in Roslyn
Average earnings in Roslyn are $46,500 for men and $36,875 for women, a difference of 20.7%. Men with an educational attainment of bachelor's degree enjoy the highest average annual earnings of $67,188, while those with high school diploma education earn the least with $52,386. Women with an educational attainment of bachelor's degree earn the most with the average annual earnings of $43,750, while those with college or associate's degree education have the smallest earnings of $31,625.
| Educational Attainment | Male Income | Female Income |
| Less than High School | - | - |
| High School Diploma | $52,386 | $0 |
| College or Associate's Degree | - | - |
| Bachelor's Degree | $67,188 | $43,750 |
| Graduate Degree | - | - |
| Total | $46,500 | $36,875 |
Family Income in Roslyn
Family Income Brackets in Roslyn
According to the Roslyn family income data, there are 49 families falling into the $75,000 to $99,999 income range, which is the most common income bracket and makes up 22.3% of all families.
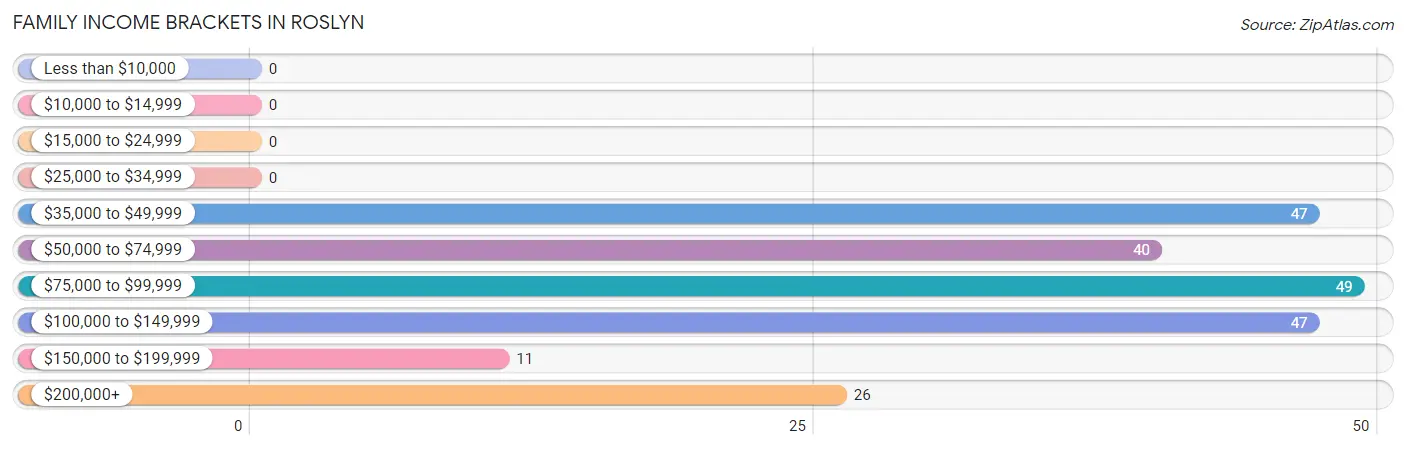
| Income Bracket | # Families | % Families |
| Less than $10,000 | 0 | 0.0% |
| $10,000 to $14,999 | 0 | 0.0% |
| $15,000 to $24,999 | 0 | 0.0% |
| $25,000 to $34,999 | 0 | 0.0% |
| $35,000 to $49,999 | 47 | 21.4% |
| $50,000 to $74,999 | 40 | 18.2% |
| $75,000 to $99,999 | 49 | 22.3% |
| $100,000 to $149,999 | 47 | 21.4% |
| $150,000 to $199,999 | 11 | 5.0% |
| $200,000+ | 26 | 11.8% |
Family Income by Famaliy Size in Roslyn
3-person families (54 | 24.5%) account for the highest median family income in Roslyn with $100,313 per family, while 2-person families (99 | 45.0%) have the highest median income of $38,812 per family member.
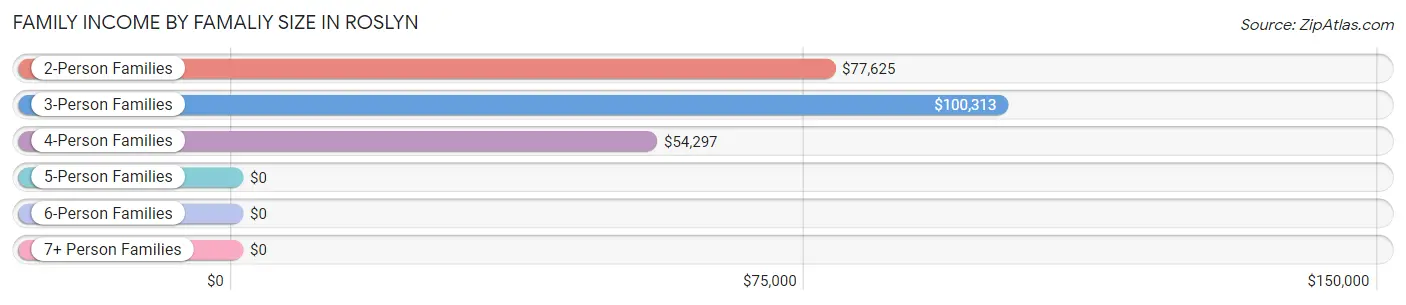
| Income Bracket | # Families | Median Income |
| 2-Person Families | 99 (45.0%) | $77,625 |
| 3-Person Families | 54 (24.5%) | $100,313 |
| 4-Person Families | 67 (30.4%) | $54,297 |
| 5-Person Families | 0 (0.0%) | $0 |
| 6-Person Families | 0 (0.0%) | $0 |
| 7+ Person Families | 0 (0.0%) | $0 |
| Total | 220 (100.0%) | $79,500 |
Family Income by Number of Earners in Roslyn
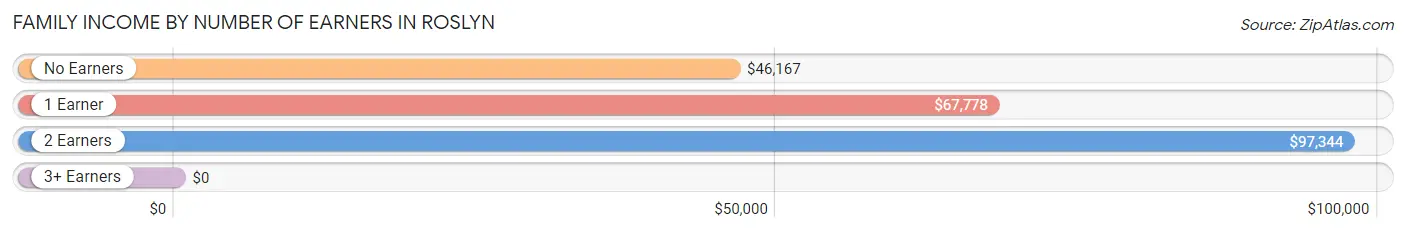
| Number of Earners | # Families | Median Income |
| No Earners | 34 (15.4%) | $46,167 |
| 1 Earner | 78 (35.4%) | $67,778 |
| 2 Earners | 92 (41.8%) | $97,344 |
| 3+ Earners | 16 (7.3%) | $0 |
| Total | 220 (100.0%) | $79,500 |
Household Income in Roslyn
Household Income Brackets in Roslyn
With 65 households falling in the category, the $100,000 to $149,999 income range is the most frequent in Roslyn, accounting for 17.2% of all households. In contrast, only 6 households (1.6%) fall into the $25,000 to $34,999 income bracket, making it the least populous group.
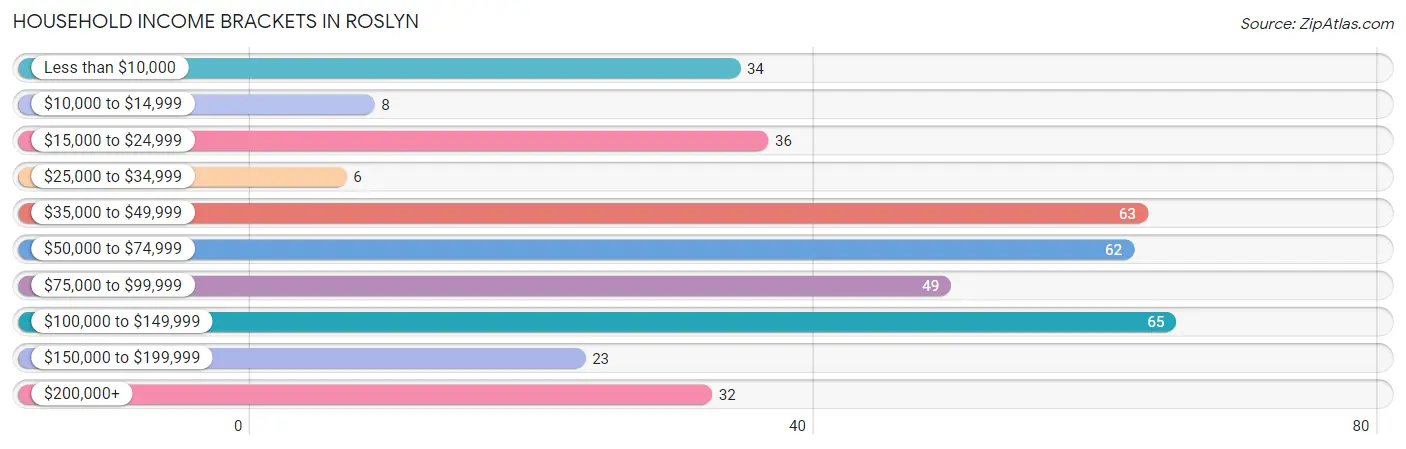
| Income Bracket | # Households | % Households |
| Less than $10,000 | 34 | 9.0% |
| $10,000 to $14,999 | 8 | 2.1% |
| $15,000 to $24,999 | 36 | 9.5% |
| $25,000 to $34,999 | 6 | 1.6% |
| $35,000 to $49,999 | 63 | 16.7% |
| $50,000 to $74,999 | 62 | 16.4% |
| $75,000 to $99,999 | 49 | 13.0% |
| $100,000 to $149,999 | 65 | 17.2% |
| $150,000 to $199,999 | 23 | 6.1% |
| $200,000+ | 32 | 8.5% |
Household Income by Householder Age in Roslyn
The median household income in Roslyn is $64,500, with the highest median household income of $96,094 found in the 45 to 64 years age bracket for the primary householder. A total of 175 households (46.3%) fall into this category.
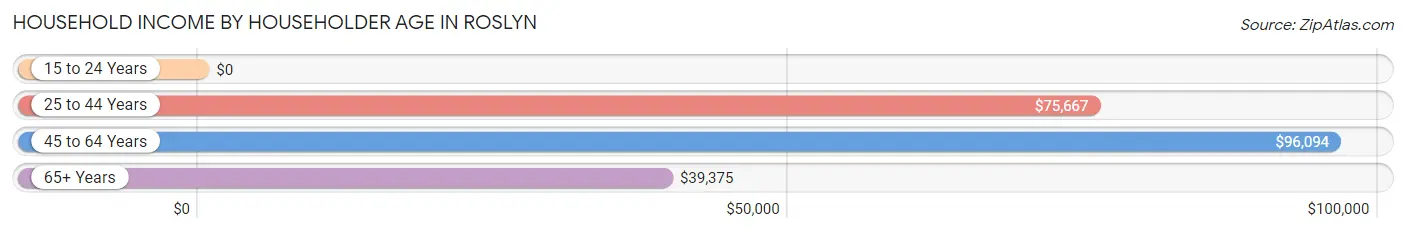
| Income Bracket | # Households | Median Income |
| 15 to 24 Years | 0 (0.0%) | $0 |
| 25 to 44 Years | 134 (35.4%) | $75,667 |
| 45 to 64 Years | 175 (46.3%) | $96,094 |
| 65+ Years | 69 (18.2%) | $39,375 |
| Total | 378 (100.0%) | $64,500 |
Poverty in Roslyn
Income Below Poverty by Sex and Age in Roslyn
With 2.1% poverty level for males and 9.2% for females among the residents of Roslyn, 45 to 54 year old males and 55 to 64 year old females are the most vulnerable to poverty, with 8 males (12.1%) and 32 females (38.1%) in their respective age groups living below the poverty level.
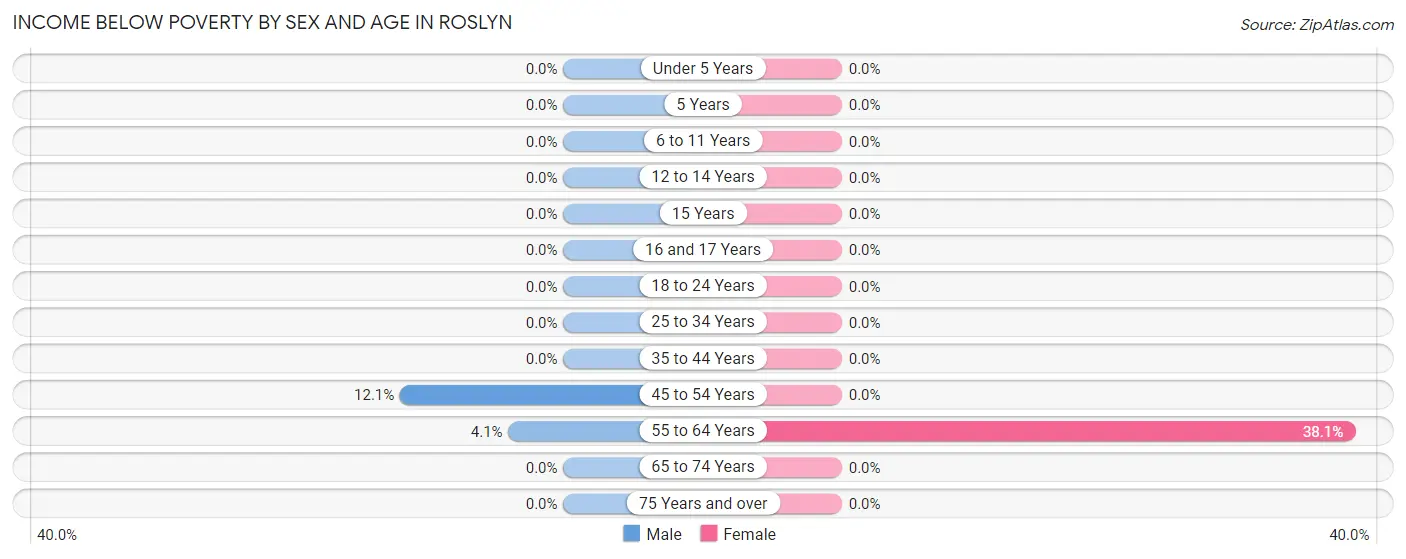
| Age Bracket | Male | Female |
| Under 5 Years | 0 (0.0%) | 0 (0.0%) |
| 5 Years | 0 (0.0%) | 0 (0.0%) |
| 6 to 11 Years | 0 (0.0%) | 0 (0.0%) |
| 12 to 14 Years | 0 (0.0%) | 0 (0.0%) |
| 15 Years | 0 (0.0%) | 0 (0.0%) |
| 16 and 17 Years | 0 (0.0%) | 0 (0.0%) |
| 18 to 24 Years | 0 (0.0%) | 0 (0.0%) |
| 25 to 34 Years | 0 (0.0%) | 0 (0.0%) |
| 35 to 44 Years | 0 (0.0%) | 0 (0.0%) |
| 45 to 54 Years | 8 (12.1%) | 0 (0.0%) |
| 55 to 64 Years | 2 (4.1%) | 32 (38.1%) |
| 65 to 74 Years | 0 (0.0%) | 0 (0.0%) |
| 75 Years and over | 0 (0.0%) | 0 (0.0%) |
| Total | 10 (2.1%) | 32 (9.2%) |
Income Above Poverty by Sex and Age in Roslyn
According to the poverty statistics in Roslyn, males aged under 5 years and females aged under 5 years are the age groups that are most secure financially, with 100.0% of males and 100.0% of females in these age groups living above the poverty line.
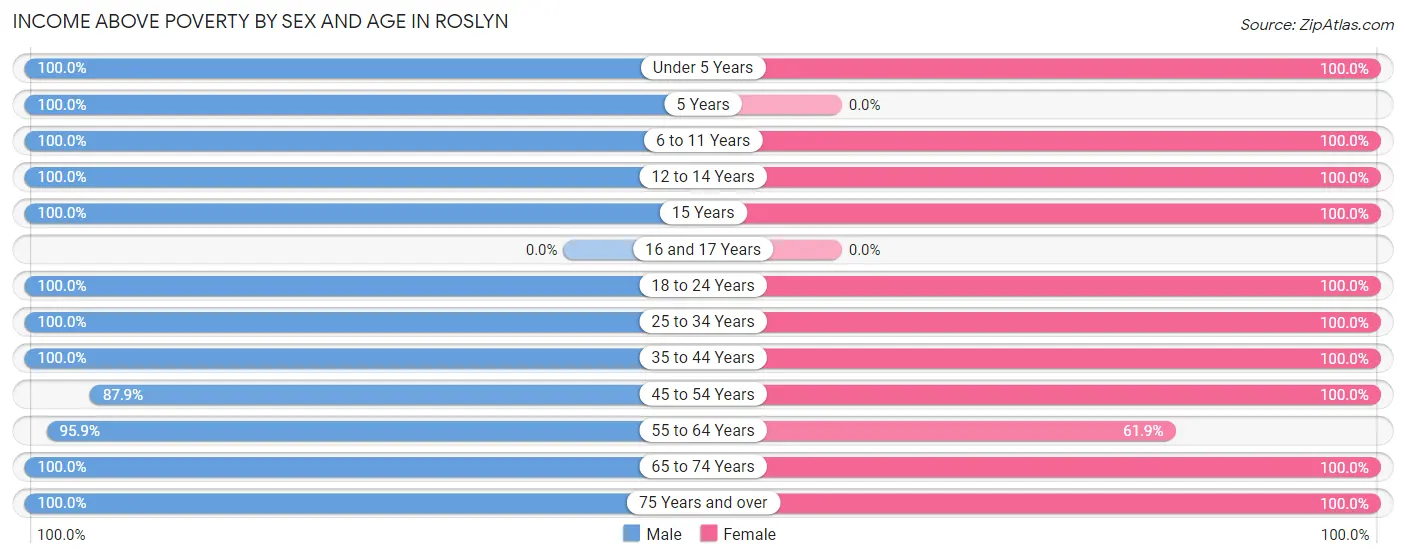
| Age Bracket | Male | Female |
| Under 5 Years | 30 (100.0%) | 16 (100.0%) |
| 5 Years | 16 (100.0%) | 0 (0.0%) |
| 6 to 11 Years | 11 (100.0%) | 8 (100.0%) |
| 12 to 14 Years | 20 (100.0%) | 9 (100.0%) |
| 15 Years | 11 (100.0%) | 21 (100.0%) |
| 16 and 17 Years | 0 (0.0%) | 0 (0.0%) |
| 18 to 24 Years | 17 (100.0%) | 5 (100.0%) |
| 25 to 34 Years | 121 (100.0%) | 65 (100.0%) |
| 35 to 44 Years | 65 (100.0%) | 53 (100.0%) |
| 45 to 54 Years | 58 (87.9%) | 48 (100.0%) |
| 55 to 64 Years | 47 (95.9%) | 52 (61.9%) |
| 65 to 74 Years | 64 (100.0%) | 17 (100.0%) |
| 75 Years and over | 9 (100.0%) | 22 (100.0%) |
| Total | 469 (97.9%) | 316 (90.8%) |
Income Below Poverty Among Married-Couple Families in Roslyn
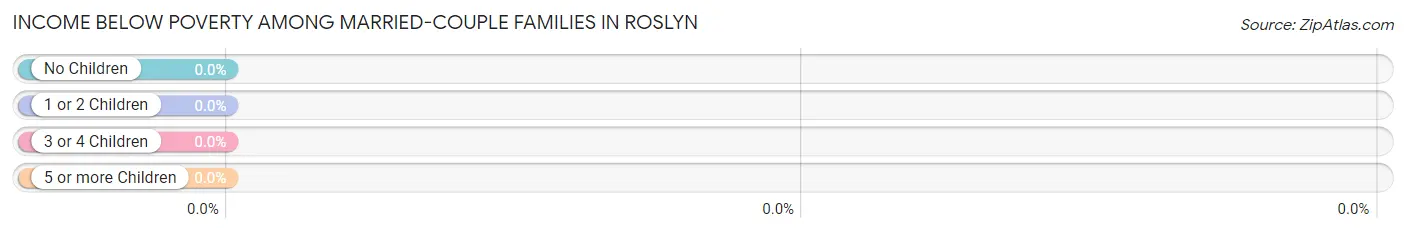
| Children | Above Poverty | Below Poverty |
| No Children | 131 (100.0%) | 0 (0.0%) |
| 1 or 2 Children | 54 (100.0%) | 0 (0.0%) |
| 3 or 4 Children | 0 (0.0%) | 0 (0.0%) |
| 5 or more Children | 0 (0.0%) | 0 (0.0%) |
| Total | 185 (100.0%) | 0 (0.0%) |
Income Below Poverty Among Single-Parent Households in Roslyn
| Children | Single Father | Single Mother |
| No Children | 0 (0.0%) | 0 (0.0%) |
| 1 or 2 Children | 0 (0.0%) | 0 (0.0%) |
| 3 or 4 Children | 0 (0.0%) | 0 (0.0%) |
| 5 or more Children | 0 (0.0%) | 0 (0.0%) |
| Total | 0 (0.0%) | 0 (0.0%) |
Income Below Poverty Among Married-Couple vs Single-Parent Households in Roslyn
| Children | Married-Couple Families | Single-Parent Households |
| No Children | 0 (0.0%) | 0 (0.0%) |
| 1 or 2 Children | 0 (0.0%) | 0 (0.0%) |
| 3 or 4 Children | 0 (0.0%) | 0 (0.0%) |
| 5 or more Children | 0 (0.0%) | 0 (0.0%) |
| Total | 0 (0.0%) | 0 (0.0%) |
Race in Roslyn
The most populous races in Roslyn are White / Caucasian (604 | 73.0%), Two or more Races (133 | 16.1%), and Hispanic or Latino (114 | 13.8%).
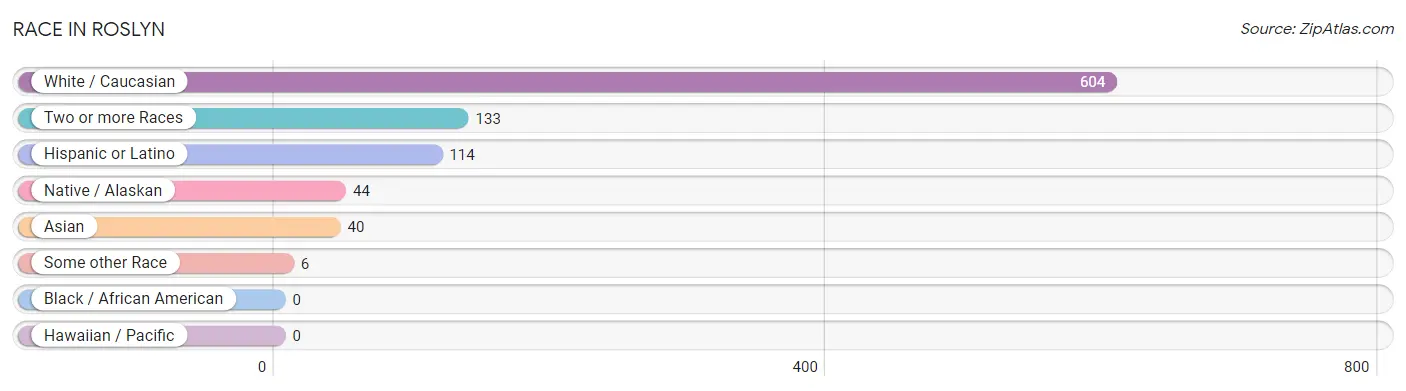
| Race | # Population | % Population |
| Asian | 40 | 4.8% |
| Black / African American | 0 | 0.0% |
| Hawaiian / Pacific | 0 | 0.0% |
| Hispanic or Latino | 114 | 13.8% |
| Native / Alaskan | 44 | 5.3% |
| White / Caucasian | 604 | 73.0% |
| Two or more Races | 133 | 16.1% |
| Some other Race | 6 | 0.7% |
| Total | 827 | 100.0% |
Ancestry in Roslyn
The most populous ancestries reported in Roslyn are Irish (116 | 14.0%), German (114 | 13.8%), Mexican (114 | 13.8%), English (93 | 11.3%), and European (67 | 8.1%), together accounting for 60.9% of all Roslyn residents.
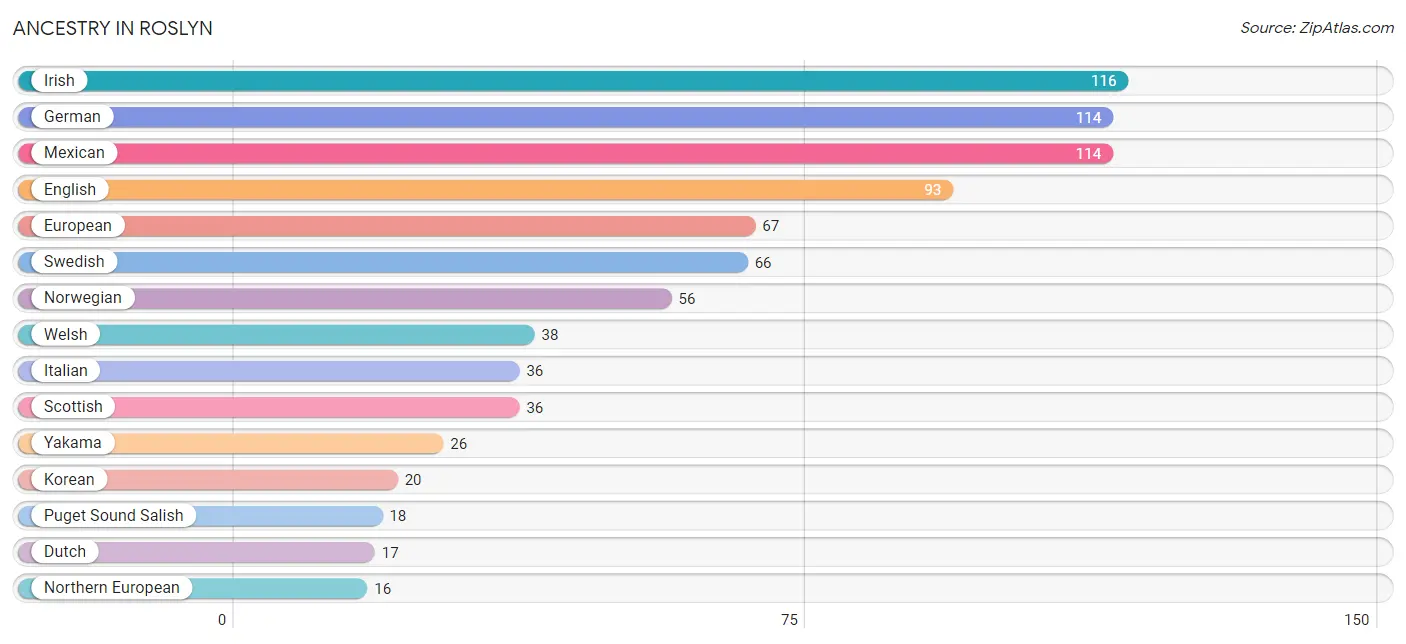
| Ancestry | # Population | % Population |
| American | 11 | 1.3% |
| Basque | 6 | 0.7% |
| Cherokee | 9 | 1.1% |
| Croatian | 10 | 1.2% |
| Dutch | 17 | 2.1% |
| English | 93 | 11.3% |
| European | 67 | 8.1% |
| French | 7 | 0.9% |
| German | 114 | 13.8% |
| Irish | 116 | 14.0% |
| Italian | 36 | 4.3% |
| Korean | 20 | 2.4% |
| Mexican | 114 | 13.8% |
| Northern European | 16 | 1.9% |
| Norwegian | 56 | 6.8% |
| Polish | 2 | 0.2% |
| Portuguese | 12 | 1.5% |
| Puget Sound Salish | 18 | 2.2% |
| Scotch-Irish | 9 | 1.1% |
| Scottish | 36 | 4.3% |
| Slovak | 10 | 1.2% |
| Sri Lankan | 15 | 1.8% |
| Swedish | 66 | 8.0% |
| Welsh | 38 | 4.6% |
| Yakama | 26 | 3.1% | View All 25 Rows |
Immigrants in Roslyn
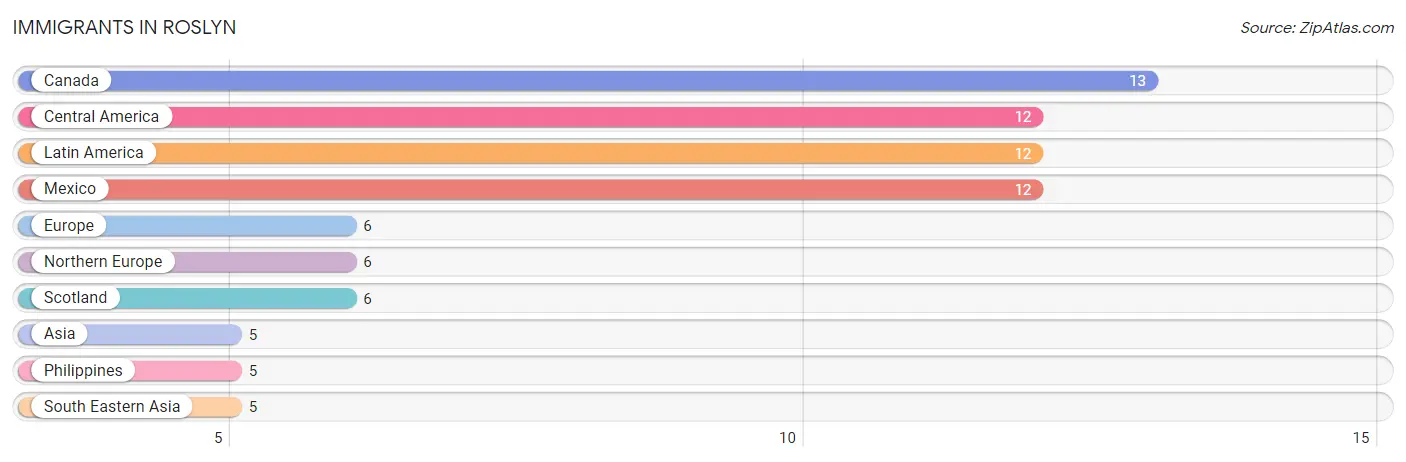
The most numerous immigrant groups reported in Roslyn came from Canada (13 | 1.6%), Central America (12 | 1.5%), Latin America (12 | 1.5%), Mexico (12 | 1.5%), and Europe (6 | 0.7%), together accounting for 6.6% of all Roslyn residents.
| Immigration Origin | # Population | % Population |
| Asia | 5 | 0.6% |
| Canada | 13 | 1.6% |
| Central America | 12 | 1.5% |
| Europe | 6 | 0.7% |
| Latin America | 12 | 1.5% |
| Mexico | 12 | 1.5% |
| Northern Europe | 6 | 0.7% |
| Philippines | 5 | 0.6% |
| Scotland | 6 | 0.7% |
| South Eastern Asia | 5 | 0.6% | View All 10 Rows |
Sex and Age in Roslyn
Sex and Age in Roslyn
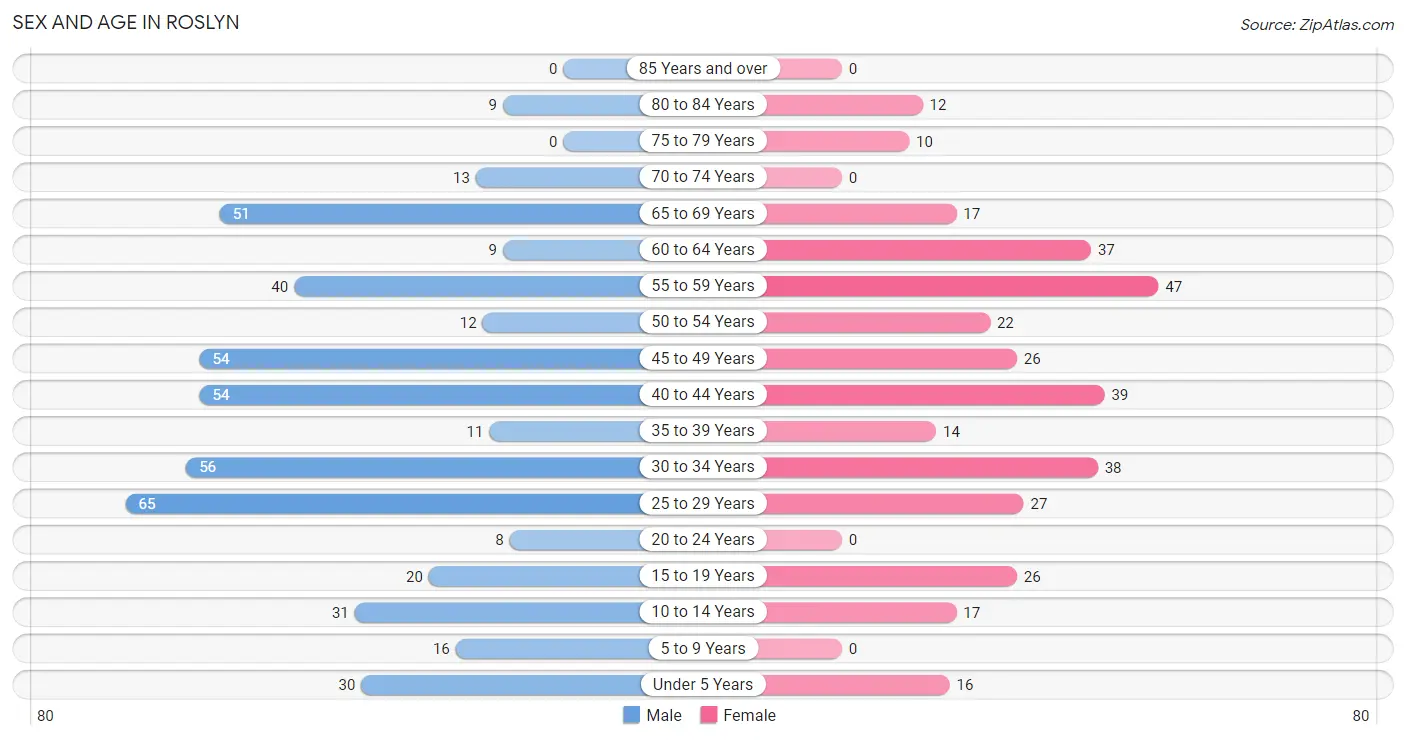
The most populous age groups in Roslyn are 25 to 29 Years (65 | 13.6%) for men and 55 to 59 Years (47 | 13.5%) for women.
| Age Bracket | Male | Female |
| Under 5 Years | 30 (6.3%) | 16 (4.6%) |
| 5 to 9 Years | 16 (3.3%) | 0 (0.0%) |
| 10 to 14 Years | 31 (6.5%) | 17 (4.9%) |
| 15 to 19 Years | 20 (4.2%) | 26 (7.5%) |
| 20 to 24 Years | 8 (1.7%) | 0 (0.0%) |
| 25 to 29 Years | 65 (13.6%) | 27 (7.8%) |
| 30 to 34 Years | 56 (11.7%) | 38 (10.9%) |
| 35 to 39 Years | 11 (2.3%) | 14 (4.0%) |
| 40 to 44 Years | 54 (11.3%) | 39 (11.2%) |
| 45 to 49 Years | 54 (11.3%) | 26 (7.5%) |
| 50 to 54 Years | 12 (2.5%) | 22 (6.3%) |
| 55 to 59 Years | 40 (8.4%) | 47 (13.5%) |
| 60 to 64 Years | 9 (1.9%) | 37 (10.6%) |
| 65 to 69 Years | 51 (10.6%) | 17 (4.9%) |
| 70 to 74 Years | 13 (2.7%) | 0 (0.0%) |
| 75 to 79 Years | 0 (0.0%) | 10 (2.9%) |
| 80 to 84 Years | 9 (1.9%) | 12 (3.5%) |
| 85 Years and over | 0 (0.0%) | 0 (0.0%) |
| Total | 479 (100.0%) | 348 (100.0%) |
Families and Households in Roslyn
Median Family Size in Roslyn
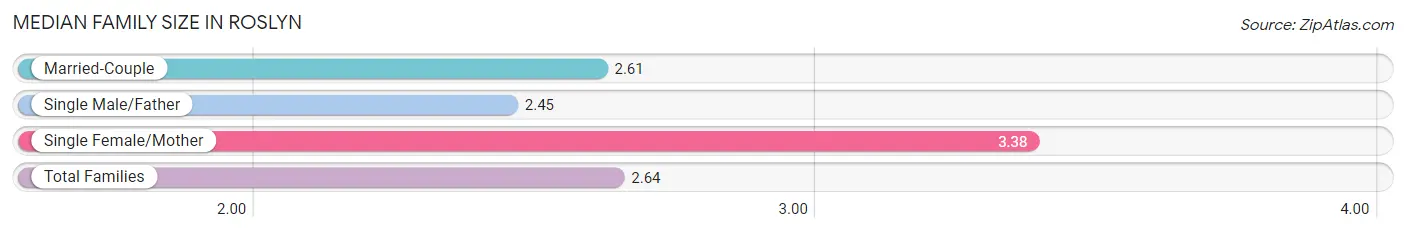
The median family size in Roslyn is 2.64 persons per family, with single female/mother families (13 | 5.9%) accounting for the largest median family size of 3.38 persons per family. On the other hand, single male/father families (22 | 10.0%) represent the smallest median family size with 2.45 persons per family.
| Family Type | # Families | Family Size |
| Married-Couple | 185 (84.1%) | 2.61 |
| Single Male/Father | 22 (10.0%) | 2.45 |
| Single Female/Mother | 13 (5.9%) | 3.38 |
| Total Families | 220 (100.0%) | 2.64 |
Median Household Size in Roslyn
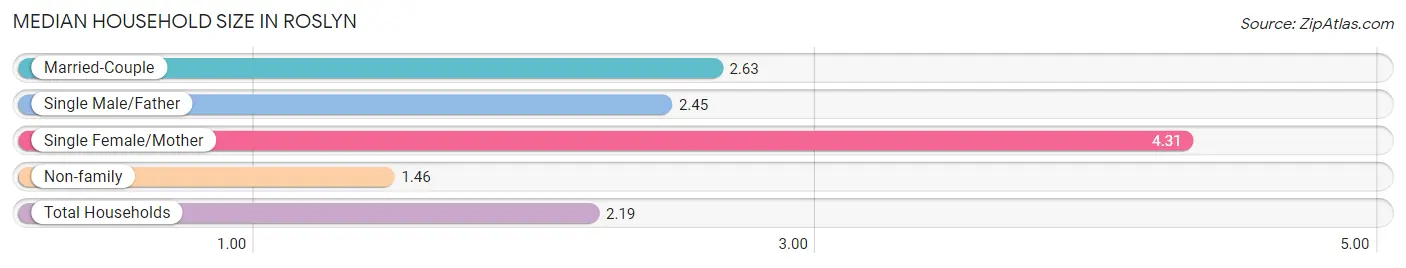
The median household size in Roslyn is 2.19 persons per household, with single female/mother households (13 | 3.4%) accounting for the largest median household size of 4.31 persons per household. non-family households (158 | 41.8%) represent the smallest median household size with 1.46 persons per household.
| Household Type | # Households | Household Size |
| Married-Couple | 185 (48.9%) | 2.63 |
| Single Male/Father | 22 (5.8%) | 2.45 |
| Single Female/Mother | 13 (3.4%) | 4.31 |
| Non-family | 158 (41.8%) | 1.46 |
| Total Households | 378 (100.0%) | 2.19 |
Household Size by Marriage Status in Roslyn
Out of a total of 378 households in Roslyn, 220 (58.2%) are family households, while 158 (41.8%) are nonfamily households. The most numerous type of family households are 2-person households, comprising 94, and the most common type of nonfamily households are 1-person households, comprising 113.
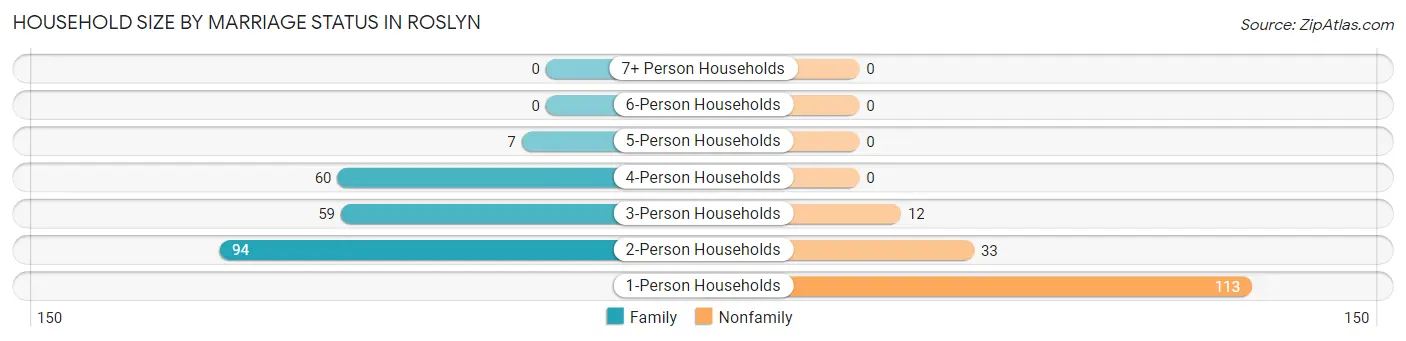
| Household Size | Family Households | Nonfamily Households |
| 1-Person Households | - | 113 (29.9%) |
| 2-Person Households | 94 (24.9%) | 33 (8.7%) |
| 3-Person Households | 59 (15.6%) | 12 (3.2%) |
| 4-Person Households | 60 (15.9%) | 0 (0.0%) |
| 5-Person Households | 7 (1.8%) | 0 (0.0%) |
| 6-Person Households | 0 (0.0%) | 0 (0.0%) |
| 7+ Person Households | 0 (0.0%) | 0 (0.0%) |
| Total | 220 (58.2%) | 158 (41.8%) |
Female Fertility in Roslyn
Fertility by Age in Roslyn
| Age Bracket | Women with Births | Births / 1,000 Women |
| 15 to 19 years | 0 (0.0%) | 0.0 |
| 20 to 34 years | 0 (0.0%) | 0.0 |
| 35 to 50 years | 0 (0.0%) | 0.0 |
| Total | 0 (0.0%) | 0.0 |
Fertility by Age by Marriage Status in Roslyn
| Age Bracket | Married | Unmarried |
| 15 to 19 years | 0 (0.0%) | 0 (0.0%) |
| 20 to 34 years | 0 (0.0%) | 0 (0.0%) |
| 35 to 50 years | 0 (0.0%) | 0 (0.0%) |
| Total | 0 (0.0%) | 0 (0.0%) |
Fertility by Education in Roslyn
| Educational Attainment | Women with Births | Births / 1,000 Women |
| Less than High School | 0 (0.0%) | 0.0 |
| High School Diploma | 0 (0.0%) | 0.0 |
| College or Associate's Degree | 0 (0.0%) | 0.0 |
| Bachelor's Degree | 0 (0.0%) | 0.0 |
| Graduate Degree | 0 (0.0%) | 0.0 |
| Total | 0 (0.0%) | 0.0 |
Fertility by Education by Marriage Status in Roslyn
| Educational Attainment | Married | Unmarried |
| Less than High School | 0 (0.0%) | 0 (0.0%) |
| High School Diploma | 0 (0.0%) | 0 (0.0%) |
| College or Associate's Degree | 0 (0.0%) | 0 (0.0%) |
| Bachelor's Degree | 0 (0.0%) | 0 (0.0%) |
| Graduate Degree | 0 (0.0%) | 0 (0.0%) |
| Total | 0 (0.0%) | 0 (0.0%) |
Employment Characteristics in Roslyn
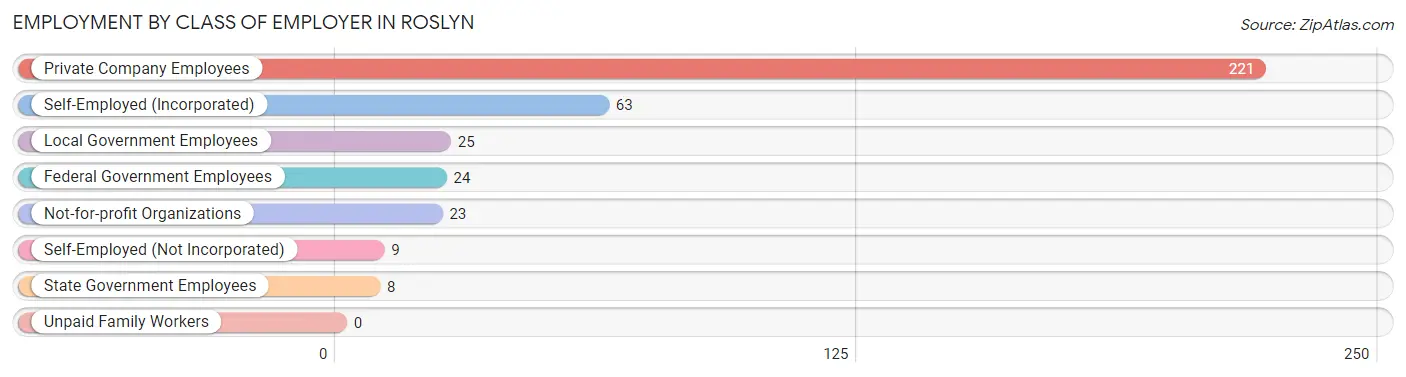
Employment by Class of Employer in Roslyn
Among the 373 employed individuals in Roslyn, private company employees (221 | 59.3%), self-employed (incorporated) (63 | 16.9%), and local government employees (25 | 6.7%) make up the most common classes of employment.
| Employer Class | # Employees | % Employees |
| Private Company Employees | 221 | 59.3% |
| Self-Employed (Incorporated) | 63 | 16.9% |
| Self-Employed (Not Incorporated) | 9 | 2.4% |
| Not-for-profit Organizations | 23 | 6.2% |
| Local Government Employees | 25 | 6.7% |
| State Government Employees | 8 | 2.1% |
| Federal Government Employees | 24 | 6.4% |
| Unpaid Family Workers | 0 | 0.0% |
| Total | 373 | 100.0% |
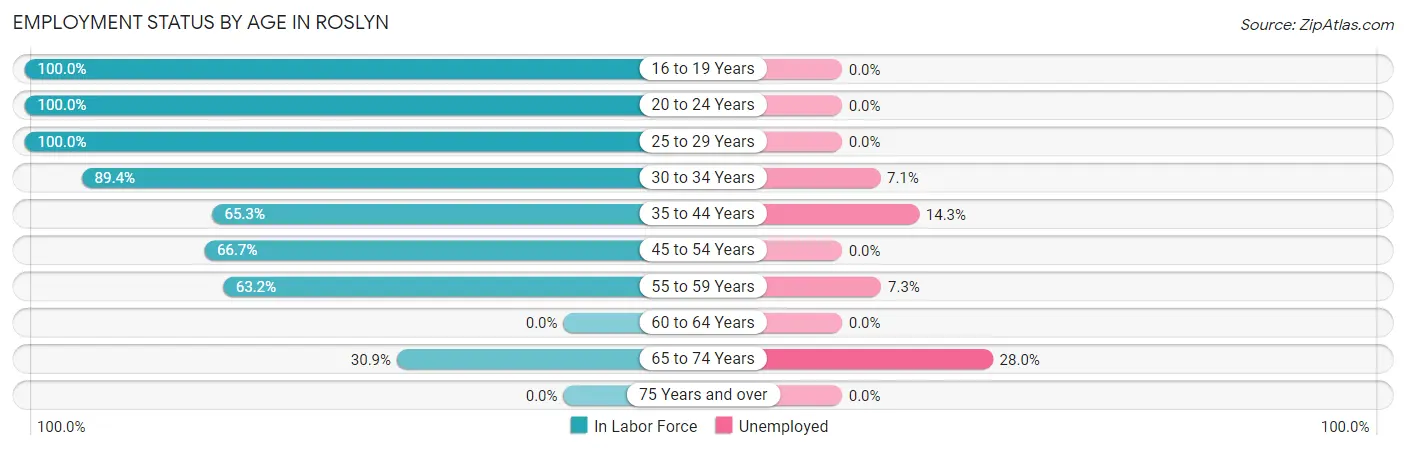
Employment Status by Age in Roslyn
According to the labor force statistics for Roslyn, out of the total population over 16 years of age (685), 62.9% or 431 individuals are in the labor force, with 6.5% or 28 of them unemployed. The age group with the highest labor force participation rate is 16 to 19 years, with 100.0% or 14 individuals in the labor force. Within the labor force, the 65 to 74 years age range has the highest percentage of unemployed individuals, with 28.0% or 7 of them being unemployed.
| Age Bracket | In Labor Force | Unemployed |
| 16 to 19 Years | 14 (100.0%) | 0 (0.0%) |
| 20 to 24 Years | 8 (100.0%) | 0 (0.0%) |
| 25 to 29 Years | 92 (100.0%) | 0 (0.0%) |
| 30 to 34 Years | 84 (89.4%) | 6 (7.1%) |
| 35 to 44 Years | 77 (65.3%) | 11 (14.3%) |
| 45 to 54 Years | 76 (66.7%) | 0 (0.0%) |
| 55 to 59 Years | 55 (63.2%) | 4 (7.3%) |
| 60 to 64 Years | 0 (0.0%) | 0 (0.0%) |
| 65 to 74 Years | 25 (30.9%) | 7 (28.0%) |
| 75 Years and over | 0 (0.0%) | 0 (0.0%) |
| Total | 431 (62.9%) | 28 (6.5%) |
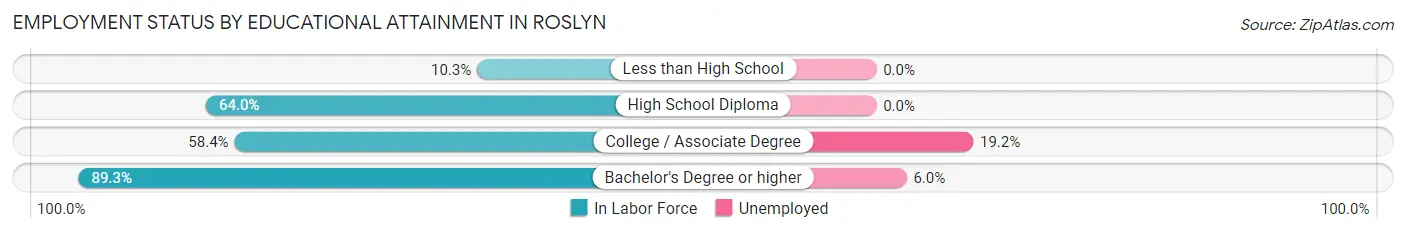
Employment Status by Educational Attainment in Roslyn
According to labor force statistics for Roslyn, 69.7% of individuals (384) out of the total population between 25 and 64 years of age (551) are in the labor force, with 5.5% or 21 of them being unemployed. The group with the highest labor force participation rate are those with the educational attainment of bachelor's degree or higher, with 89.3% or 183 individuals in the labor force. Within the labor force, individuals with college / associate degree education have the highest percentage of unemployment, with 19.2% or 10 of them being unemployed.
| Educational Attainment | In Labor Force | Unemployed |
| Less than High School | 3 (10.3%) | 0 (0.0%) |
| High School Diploma | 146 (64.0%) | 0 (0.0%) |
| College / Associate Degree | 52 (58.4%) | 17 (19.2%) |
| Bachelor's Degree or higher | 183 (89.3%) | 12 (6.0%) |
| Total | 384 (69.7%) | 30 (5.5%) |
Employment Occupations by Sex in Roslyn
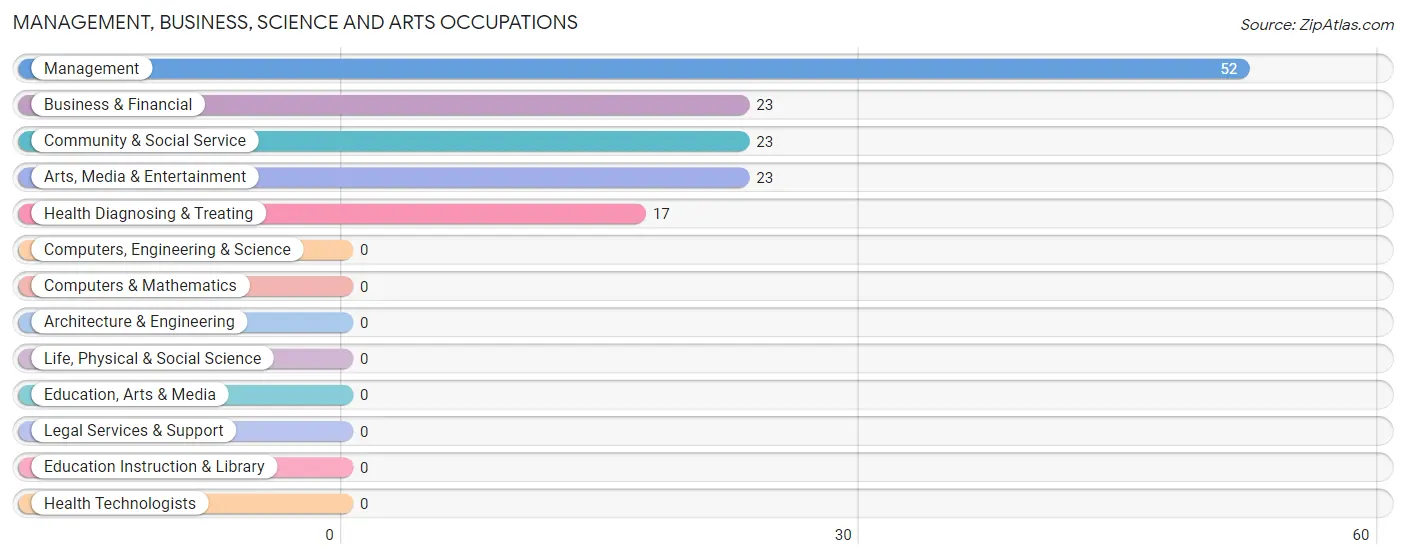
Management, Business, Science and Arts Occupations
The most common Management, Business, Science and Arts occupations in Roslyn are Management (52 | 12.9%), Business & Financial (23 | 5.7%), Community & Social Service (23 | 5.7%), Arts, Media & Entertainment (23 | 5.7%), and Health Diagnosing & Treating (17 | 4.2%).
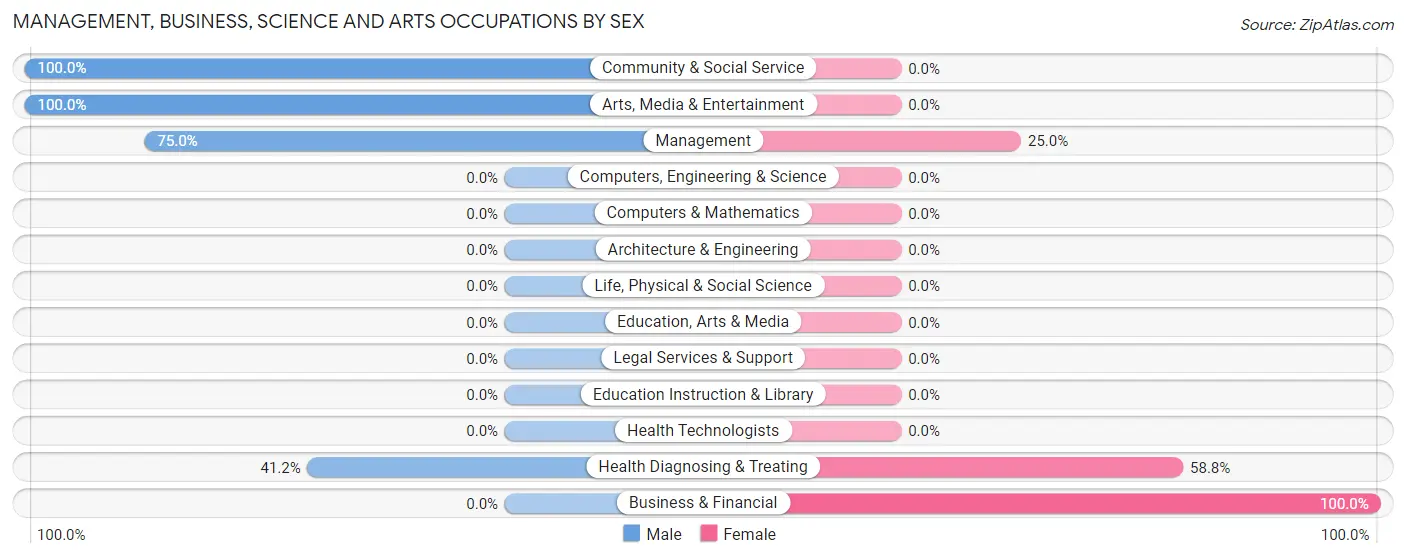
Management, Business, Science and Arts Occupations by Sex
Within the Management, Business, Science and Arts occupations in Roslyn, the most male-oriented occupations are Community & Social Service (100.0%), Arts, Media & Entertainment (100.0%), and Management (75.0%), while the most female-oriented occupations are Business & Financial (100.0%), Health Diagnosing & Treating (58.8%), and Management (25.0%).
| Occupation | Male | Female |
| Management | 39 (75.0%) | 13 (25.0%) |
| Business & Financial | 0 (0.0%) | 23 (100.0%) |
| Computers, Engineering & Science | 0 (0.0%) | 0 (0.0%) |
| Computers & Mathematics | 0 (0.0%) | 0 (0.0%) |
| Architecture & Engineering | 0 (0.0%) | 0 (0.0%) |
| Life, Physical & Social Science | 0 (0.0%) | 0 (0.0%) |
| Community & Social Service | 23 (100.0%) | 0 (0.0%) |
| Education, Arts & Media | 0 (0.0%) | 0 (0.0%) |
| Legal Services & Support | 0 (0.0%) | 0 (0.0%) |
| Education Instruction & Library | 0 (0.0%) | 0 (0.0%) |
| Arts, Media & Entertainment | 23 (100.0%) | 0 (0.0%) |
| Health Diagnosing & Treating | 7 (41.2%) | 10 (58.8%) |
| Health Technologists | 0 (0.0%) | 0 (0.0%) |
| Total (Category) | 69 (60.0%) | 46 (40.0%) |
| Total (Overall) | 272 (67.5%) | 131 (32.5%) |
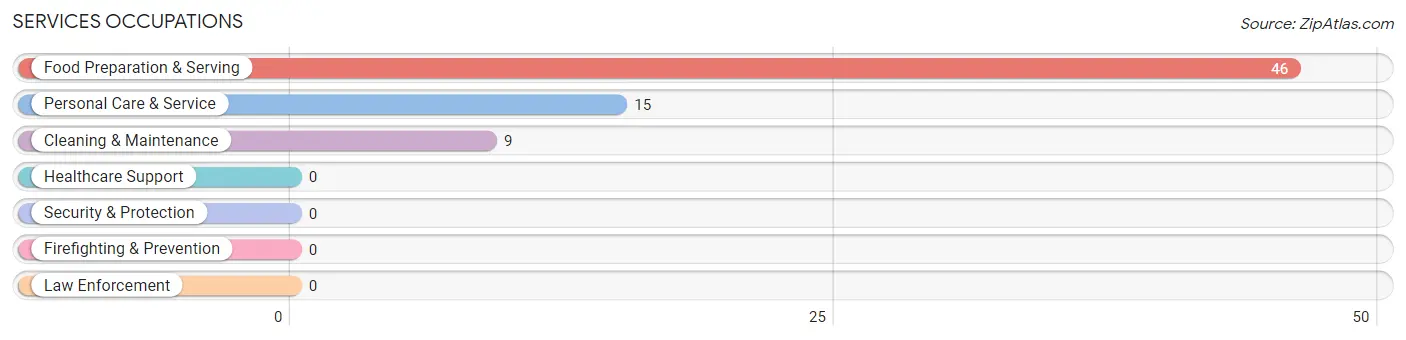
Services Occupations
The most common Services occupations in Roslyn are Food Preparation & Serving (46 | 11.4%), Personal Care & Service (15 | 3.7%), and Cleaning & Maintenance (9 | 2.2%).
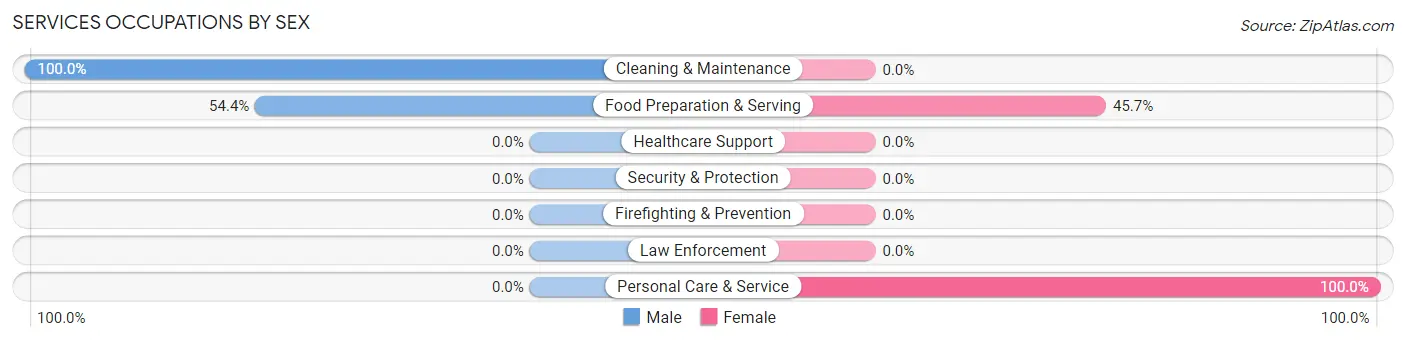
Services Occupations by Sex
Within the Services occupations in Roslyn, the most male-oriented occupations are Cleaning & Maintenance (100.0%), and Food Preparation & Serving (54.3%), while the most female-oriented occupations are Personal Care & Service (100.0%), and Food Preparation & Serving (45.7%).
| Occupation | Male | Female |
| Healthcare Support | 0 (0.0%) | 0 (0.0%) |
| Security & Protection | 0 (0.0%) | 0 (0.0%) |
| Firefighting & Prevention | 0 (0.0%) | 0 (0.0%) |
| Law Enforcement | 0 (0.0%) | 0 (0.0%) |
| Food Preparation & Serving | 25 (54.3%) | 21 (45.7%) |
| Cleaning & Maintenance | 9 (100.0%) | 0 (0.0%) |
| Personal Care & Service | 0 (0.0%) | 15 (100.0%) |
| Total (Category) | 34 (48.6%) | 36 (51.4%) |
| Total (Overall) | 272 (67.5%) | 131 (32.5%) |
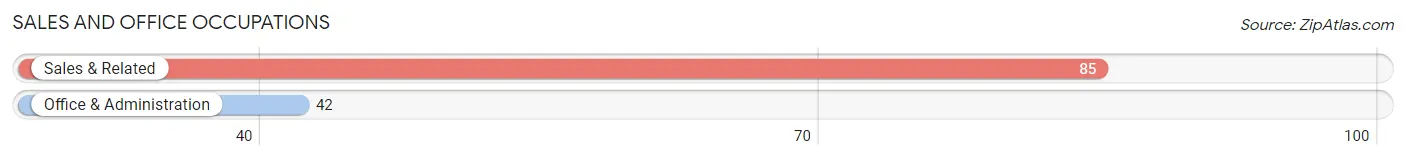
Sales and Office Occupations
The most common Sales and Office occupations in Roslyn are Sales & Related (85 | 21.1%), and Office & Administration (42 | 10.4%).
Sales and Office Occupations by Sex
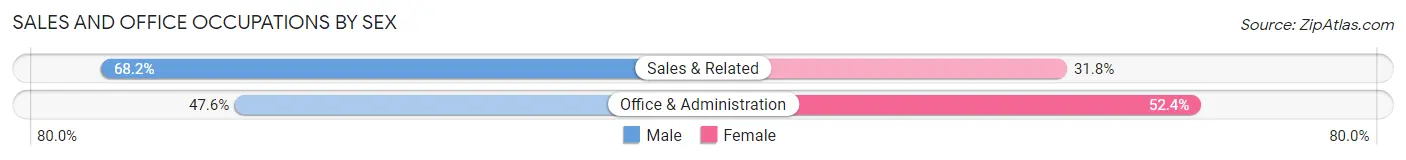
| Occupation | Male | Female |
| Sales & Related | 58 (68.2%) | 27 (31.8%) |
| Office & Administration | 20 (47.6%) | 22 (52.4%) |
| Total (Category) | 78 (61.4%) | 49 (38.6%) |
| Total (Overall) | 272 (67.5%) | 131 (32.5%) |
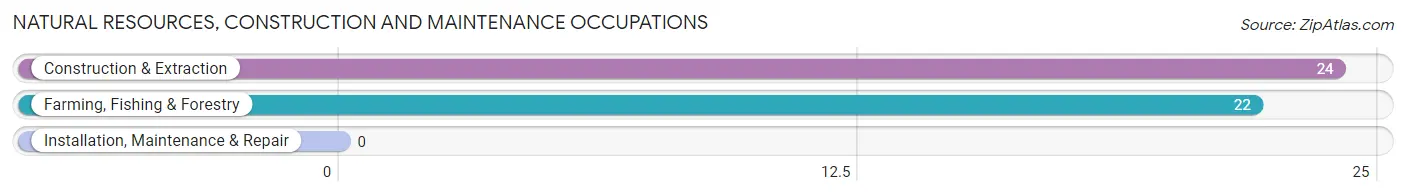
Natural Resources, Construction and Maintenance Occupations
The most common Natural Resources, Construction and Maintenance occupations in Roslyn are Construction & Extraction (24 | 6.0%), and Farming, Fishing & Forestry (22 | 5.5%).
Natural Resources, Construction and Maintenance Occupations by Sex
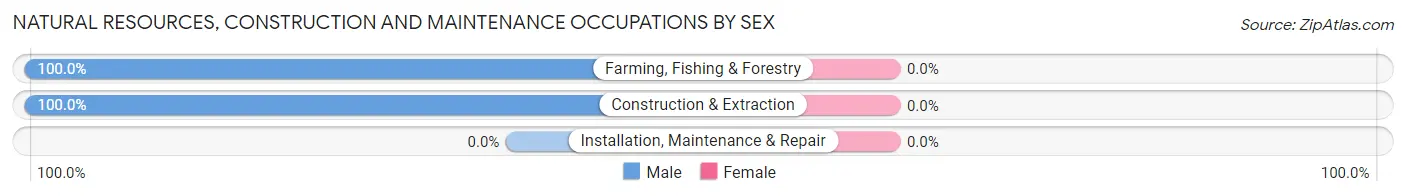
| Occupation | Male | Female |
| Farming, Fishing & Forestry | 22 (100.0%) | 0 (0.0%) |
| Construction & Extraction | 24 (100.0%) | 0 (0.0%) |
| Installation, Maintenance & Repair | 0 (0.0%) | 0 (0.0%) |
| Total (Category) | 46 (100.0%) | 0 (0.0%) |
| Total (Overall) | 272 (67.5%) | 131 (32.5%) |
Production, Transportation and Moving Occupations
The most common Production, Transportation and Moving occupations in Roslyn are Material Moving (23 | 5.7%), and Production (22 | 5.5%).
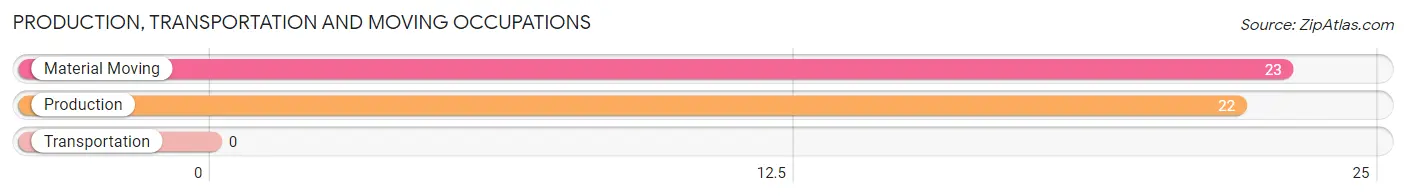
Production, Transportation and Moving Occupations by Sex
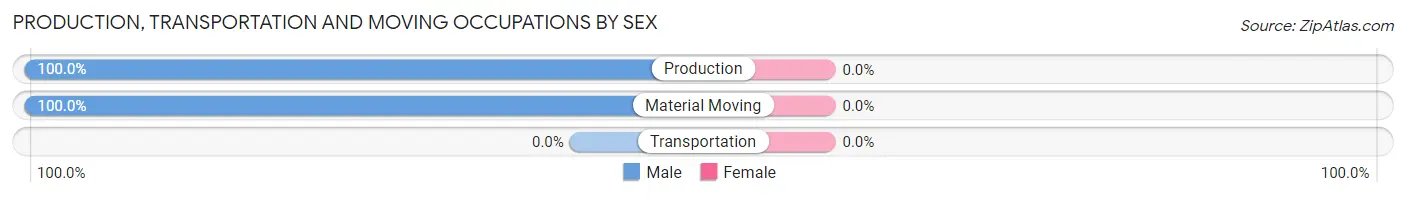
| Occupation | Male | Female |
| Production | 22 (100.0%) | 0 (0.0%) |
| Transportation | 0 (0.0%) | 0 (0.0%) |
| Material Moving | 23 (100.0%) | 0 (0.0%) |
| Total (Category) | 45 (100.0%) | 0 (0.0%) |
| Total (Overall) | 272 (67.5%) | 131 (32.5%) |
Employment Industries by Sex in Roslyn
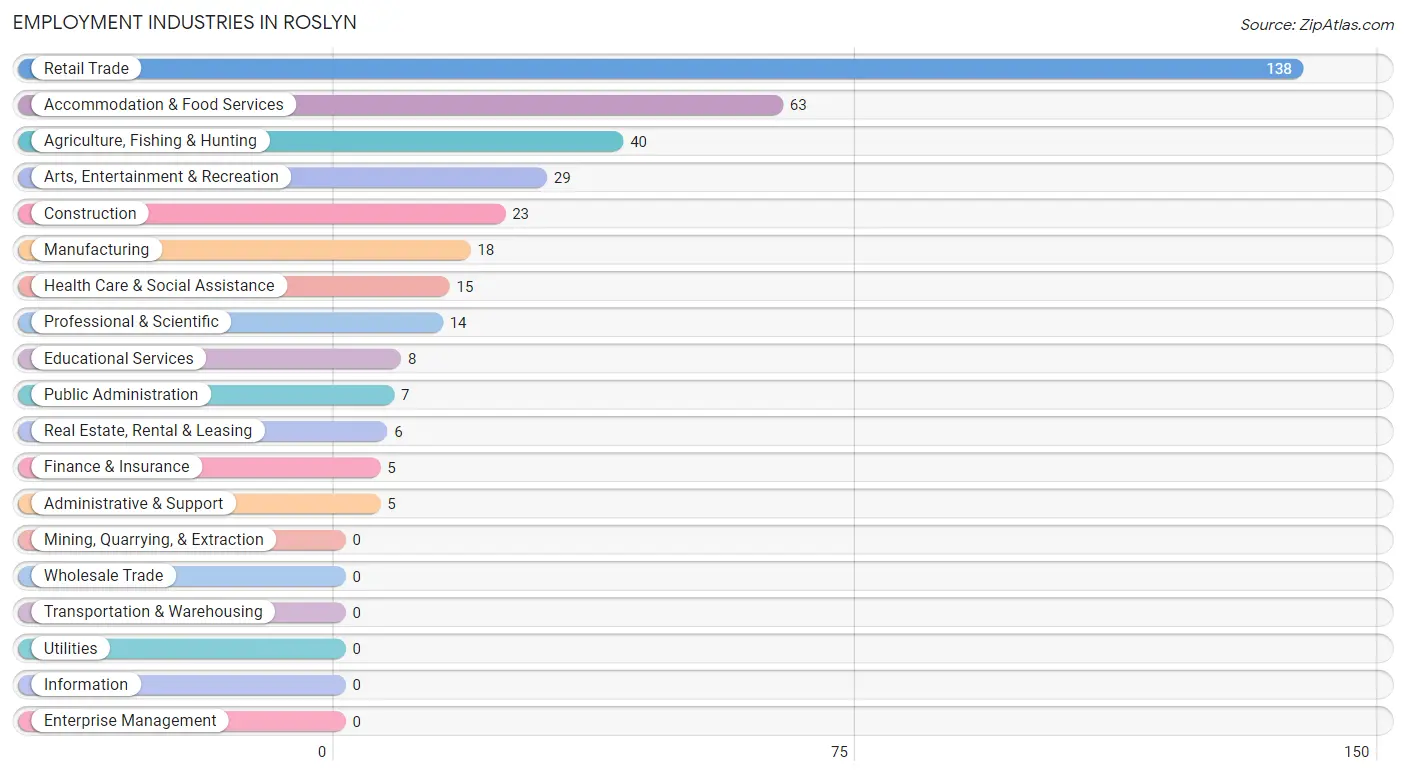
Employment Industries in Roslyn
The major employment industries in Roslyn include Retail Trade (138 | 34.2%), Accommodation & Food Services (63 | 15.6%), Agriculture, Fishing & Hunting (40 | 9.9%), Arts, Entertainment & Recreation (29 | 7.2%), and Construction (23 | 5.7%).
Employment Industries by Sex in Roslyn
The Roslyn industries that see more men than women are Agriculture, Fishing & Hunting (100.0%), Construction (100.0%), and Manufacturing (100.0%), whereas the industries that tend to have a higher number of women are Finance & Insurance (100.0%), Real Estate, Rental & Leasing (100.0%), and Professional & Scientific (100.0%).
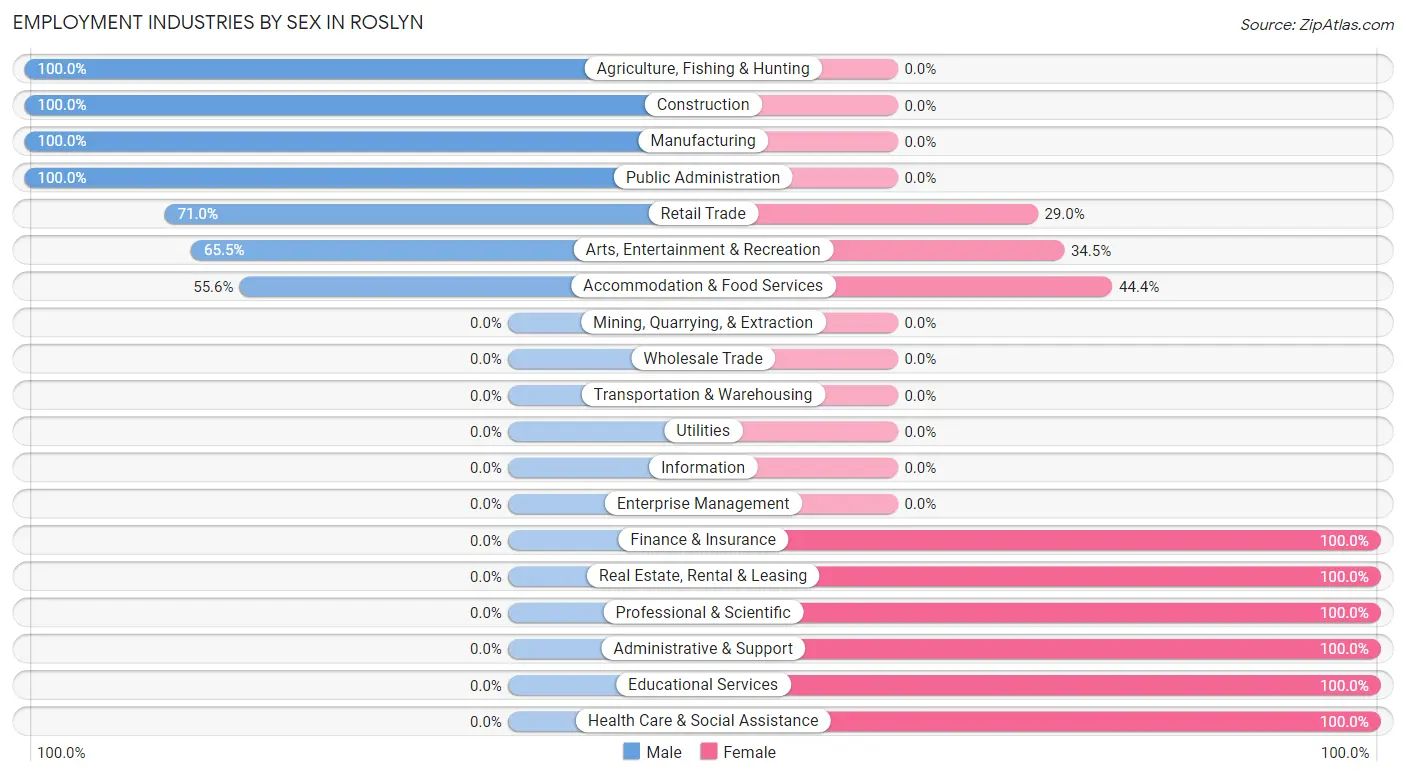
| Industry | Male | Female |
| Agriculture, Fishing & Hunting | 40 (100.0%) | 0 (0.0%) |
| Mining, Quarrying, & Extraction | 0 (0.0%) | 0 (0.0%) |
| Construction | 23 (100.0%) | 0 (0.0%) |
| Manufacturing | 18 (100.0%) | 0 (0.0%) |
| Wholesale Trade | 0 (0.0%) | 0 (0.0%) |
| Retail Trade | 98 (71.0%) | 40 (29.0%) |
| Transportation & Warehousing | 0 (0.0%) | 0 (0.0%) |
| Utilities | 0 (0.0%) | 0 (0.0%) |
| Information | 0 (0.0%) | 0 (0.0%) |
| Finance & Insurance | 0 (0.0%) | 5 (100.0%) |
| Real Estate, Rental & Leasing | 0 (0.0%) | 6 (100.0%) |
| Professional & Scientific | 0 (0.0%) | 14 (100.0%) |
| Enterprise Management | 0 (0.0%) | 0 (0.0%) |
| Administrative & Support | 0 (0.0%) | 5 (100.0%) |
| Educational Services | 0 (0.0%) | 8 (100.0%) |
| Health Care & Social Assistance | 0 (0.0%) | 15 (100.0%) |
| Arts, Entertainment & Recreation | 19 (65.5%) | 10 (34.5%) |
| Accommodation & Food Services | 35 (55.6%) | 28 (44.4%) |
| Public Administration | 7 (100.0%) | 0 (0.0%) |
| Total | 272 (67.5%) | 131 (32.5%) |
Education in Roslyn
School Enrollment in Roslyn
The most common levels of schooling among the 140 students in Roslyn are high school (50 | 35.7%), middle school (28 | 20.0%), and kindergarten (16 | 11.4%).
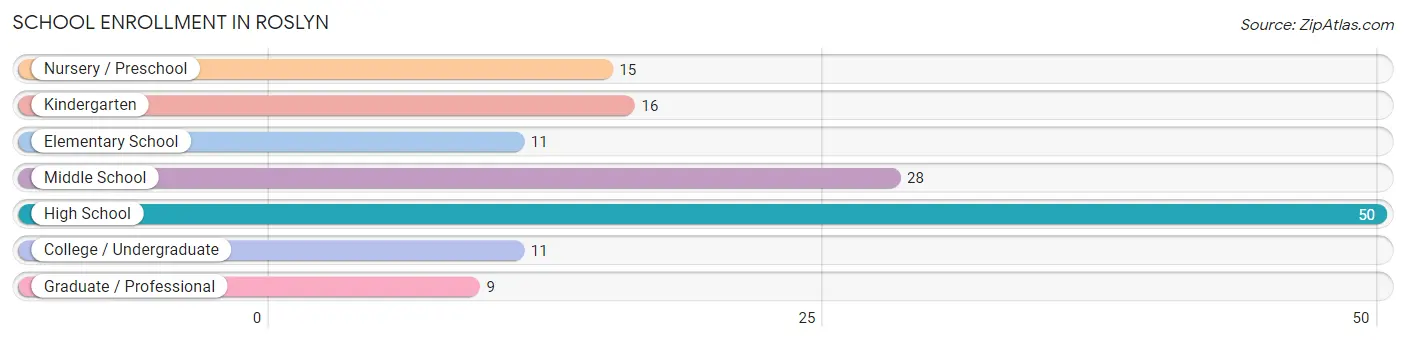
| School Level | # Students | % Students |
| Nursery / Preschool | 15 | 10.7% |
| Kindergarten | 16 | 11.4% |
| Elementary School | 11 | 7.9% |
| Middle School | 28 | 20.0% |
| High School | 50 | 35.7% |
| College / Undergraduate | 11 | 7.9% |
| Graduate / Professional | 9 | 6.4% |
| Total | 140 | 100.0% |
School Enrollment by Age by Funding Source in Roslyn
Out of a total of 140 students who are enrolled in schools in Roslyn, 9 (6.4%) attend a private institution, while the remaining 131 (93.6%) are enrolled in public schools. The age group of 35 years and over has the highest likelihood of being enrolled in private schools, with 9 (45.0% in the age bracket) enrolled. Conversely, the age group of 3 to 4 year olds has the lowest likelihood of being enrolled in a private school, with 15 (100.0% in the age bracket) attending a public institution.
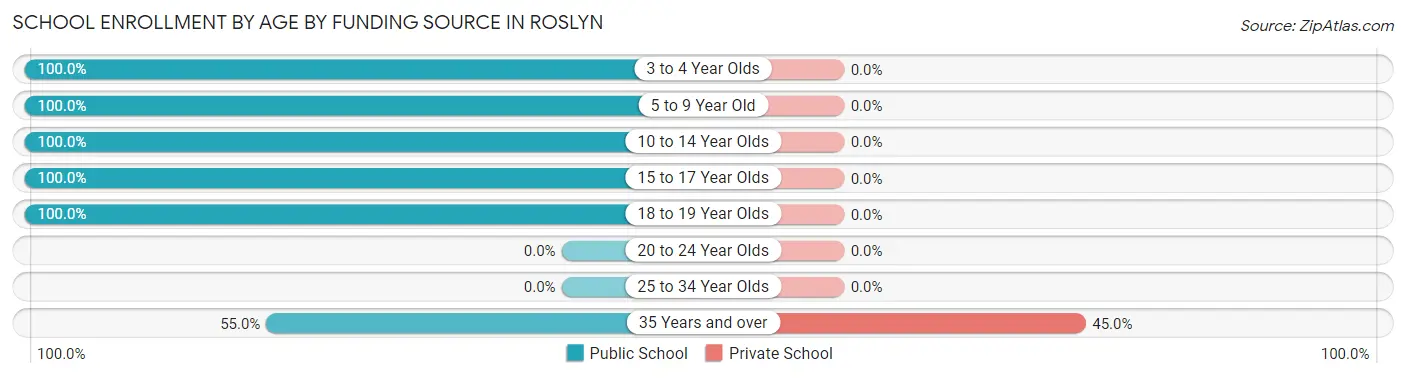
| Age Bracket | Public School | Private School |
| 3 to 4 Year Olds | 15 (100.0%) | 0 (0.0%) |
| 5 to 9 Year Old | 16 (100.0%) | 0 (0.0%) |
| 10 to 14 Year Olds | 48 (100.0%) | 0 (0.0%) |
| 15 to 17 Year Olds | 32 (100.0%) | 0 (0.0%) |
| 18 to 19 Year Olds | 9 (100.0%) | 0 (0.0%) |
| 20 to 24 Year Olds | 0 (0.0%) | 0 (0.0%) |
| 25 to 34 Year Olds | 0 (0.0%) | 0 (0.0%) |
| 35 Years and over | 11 (55.0%) | 9 (45.0%) |
| Total | 131 (93.6%) | 9 (6.4%) |
Educational Attainment by Field of Study in Roslyn
Business (77 | 33.1%), bio, nature & agricultural (76 | 32.6%), social sciences (27 | 11.6%), arts & humanities (21 | 9.0%), and visual & performing arts (13 | 5.6%) are the most common fields of study among 233 individuals in Roslyn who have obtained a bachelor's degree or higher.
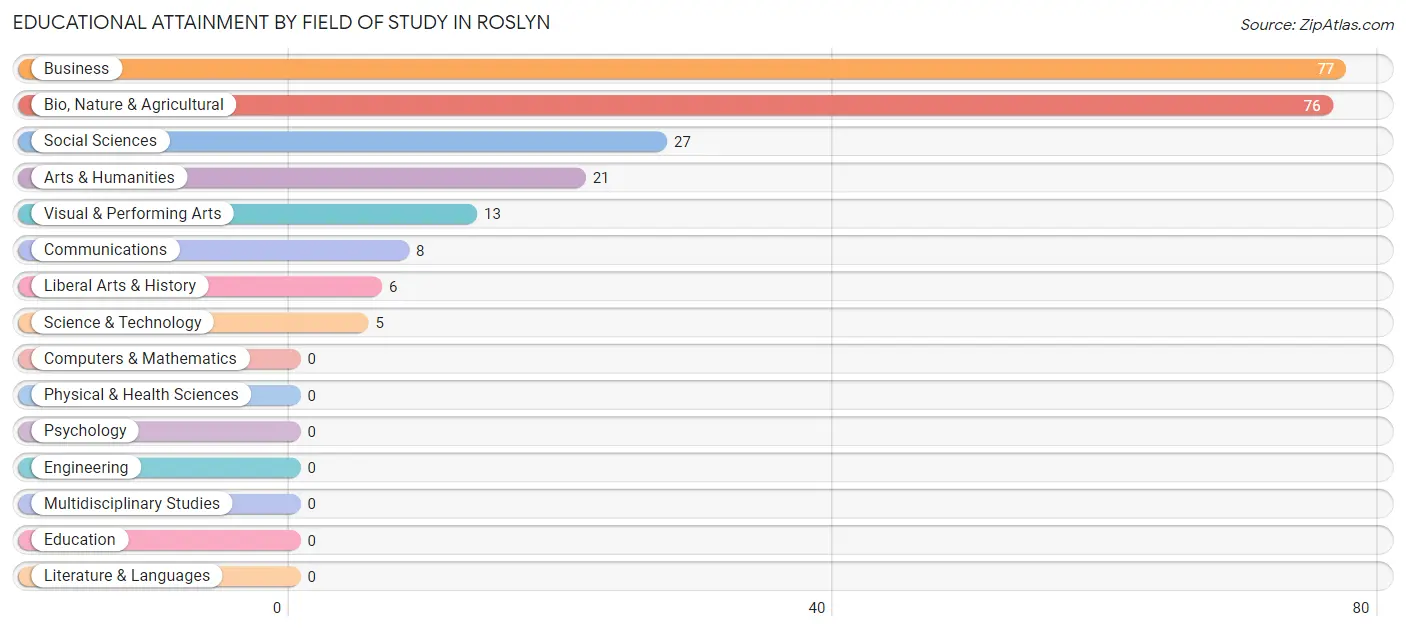
| Field of Study | # Graduates | % Graduates |
| Computers & Mathematics | 0 | 0.0% |
| Bio, Nature & Agricultural | 76 | 32.6% |
| Physical & Health Sciences | 0 | 0.0% |
| Psychology | 0 | 0.0% |
| Social Sciences | 27 | 11.6% |
| Engineering | 0 | 0.0% |
| Multidisciplinary Studies | 0 | 0.0% |
| Science & Technology | 5 | 2.1% |
| Business | 77 | 33.1% |
| Education | 0 | 0.0% |
| Literature & Languages | 0 | 0.0% |
| Liberal Arts & History | 6 | 2.6% |
| Visual & Performing Arts | 13 | 5.6% |
| Communications | 8 | 3.4% |
| Arts & Humanities | 21 | 9.0% |
| Total | 233 | 100.0% |
Transportation & Commute in Roslyn
Vehicle Availability by Sex in Roslyn
The most prevalent vehicle ownership categories in Roslyn are males with 2 vehicles (103, accounting for 38.6%) and females with 2 vehicles (24, making up 97.2%).
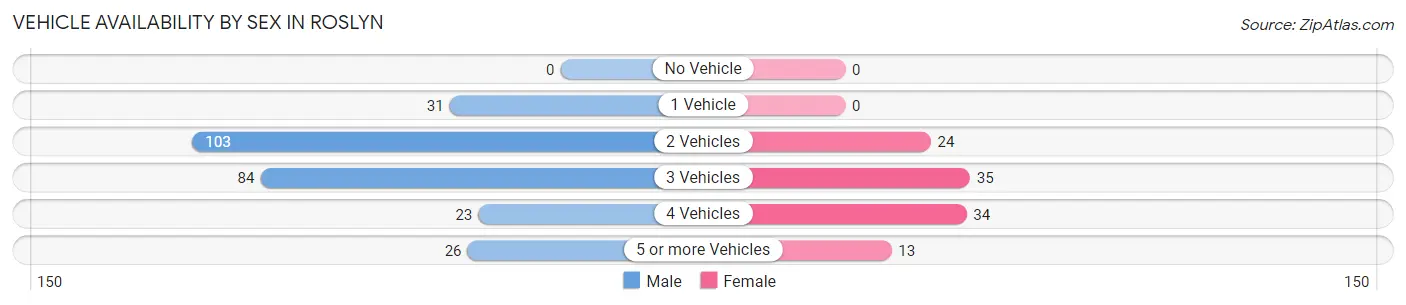
| Vehicles Available | Male | Female |
| No Vehicle | 0 (0.0%) | 0 (0.0%) |
| 1 Vehicle | 31 (11.6%) | 0 (0.0%) |
| 2 Vehicles | 103 (38.6%) | 24 (22.6%) |
| 3 Vehicles | 84 (31.5%) | 35 (33.0%) |
| 4 Vehicles | 23 (8.6%) | 34 (32.1%) |
| 5 or more Vehicles | 26 (9.7%) | 13 (12.3%) |
| Total | 267 (100.0%) | 106 (100.0%) |
Commute Time in Roslyn
The most frequently occuring commute durations in Roslyn are 10 to 14 minutes (91 commuters, 27.1%), less than 5 minutes (69 commuters, 20.5%), and 15 to 19 minutes (47 commuters, 14.0%).
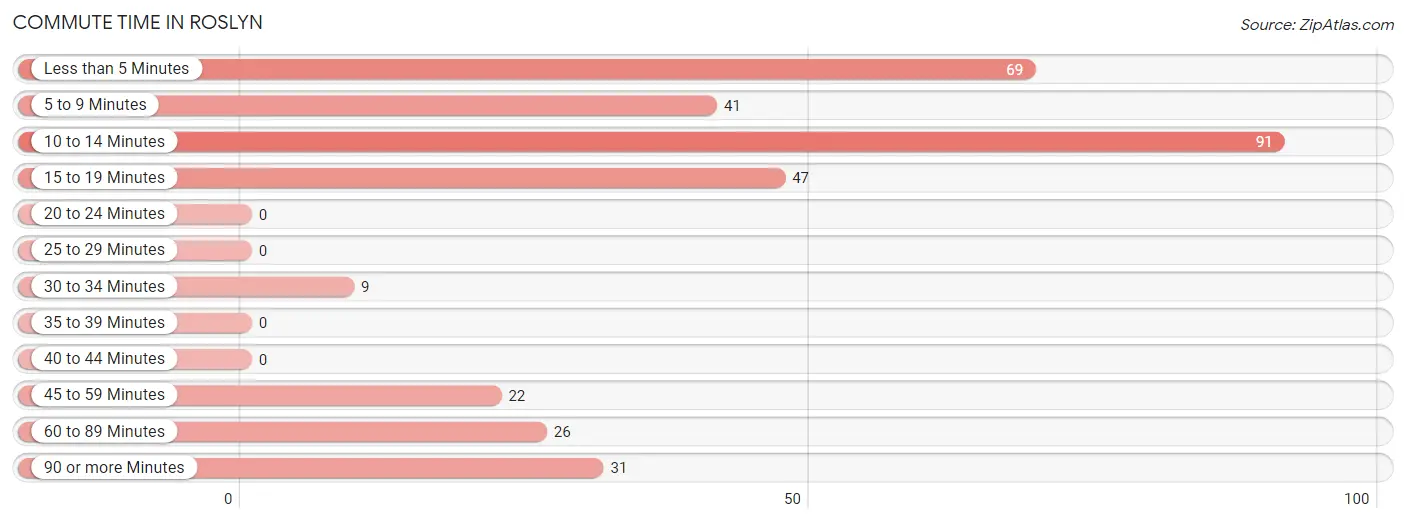
| Commute Time | # Commuters | % Commuters |
| Less than 5 Minutes | 69 | 20.5% |
| 5 to 9 Minutes | 41 | 12.2% |
| 10 to 14 Minutes | 91 | 27.1% |
| 15 to 19 Minutes | 47 | 14.0% |
| 20 to 24 Minutes | 0 | 0.0% |
| 25 to 29 Minutes | 0 | 0.0% |
| 30 to 34 Minutes | 9 | 2.7% |
| 35 to 39 Minutes | 0 | 0.0% |
| 40 to 44 Minutes | 0 | 0.0% |
| 45 to 59 Minutes | 22 | 6.6% |
| 60 to 89 Minutes | 26 | 7.7% |
| 90 or more Minutes | 31 | 9.2% |
Commute Time by Sex in Roslyn
The most common commute times in Roslyn are 10 to 14 minutes (64 commuters, 25.5%) for males and less than 5 minutes (32 commuters, 37.7%) for females.
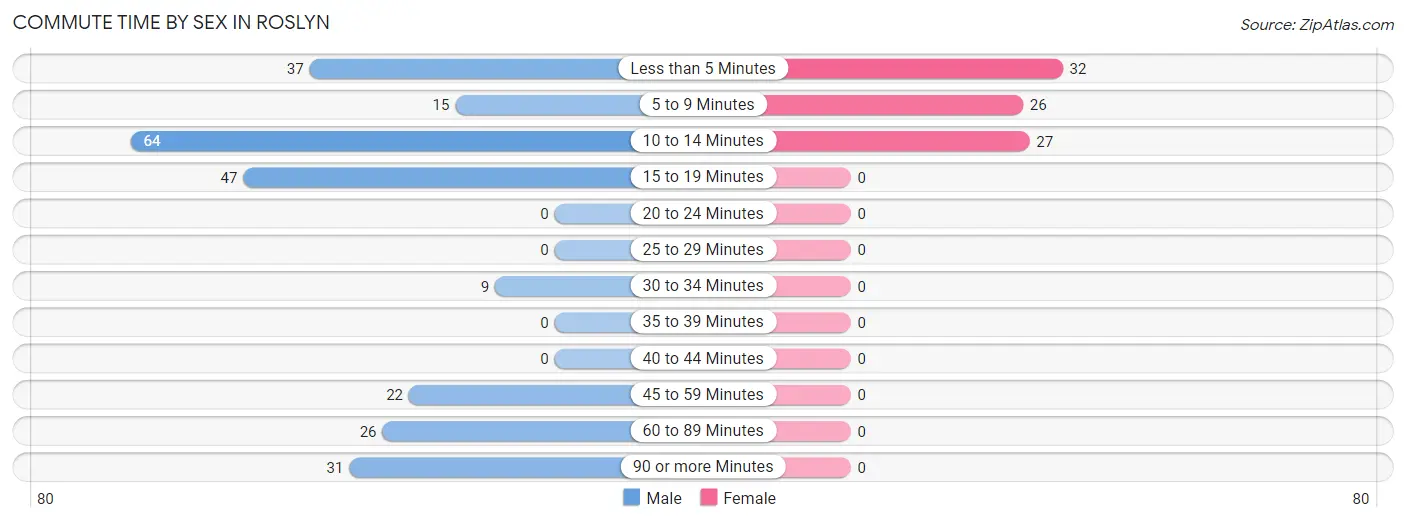
| Commute Time | Male | Female |
| Less than 5 Minutes | 37 (14.7%) | 32 (37.7%) |
| 5 to 9 Minutes | 15 (6.0%) | 26 (30.6%) |
| 10 to 14 Minutes | 64 (25.5%) | 27 (31.8%) |
| 15 to 19 Minutes | 47 (18.7%) | 0 (0.0%) |
| 20 to 24 Minutes | 0 (0.0%) | 0 (0.0%) |
| 25 to 29 Minutes | 0 (0.0%) | 0 (0.0%) |
| 30 to 34 Minutes | 9 (3.6%) | 0 (0.0%) |
| 35 to 39 Minutes | 0 (0.0%) | 0 (0.0%) |
| 40 to 44 Minutes | 0 (0.0%) | 0 (0.0%) |
| 45 to 59 Minutes | 22 (8.8%) | 0 (0.0%) |
| 60 to 89 Minutes | 26 (10.4%) | 0 (0.0%) |
| 90 or more Minutes | 31 (12.3%) | 0 (0.0%) |
Time of Departure to Work by Sex in Roslyn
The most frequent times of departure to work in Roslyn are 6:30 AM to 6:59 AM (60, 23.9%) for males and 11:00 AM to 11:59 AM (22, 25.9%) for females.
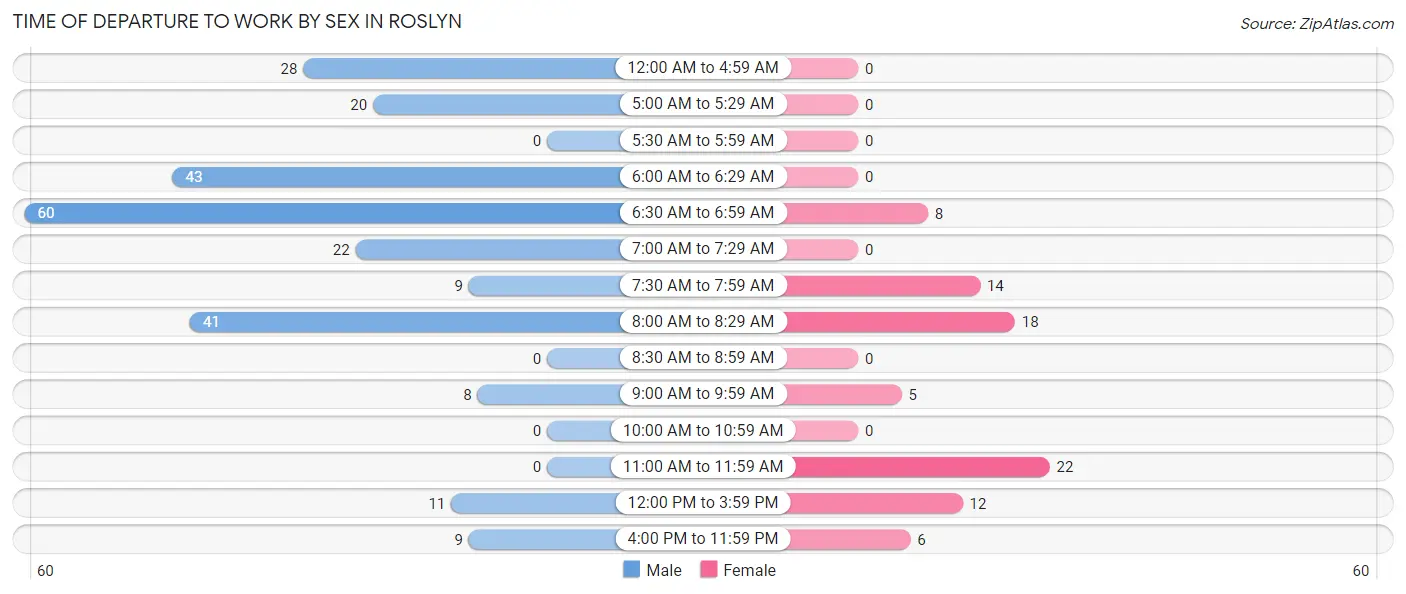
| Time of Departure | Male | Female |
| 12:00 AM to 4:59 AM | 28 (11.2%) | 0 (0.0%) |
| 5:00 AM to 5:29 AM | 20 (8.0%) | 0 (0.0%) |
| 5:30 AM to 5:59 AM | 0 (0.0%) | 0 (0.0%) |
| 6:00 AM to 6:29 AM | 43 (17.1%) | 0 (0.0%) |
| 6:30 AM to 6:59 AM | 60 (23.9%) | 8 (9.4%) |
| 7:00 AM to 7:29 AM | 22 (8.8%) | 0 (0.0%) |
| 7:30 AM to 7:59 AM | 9 (3.6%) | 14 (16.5%) |
| 8:00 AM to 8:29 AM | 41 (16.3%) | 18 (21.2%) |
| 8:30 AM to 8:59 AM | 0 (0.0%) | 0 (0.0%) |
| 9:00 AM to 9:59 AM | 8 (3.2%) | 5 (5.9%) |
| 10:00 AM to 10:59 AM | 0 (0.0%) | 0 (0.0%) |
| 11:00 AM to 11:59 AM | 0 (0.0%) | 22 (25.9%) |
| 12:00 PM to 3:59 PM | 11 (4.4%) | 12 (14.1%) |
| 4:00 PM to 11:59 PM | 9 (3.6%) | 6 (7.1%) |
| Total | 251 (100.0%) | 85 (100.0%) |
Housing Occupancy in Roslyn
Occupancy by Ownership in Roslyn
Of the total 378 dwellings in Roslyn, owner-occupied units account for 244 (64.5%), while renter-occupied units make up 134 (35.4%).
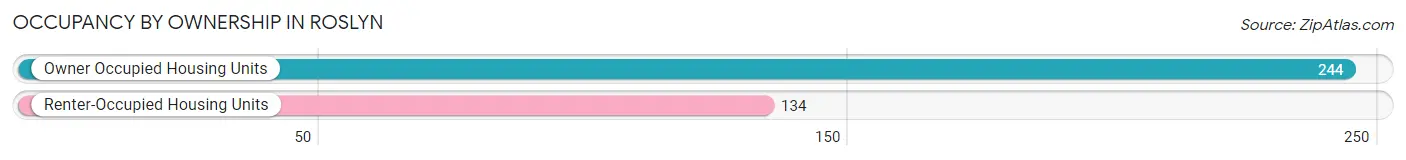
| Occupancy | # Housing Units | % Housing Units |
| Owner Occupied Housing Units | 244 | 64.5% |
| Renter-Occupied Housing Units | 134 | 35.4% |
| Total Occupied Housing Units | 378 | 100.0% |
Occupancy by Household Size in Roslyn
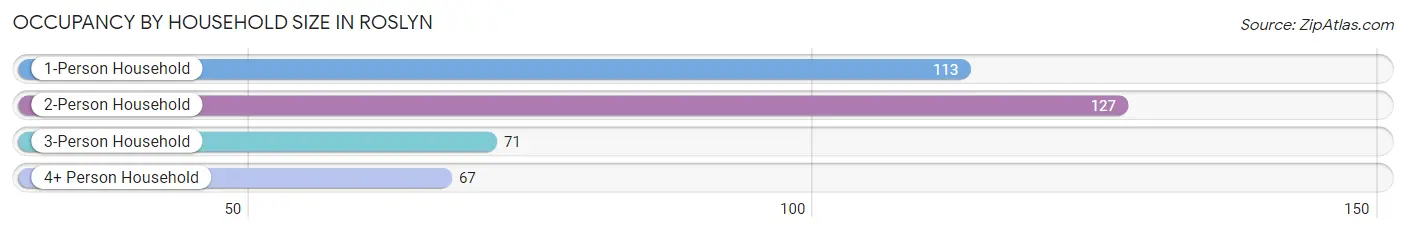
| Household Size | # Housing Units | % Housing Units |
| 1-Person Household | 113 | 29.9% |
| 2-Person Household | 127 | 33.6% |
| 3-Person Household | 71 | 18.8% |
| 4+ Person Household | 67 | 17.7% |
| Total Housing Units | 378 | 100.0% |
Occupancy by Ownership by Household Size in Roslyn
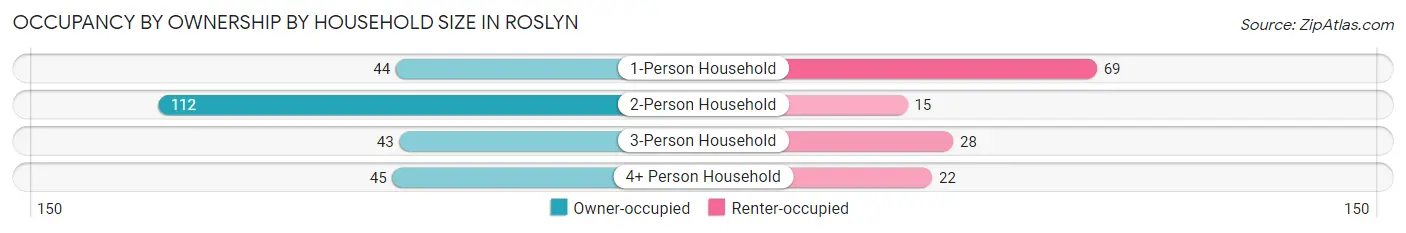
| Household Size | Owner-occupied | Renter-occupied |
| 1-Person Household | 44 (38.9%) | 69 (61.1%) |
| 2-Person Household | 112 (88.2%) | 15 (11.8%) |
| 3-Person Household | 43 (60.6%) | 28 (39.4%) |
| 4+ Person Household | 45 (67.2%) | 22 (32.8%) |
| Total Housing Units | 244 (64.5%) | 134 (35.4%) |
Occupancy by Educational Attainment in Roslyn
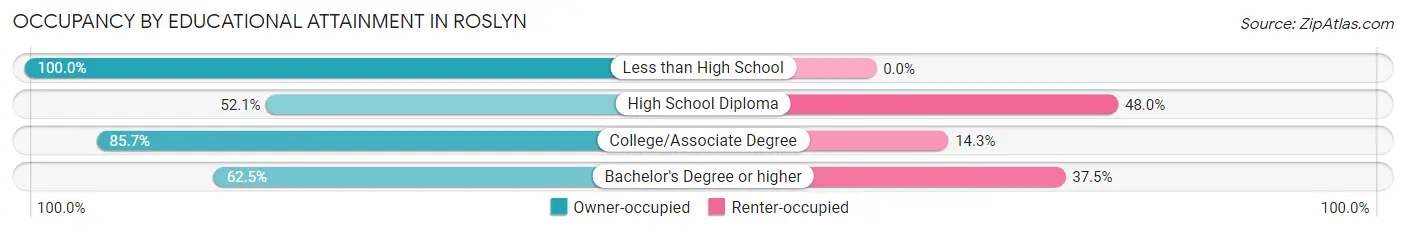
| Household Size | Owner-occupied | Renter-occupied |
| Less than High School | 18 (100.0%) | 0 (0.0%) |
| High School Diploma | 76 (52.0%) | 70 (47.9%) |
| College/Associate Degree | 60 (85.7%) | 10 (14.3%) |
| Bachelor's Degree or higher | 90 (62.5%) | 54 (37.5%) |
Occupancy by Age of Householder in Roslyn
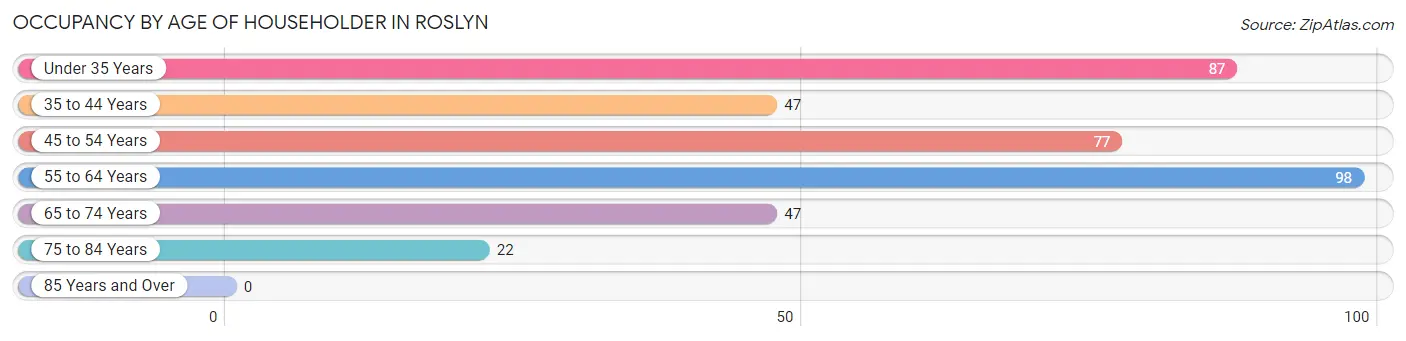
| Age Bracket | # Households | % Households |
| Under 35 Years | 87 | 23.0% |
| 35 to 44 Years | 47 | 12.4% |
| 45 to 54 Years | 77 | 20.4% |
| 55 to 64 Years | 98 | 25.9% |
| 65 to 74 Years | 47 | 12.4% |
| 75 to 84 Years | 22 | 5.8% |
| 85 Years and Over | 0 | 0.0% |
| Total | 378 | 100.0% |
Housing Finances in Roslyn
Median Income by Occupancy in Roslyn
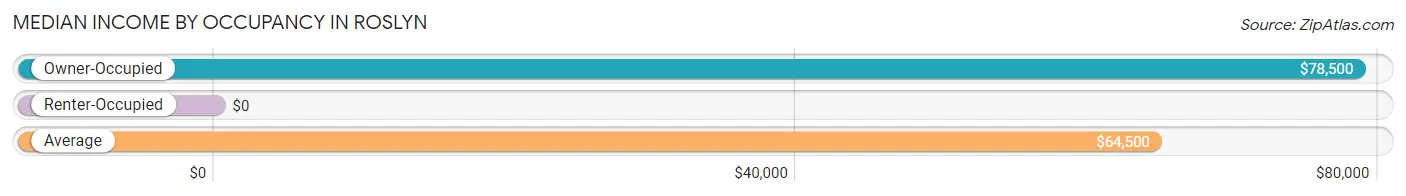
| Occupancy Type | # Households | Median Income |
| Owner-Occupied | 244 (64.5%) | $78,500 |
| Renter-Occupied | 134 (35.4%) | $0 |
| Average | 378 (100.0%) | $64,500 |
Occupancy by Householder Income Bracket in Roslyn
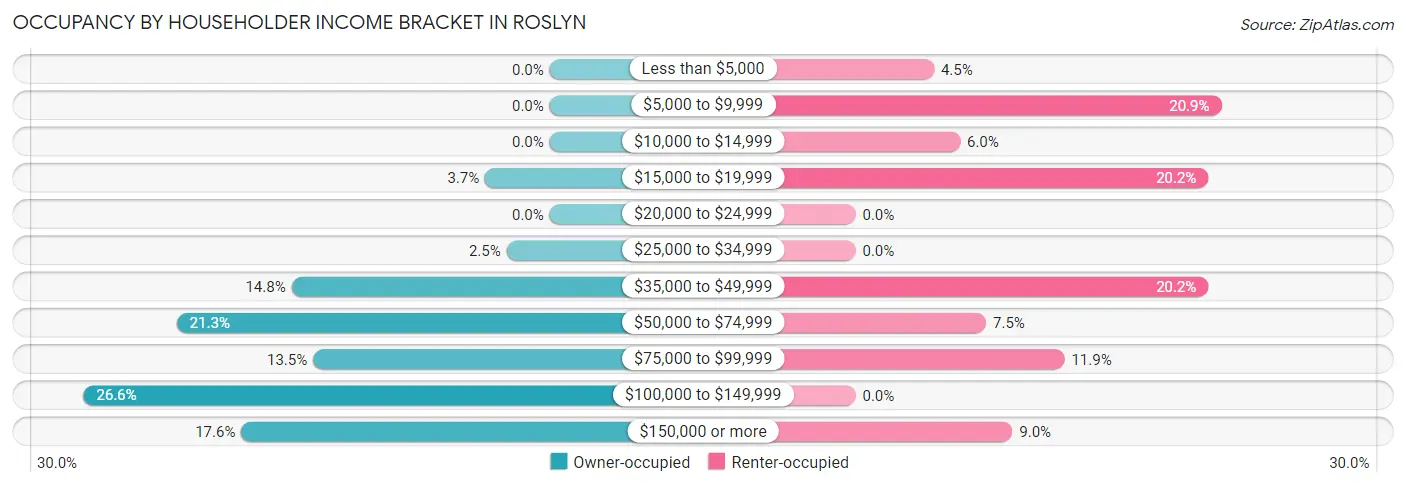
| Income Bracket | Owner-occupied | Renter-occupied |
| Less than $5,000 | 0 (0.0%) | 6 (4.5%) |
| $5,000 to $9,999 | 0 (0.0%) | 28 (20.9%) |
| $10,000 to $14,999 | 0 (0.0%) | 8 (6.0%) |
| $15,000 to $19,999 | 9 (3.7%) | 27 (20.2%) |
| $20,000 to $24,999 | 0 (0.0%) | 0 (0.0%) |
| $25,000 to $34,999 | 6 (2.5%) | 0 (0.0%) |
| $35,000 to $49,999 | 36 (14.7%) | 27 (20.2%) |
| $50,000 to $74,999 | 52 (21.3%) | 10 (7.5%) |
| $75,000 to $99,999 | 33 (13.5%) | 16 (11.9%) |
| $100,000 to $149,999 | 65 (26.6%) | 0 (0.0%) |
| $150,000 or more | 43 (17.6%) | 12 (9.0%) |
| Total | 244 (100.0%) | 134 (100.0%) |
Monthly Housing Cost Tiers in Roslyn
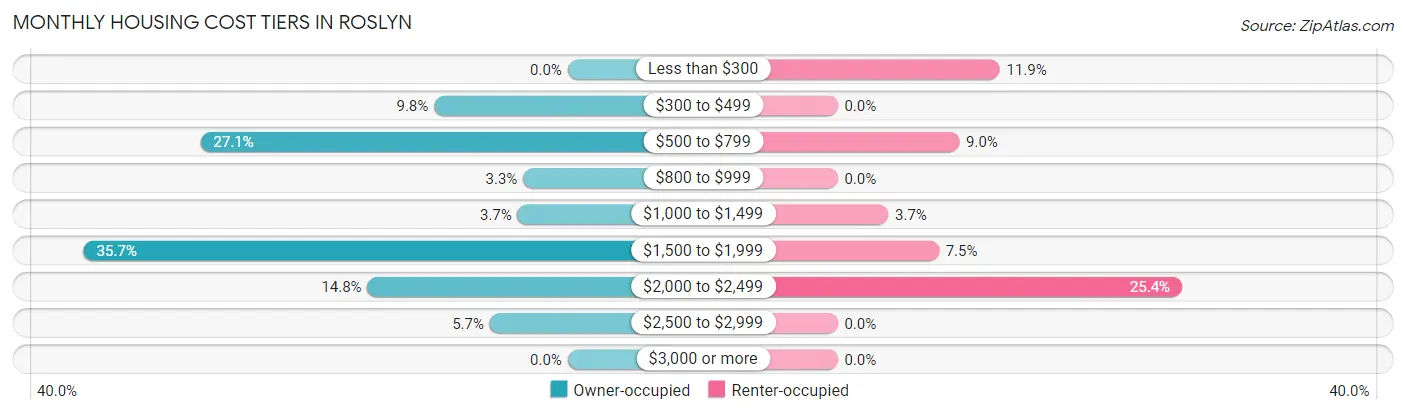
| Monthly Cost | Owner-occupied | Renter-occupied |
| Less than $300 | 0 (0.0%) | 16 (11.9%) |
| $300 to $499 | 24 (9.8%) | 0 (0.0%) |
| $500 to $799 | 66 (27.1%) | 12 (9.0%) |
| $800 to $999 | 8 (3.3%) | 0 (0.0%) |
| $1,000 to $1,499 | 9 (3.7%) | 5 (3.7%) |
| $1,500 to $1,999 | 87 (35.7%) | 10 (7.5%) |
| $2,000 to $2,499 | 36 (14.7%) | 34 (25.4%) |
| $2,500 to $2,999 | 14 (5.7%) | 0 (0.0%) |
| $3,000 or more | 0 (0.0%) | 0 (0.0%) |
| Total | 244 (100.0%) | 134 (100.0%) |
Physical Housing Characteristics in Roslyn
Housing Structures in Roslyn
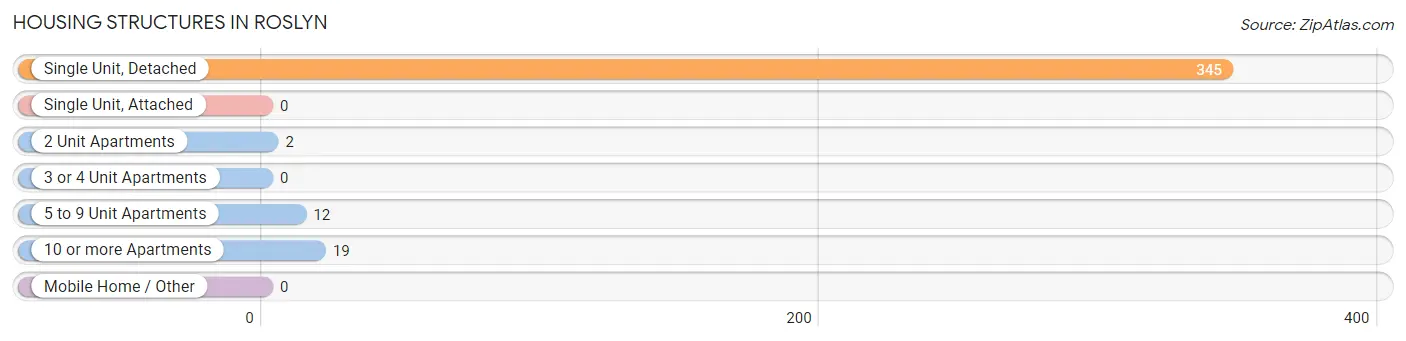
| Structure Type | # Housing Units | % Housing Units |
| Single Unit, Detached | 345 | 91.3% |
| Single Unit, Attached | 0 | 0.0% |
| 2 Unit Apartments | 2 | 0.5% |
| 3 or 4 Unit Apartments | 0 | 0.0% |
| 5 to 9 Unit Apartments | 12 | 3.2% |
| 10 or more Apartments | 19 | 5.0% |
| Mobile Home / Other | 0 | 0.0% |
| Total | 378 | 100.0% |
Housing Structures by Occupancy in Roslyn
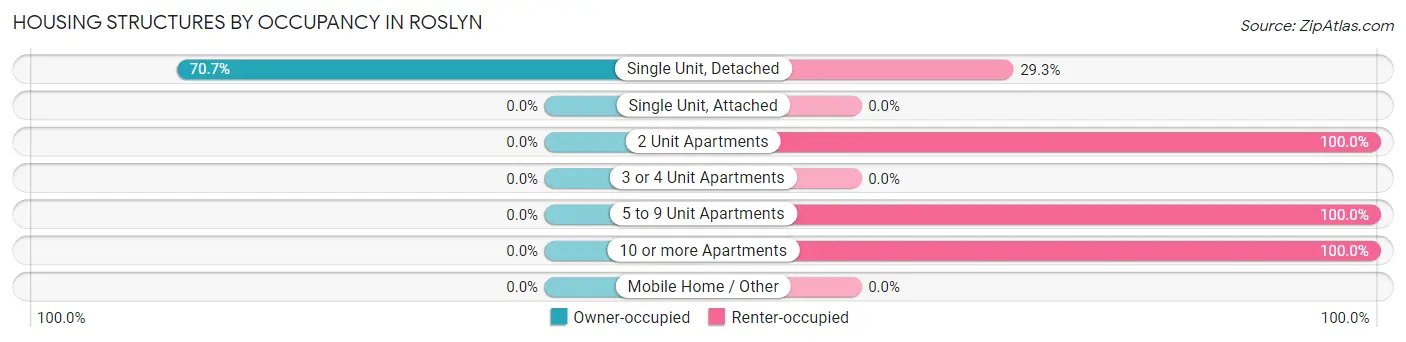
| Structure Type | Owner-occupied | Renter-occupied |
| Single Unit, Detached | 244 (70.7%) | 101 (29.3%) |
| Single Unit, Attached | 0 (0.0%) | 0 (0.0%) |
| 2 Unit Apartments | 0 (0.0%) | 2 (100.0%) |
| 3 or 4 Unit Apartments | 0 (0.0%) | 0 (0.0%) |
| 5 to 9 Unit Apartments | 0 (0.0%) | 12 (100.0%) |
| 10 or more Apartments | 0 (0.0%) | 19 (100.0%) |
| Mobile Home / Other | 0 (0.0%) | 0 (0.0%) |
| Total | 244 (64.5%) | 134 (35.4%) |
Housing Structures by Number of Rooms in Roslyn
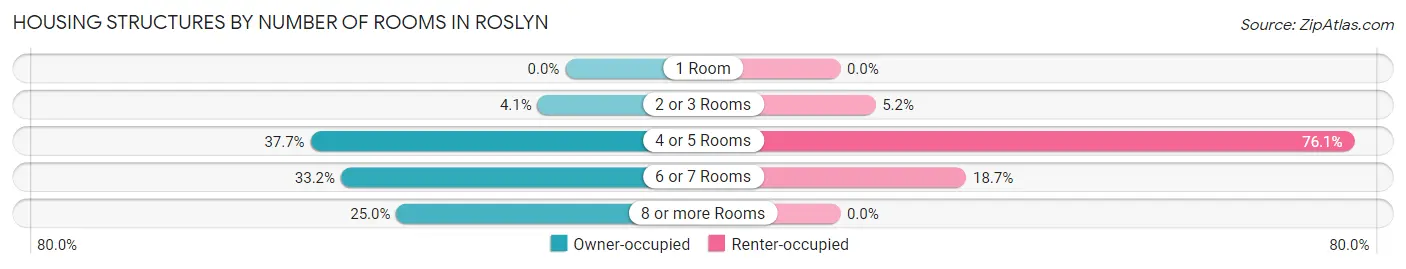
| Number of Rooms | Owner-occupied | Renter-occupied |
| 1 Room | 0 (0.0%) | 0 (0.0%) |
| 2 or 3 Rooms | 10 (4.1%) | 7 (5.2%) |
| 4 or 5 Rooms | 92 (37.7%) | 102 (76.1%) |
| 6 or 7 Rooms | 81 (33.2%) | 25 (18.7%) |
| 8 or more Rooms | 61 (25.0%) | 0 (0.0%) |
| Total | 244 (100.0%) | 134 (100.0%) |
Housing Structure by Heating Type in Roslyn
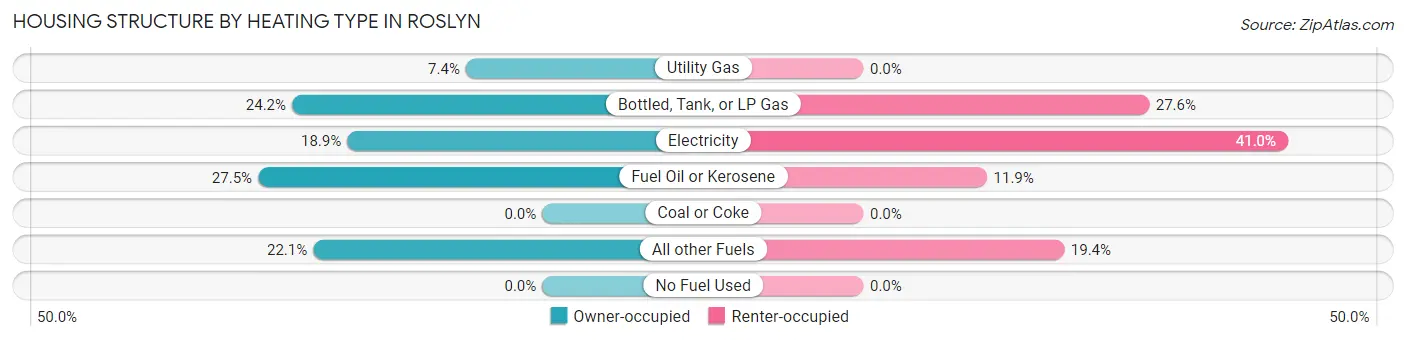
| Heating Type | Owner-occupied | Renter-occupied |
| Utility Gas | 18 (7.4%) | 0 (0.0%) |
| Bottled, Tank, or LP Gas | 59 (24.2%) | 37 (27.6%) |
| Electricity | 46 (18.9%) | 55 (41.0%) |
| Fuel Oil or Kerosene | 67 (27.5%) | 16 (11.9%) |
| Coal or Coke | 0 (0.0%) | 0 (0.0%) |
| All other Fuels | 54 (22.1%) | 26 (19.4%) |
| No Fuel Used | 0 (0.0%) | 0 (0.0%) |
| Total | 244 (100.0%) | 134 (100.0%) |
Household Vehicle Usage in Roslyn
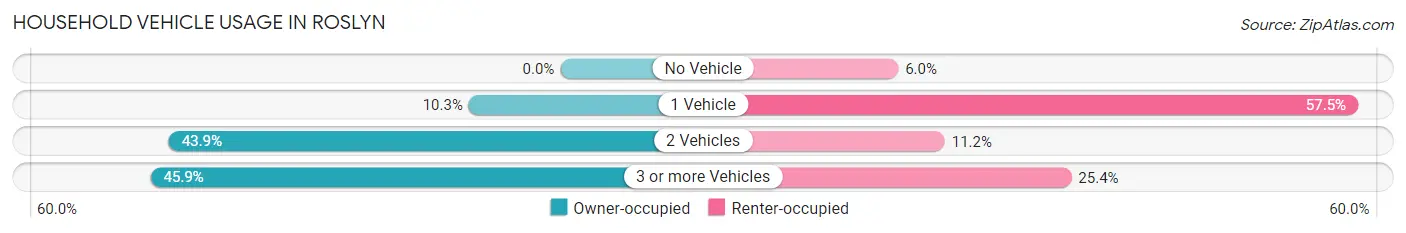
| Vehicles per Household | Owner-occupied | Renter-occupied |
| No Vehicle | 0 (0.0%) | 8 (6.0%) |
| 1 Vehicle | 25 (10.2%) | 77 (57.5%) |
| 2 Vehicles | 107 (43.9%) | 15 (11.2%) |
| 3 or more Vehicles | 112 (45.9%) | 34 (25.4%) |
| Total | 244 (100.0%) | 134 (100.0%) |
Real Estate & Mortgages in Roslyn
Real Estate and Mortgage Overview in Roslyn
| Characteristic | Without Mortgage | With Mortgage |
| Housing Units | 95 | 149 |
| Median Property Value | $476,700 | $418,900 |
| Median Household Income | $47,356 | $31 |
| Monthly Housing Costs | $556 | $0 |
| Real Estate Taxes | $1,803 | $0 |
Property Value by Mortgage Status in Roslyn
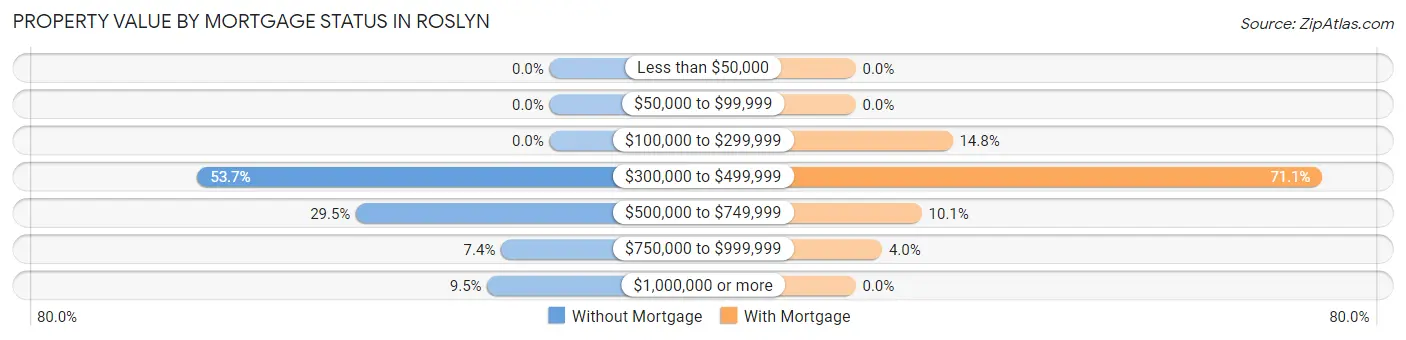
| Property Value | Without Mortgage | With Mortgage |
| Less than $50,000 | 0 (0.0%) | 0 (0.0%) |
| $50,000 to $99,999 | 0 (0.0%) | 0 (0.0%) |
| $100,000 to $299,999 | 0 (0.0%) | 22 (14.8%) |
| $300,000 to $499,999 | 51 (53.7%) | 106 (71.1%) |
| $500,000 to $749,999 | 28 (29.5%) | 15 (10.1%) |
| $750,000 to $999,999 | 7 (7.4%) | 6 (4.0%) |
| $1,000,000 or more | 9 (9.5%) | 0 (0.0%) |
| Total | 95 (100.0%) | 149 (100.0%) |
Household Income by Mortgage Status in Roslyn
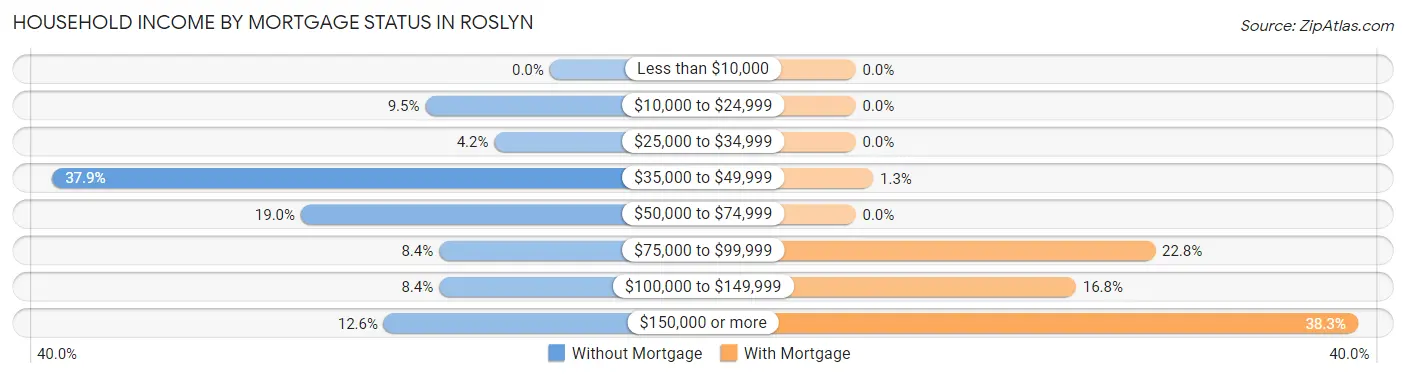
| Household Income | Without Mortgage | With Mortgage |
| Less than $10,000 | 0 (0.0%) | 0 (0.0%) |
| $10,000 to $24,999 | 9 (9.5%) | 0 (0.0%) |
| $25,000 to $34,999 | 4 (4.2%) | 0 (0.0%) |
| $35,000 to $49,999 | 36 (37.9%) | 2 (1.3%) |
| $50,000 to $74,999 | 18 (19.0%) | 0 (0.0%) |
| $75,000 to $99,999 | 8 (8.4%) | 34 (22.8%) |
| $100,000 to $149,999 | 8 (8.4%) | 25 (16.8%) |
| $150,000 or more | 12 (12.6%) | 57 (38.3%) |
| Total | 95 (100.0%) | 149 (100.0%) |
Property Value to Household Income Ratio in Roslyn
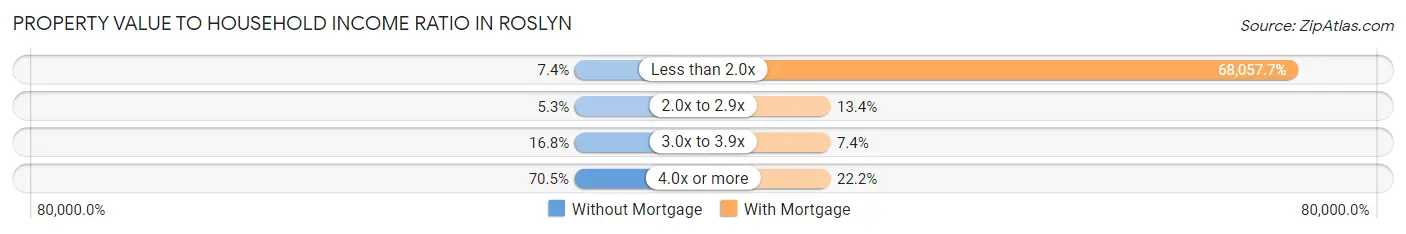
| Value-to-Income Ratio | Without Mortgage | With Mortgage |
| Less than 2.0x | 7 (7.4%) | 101,406 (68,057.7%) |
| 2.0x to 2.9x | 5 (5.3%) | 20 (13.4%) |
| 3.0x to 3.9x | 16 (16.8%) | 11 (7.4%) |
| 4.0x or more | 67 (70.5%) | 33 (22.2%) |
| Total | 95 (100.0%) | 149 (100.0%) |
Real Estate Taxes by Mortgage Status in Roslyn
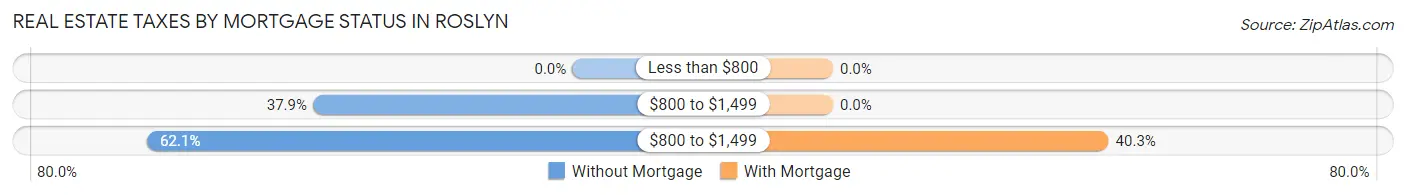
| Property Taxes | Without Mortgage | With Mortgage |
| Less than $800 | 0 (0.0%) | 0 (0.0%) |
| $800 to $1,499 | 36 (37.9%) | 0 (0.0%) |
| $800 to $1,499 | 59 (62.1%) | 60 (40.3%) |
| Total | 95 (100.0%) | 149 (100.0%) |
Health & Disability in Roslyn
Health Insurance Coverage by Age in Roslyn
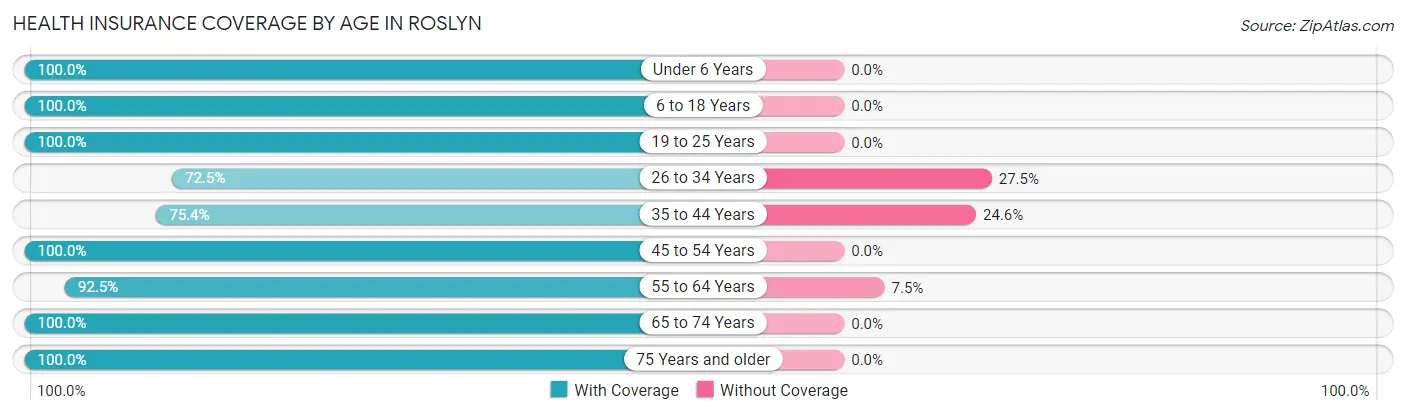
| Age Bracket | With Coverage | Without Coverage |
| Under 6 Years | 62 (100.0%) | 0 (0.0%) |
| 6 to 18 Years | 89 (100.0%) | 0 (0.0%) |
| 19 to 25 Years | 39 (100.0%) | 0 (0.0%) |
| 26 to 34 Years | 116 (72.5%) | 44 (27.5%) |
| 35 to 44 Years | 89 (75.4%) | 29 (24.6%) |
| 45 to 54 Years | 114 (100.0%) | 0 (0.0%) |
| 55 to 64 Years | 123 (92.5%) | 10 (7.5%) |
| 65 to 74 Years | 81 (100.0%) | 0 (0.0%) |
| 75 Years and older | 31 (100.0%) | 0 (0.0%) |
| Total | 744 (90.0%) | 83 (10.0%) |
Health Insurance Coverage by Citizenship Status in Roslyn
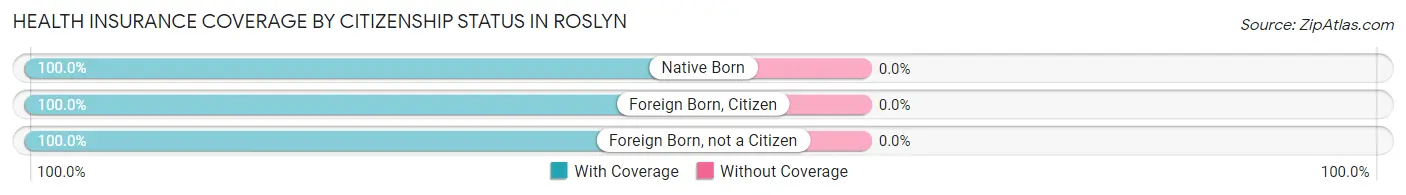
| Citizenship Status | With Coverage | Without Coverage |
| Native Born | 62 (100.0%) | 0 (0.0%) |
| Foreign Born, Citizen | 89 (100.0%) | 0 (0.0%) |
| Foreign Born, not a Citizen | 39 (100.0%) | 0 (0.0%) |
Health Insurance Coverage by Household Income in Roslyn
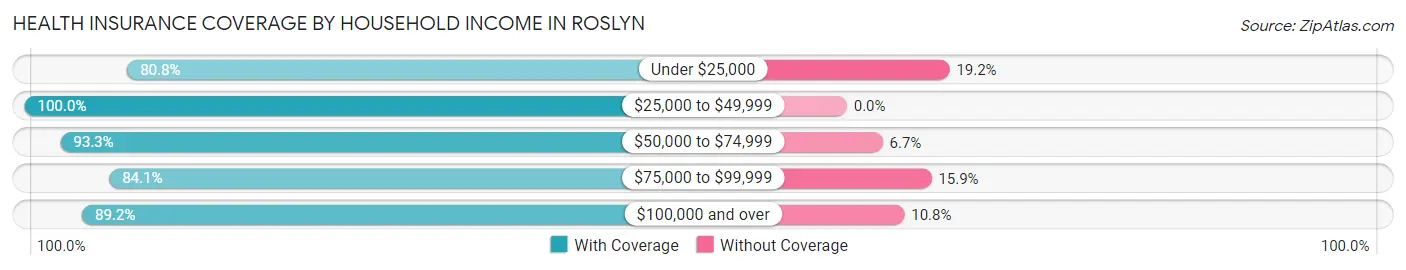
| Household Income | With Coverage | Without Coverage |
| Under $25,000 | 63 (80.8%) | 15 (19.2%) |
| $25,000 to $49,999 | 130 (100.0%) | 0 (0.0%) |
| $50,000 to $74,999 | 139 (93.3%) | 10 (6.7%) |
| $75,000 to $99,999 | 122 (84.1%) | 23 (15.9%) |
| $100,000 and over | 290 (89.2%) | 35 (10.8%) |
Public vs Private Health Insurance Coverage by Age in Roslyn
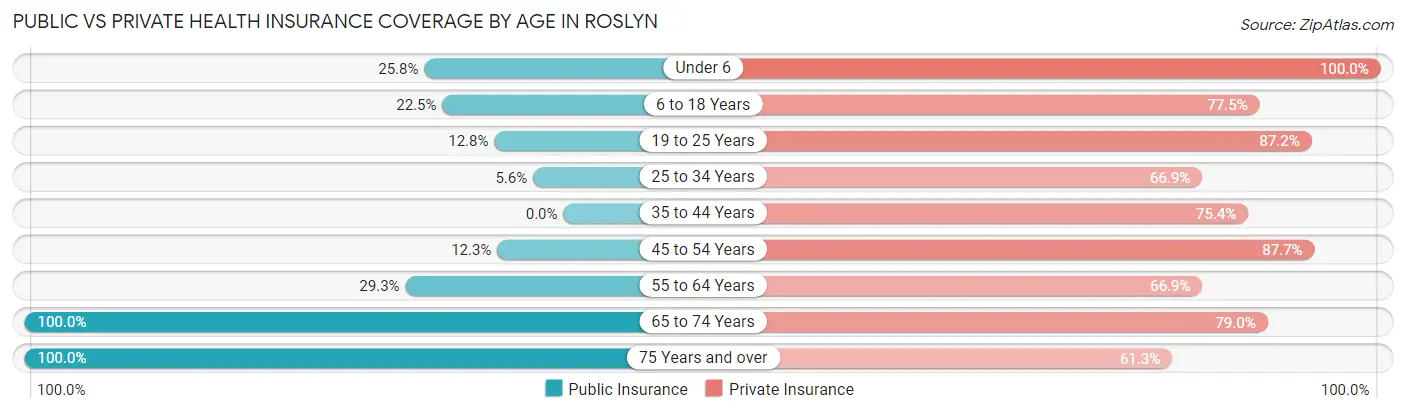
| Age Bracket | Public Insurance | Private Insurance |
| Under 6 | 16 (25.8%) | 62 (100.0%) |
| 6 to 18 Years | 20 (22.5%) | 69 (77.5%) |
| 19 to 25 Years | 5 (12.8%) | 34 (87.2%) |
| 25 to 34 Years | 9 (5.6%) | 107 (66.9%) |
| 35 to 44 Years | 0 (0.0%) | 89 (75.4%) |
| 45 to 54 Years | 14 (12.3%) | 100 (87.7%) |
| 55 to 64 Years | 39 (29.3%) | 89 (66.9%) |
| 65 to 74 Years | 81 (100.0%) | 64 (79.0%) |
| 75 Years and over | 31 (100.0%) | 19 (61.3%) |
| Total | 215 (26.0%) | 633 (76.5%) |
Disability Status by Sex by Age in Roslyn
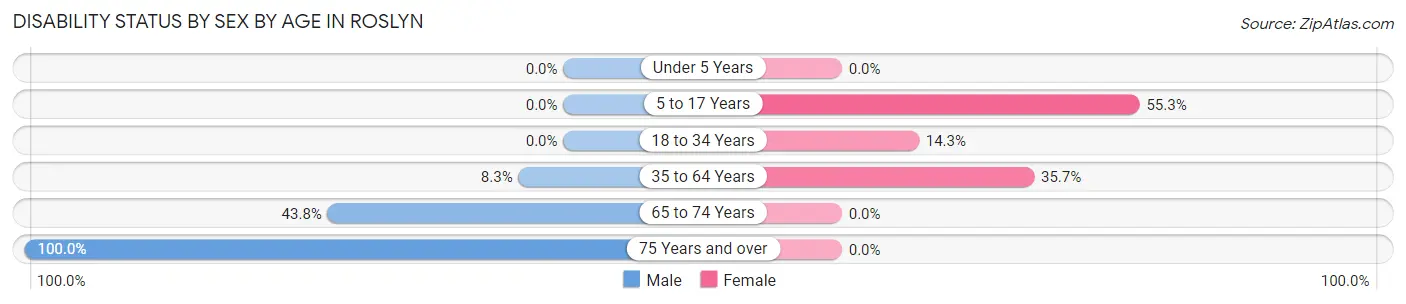
| Age Bracket | Male | Female |
| Under 5 Years | 0 (0.0%) | 0 (0.0%) |
| 5 to 17 Years | 0 (0.0%) | 21 (55.3%) |
| 18 to 34 Years | 0 (0.0%) | 10 (14.3%) |
| 35 to 64 Years | 15 (8.3%) | 66 (35.7%) |
| 65 to 74 Years | 28 (43.8%) | 0 (0.0%) |
| 75 Years and over | 9 (100.0%) | 0 (0.0%) |
Disability Class by Sex by Age in Roslyn
Disability Class: Hearing Difficulty
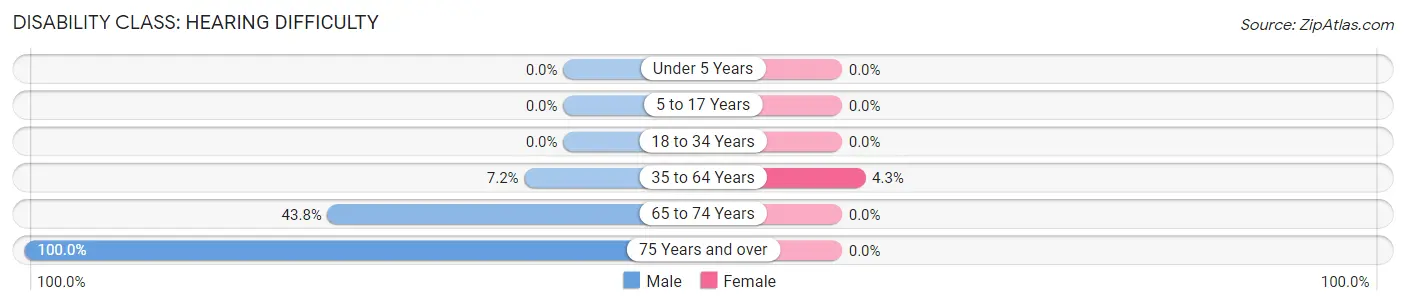
| Age Bracket | Male | Female |
| Under 5 Years | 0 (0.0%) | 0 (0.0%) |
| 5 to 17 Years | 0 (0.0%) | 0 (0.0%) |
| 18 to 34 Years | 0 (0.0%) | 0 (0.0%) |
| 35 to 64 Years | 13 (7.2%) | 8 (4.3%) |
| 65 to 74 Years | 28 (43.8%) | 0 (0.0%) |
| 75 Years and over | 9 (100.0%) | 0 (0.0%) |
Disability Class: Vision Difficulty
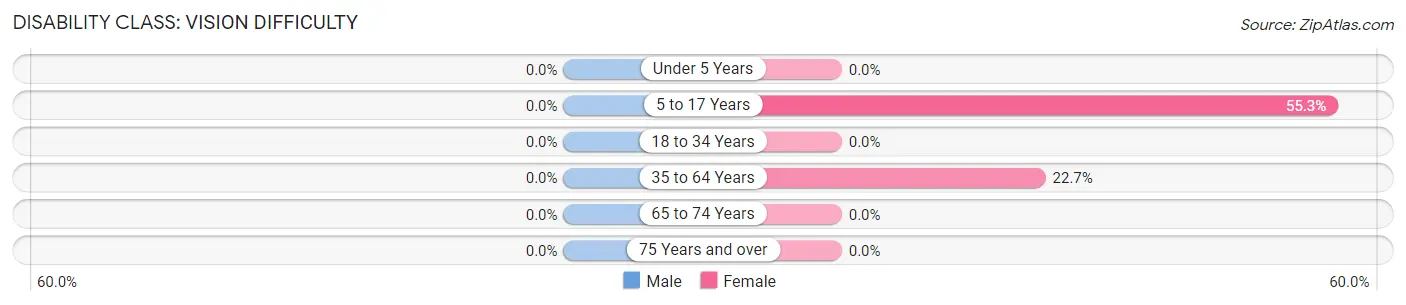
| Age Bracket | Male | Female |
| Under 5 Years | 0 (0.0%) | 0 (0.0%) |
| 5 to 17 Years | 0 (0.0%) | 21 (55.3%) |
| 18 to 34 Years | 0 (0.0%) | 0 (0.0%) |
| 35 to 64 Years | 0 (0.0%) | 42 (22.7%) |
| 65 to 74 Years | 0 (0.0%) | 0 (0.0%) |
| 75 Years and over | 0 (0.0%) | 0 (0.0%) |
Disability Class: Cognitive Difficulty
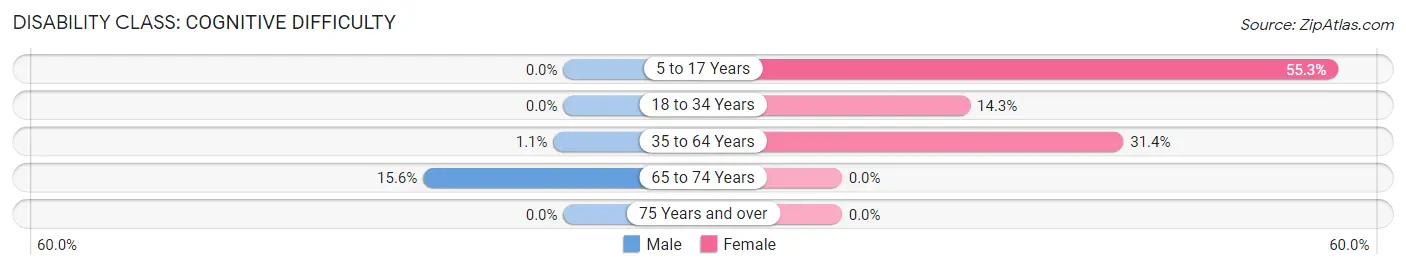
| Age Bracket | Male | Female |
| 5 to 17 Years | 0 (0.0%) | 21 (55.3%) |
| 18 to 34 Years | 0 (0.0%) | 10 (14.3%) |
| 35 to 64 Years | 2 (1.1%) | 58 (31.4%) |
| 65 to 74 Years | 10 (15.6%) | 0 (0.0%) |
| 75 Years and over | 0 (0.0%) | 0 (0.0%) |
Disability Class: Ambulatory Difficulty
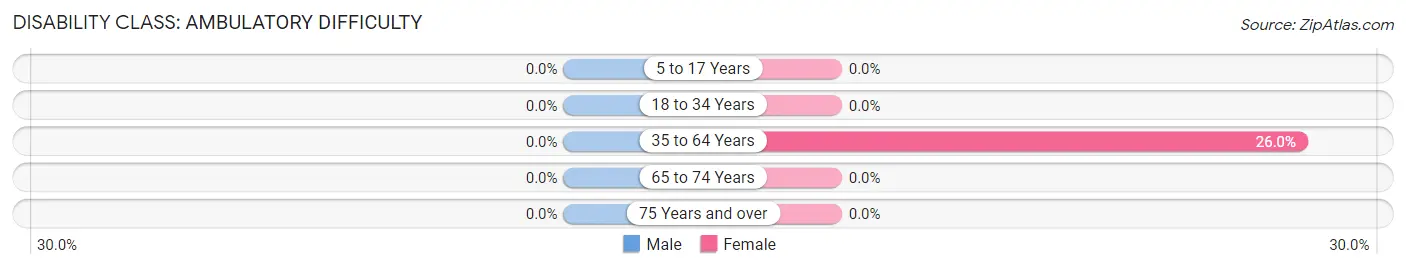
| Age Bracket | Male | Female |
| 5 to 17 Years | 0 (0.0%) | 0 (0.0%) |
| 18 to 34 Years | 0 (0.0%) | 0 (0.0%) |
| 35 to 64 Years | 0 (0.0%) | 48 (26.0%) |
| 65 to 74 Years | 0 (0.0%) | 0 (0.0%) |
| 75 Years and over | 0 (0.0%) | 0 (0.0%) |
Disability Class: Self-Care Difficulty
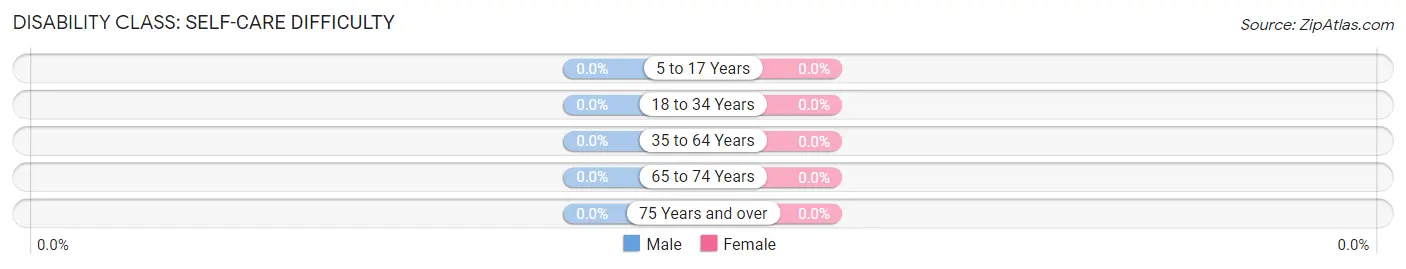
| Age Bracket | Male | Female |
| 5 to 17 Years | 0 (0.0%) | 0 (0.0%) |
| 18 to 34 Years | 0 (0.0%) | 0 (0.0%) |
| 35 to 64 Years | 0 (0.0%) | 0 (0.0%) |
| 65 to 74 Years | 0 (0.0%) | 0 (0.0%) |
| 75 Years and over | 0 (0.0%) | 0 (0.0%) |
Technology Access in Roslyn
Computing Device Access in Roslyn
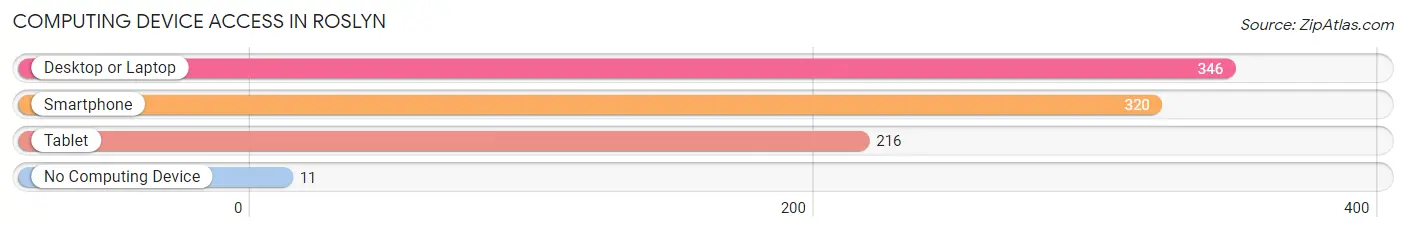
| Device Type | # Households | % Households |
| Desktop or Laptop | 346 | 91.5% |
| Smartphone | 320 | 84.7% |
| Tablet | 216 | 57.1% |
| No Computing Device | 11 | 2.9% |
| Total | 378 | 100.0% |
Internet Access in Roslyn
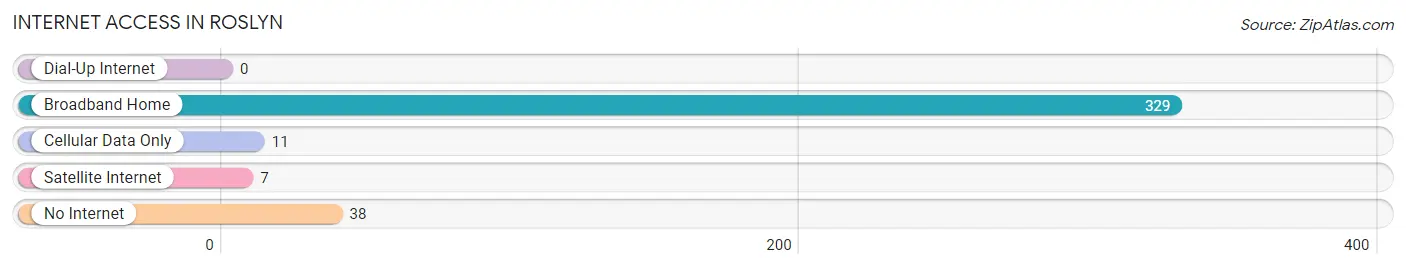
| Internet Type | # Households | % Households |
| Dial-Up Internet | 0 | 0.0% |
| Broadband Home | 329 | 87.0% |
| Cellular Data Only | 11 | 2.9% |
| Satellite Internet | 7 | 1.8% |
| No Internet | 38 | 10.1% |
| Total | 378 | 100.0% |
Roslyn Summary
Roslyn, Washington is a small town located in the Cascade Mountains of Kittitas County, Washington. It is situated in the foothills of the Cascade Range, about 25 miles east of the city of Ellensburg. The town is located at an elevation of 2,400 feet and has a population of approximately 900 people.
History
The town of Roslyn was founded in 1886 by coal miners who had come to the area to work in the coal mines. The town was named after Roslyn, Pennsylvania, which was the hometown of one of the miners. The town quickly grew and by 1890, it had a population of over 1,000 people.
The coal mines in the area were very productive and the town prospered. In the early 1900s, the town had a population of over 2,000 people and was home to several businesses, including a hotel, a bank, a theater, and a brewery.
In the 1920s, the coal industry began to decline and the town's population began to decline as well. By the 1950s, the population had dropped to just over 500 people.
Geography
Roslyn is located in the Cascade Mountains of Kittitas County, Washington. It is situated in the foothills of the Cascade Range, about 25 miles east of the city of Ellensburg. The town is located at an elevation of 2,400 feet and has a population of approximately 900 people.
The town is surrounded by the Cascade Mountains, which provide a beautiful backdrop for the town. The nearby mountains are home to a variety of wildlife, including deer, elk, and bear.
The town is located near several recreational areas, including the Yakima River, Lake Cle Elum, and the Iron Horse State Park. These areas provide opportunities for fishing, camping, hiking, and other outdoor activities.
Economy
The economy of Roslyn is largely based on tourism and recreation. The town is home to several restaurants, bars, and shops, as well as a variety of lodging options. The nearby recreational areas provide opportunities for fishing, camping, hiking, and other outdoor activities.
The town is also home to several small businesses, including a brewery, a winery, and a distillery. These businesses provide employment opportunities for the local residents.
Demographics
As of the 2010 census, the population of Roslyn was 893 people. The racial makeup of the town was 94.3% White, 0.3% African American, 0.7% Native American, 0.7% Asian, 0.1% Pacific Islander, 0.7% from other races, and 3.2% from two or more races. Hispanic or Latino of any race were 3.2% of the population.
The median income for a household in the town was $41,250, and the median income for a family was $50,000. The per capita income for the town was $20,945. About 10.2% of families and 13.2% of the population were below the poverty line, including 16.7% of those under age 18 and 8.3% of those age 65 or over.
Common Questions
What is Per Capita Income in Roslyn?
Per Capita income in Roslyn is $41,980.
What is the Median Family Income in Roslyn?
Median Family Income in Roslyn is $79,500.
What is the Median Household income in Roslyn?
Median Household Income in Roslyn is $64,500.
What is Income or Wage Gap in Roslyn?
Income or Wage Gap in Roslyn is 6.6%.
Women in Roslyn earn 93.4 cents for every dollar earned by a man.
What is Inequality or Gini Index in Roslyn?
Inequality or Gini Index in Roslyn is 0.47.
What is the Total Population of Roslyn?
Total Population of Roslyn is 827.
What is the Total Male Population of Roslyn?
Total Male Population of Roslyn is 479.
What is the Total Female Population of Roslyn?
Total Female Population of Roslyn is 348.
What is the Ratio of Males per 100 Females in Roslyn?
There are 137.64 Males per 100 Females in Roslyn.
What is the Ratio of Females per 100 Males in Roslyn?
There are 72.65 Females per 100 Males in Roslyn.
What is the Median Population Age in Roslyn?
Median Population Age in Roslyn is 42.5 Years.
What is the Average Family Size in Roslyn
Average Family Size in Roslyn is 2.6 People.
What is the Average Household Size in Roslyn
Average Household Size in Roslyn is 2.2 People.
How Large is the Labor Force in Roslyn?
There are 431 People in the Labor Forcein in Roslyn.
What is the Percentage of People in the Labor Force in Roslyn?
62.9% of People are in the Labor Force in Roslyn.
What is the Unemployment Rate in Roslyn?
Unemployment Rate in Roslyn is 6.5%.