Cities with the Largest Chilean Community in Washington
RELATED REPORTS & OPTIONS
Chilean
Washington
Compare Cities
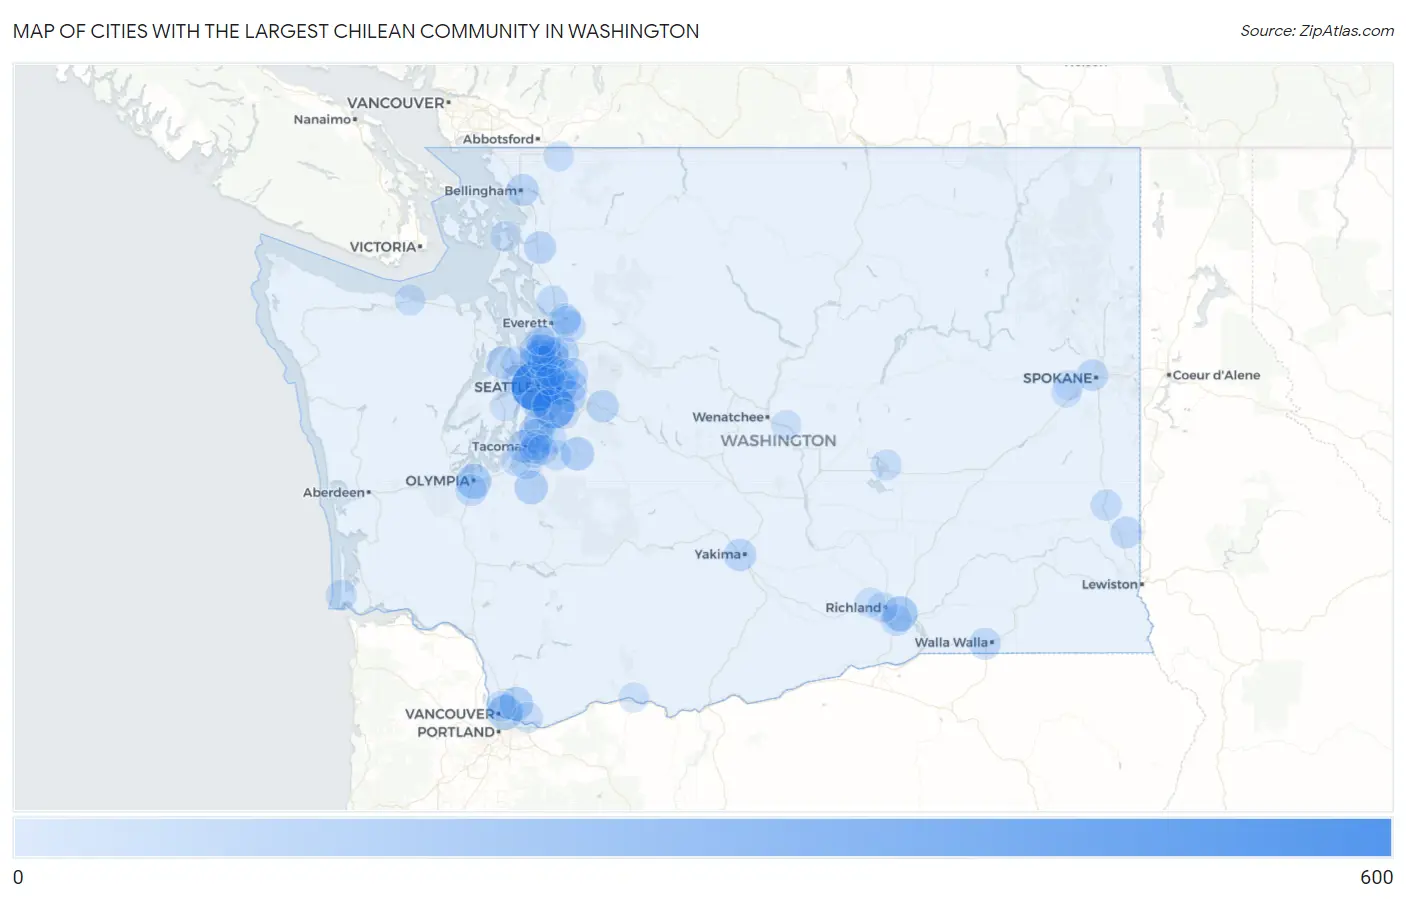
Map of Cities with the Largest Chilean Community in Washington
0
600
Cities with the Largest Chilean Community in Washington
| City | Chilean | vs State | vs National | |
| 1. | Seattle | 587 | 4,369(13.44%)#1 | 182,671(0.32%)#31 |
| 2. | Renton | 346 | 4,369(7.92%)#2 | 182,671(0.19%)#67 |
| 3. | Bellevue | 154 | 4,369(3.52%)#3 | 182,671(0.08%)#220 |
| 4. | Pasco | 147 | 4,369(3.36%)#4 | 182,671(0.08%)#227 |
| 5. | Vancouver | 145 | 4,369(3.32%)#5 | 182,671(0.08%)#230 |
| 6. | Olympia | 142 | 4,369(3.25%)#6 | 182,671(0.08%)#239 |
| 7. | Shoreline | 130 | 4,369(2.98%)#7 | 182,671(0.07%)#271 |
| 8. | Federal Way | 127 | 4,369(2.91%)#8 | 182,671(0.07%)#281 |
| 9. | Orchards | 105 | 4,369(2.40%)#9 | 182,671(0.06%)#346 |
| 10. | South Creek | 100 | 4,369(2.29%)#10 | 182,671(0.05%)#364 |
| 11. | Enumclaw | 94 | 4,369(2.15%)#11 | 182,671(0.05%)#392 |
| 12. | Tacoma | 77 | 4,369(1.76%)#12 | 182,671(0.04%)#465 |
| 13. | Maltby | 77 | 4,369(1.76%)#13 | 182,671(0.04%)#471 |
| 14. | Alderwood Manor | 76 | 4,369(1.74%)#14 | 182,671(0.04%)#478 |
| 15. | Des Moines | 71 | 4,369(1.63%)#15 | 182,671(0.04%)#516 |
| 16. | Poulsbo | 70 | 4,369(1.60%)#16 | 182,671(0.04%)#531 |
| 17. | Bothell | 68 | 4,369(1.56%)#17 | 182,671(0.04%)#544 |
| 18. | Yakima | 67 | 4,369(1.53%)#18 | 182,671(0.04%)#551 |
| 19. | Mount Vernon | 64 | 4,369(1.46%)#19 | 182,671(0.04%)#577 |
| 20. | Kenmore | 62 | 4,369(1.42%)#20 | 182,671(0.03%)#592 |
| 21. | North Bend | 62 | 4,369(1.42%)#21 | 182,671(0.03%)#599 |
| 22. | Sammamish | 61 | 4,369(1.40%)#22 | 182,671(0.03%)#604 |
| 23. | Bellingham | 59 | 4,369(1.35%)#23 | 182,671(0.03%)#624 |
| 24. | Kirkland | 57 | 4,369(1.30%)#24 | 182,671(0.03%)#645 |
| 25. | Pullman | 51 | 4,369(1.17%)#25 | 182,671(0.03%)#713 |
| 26. | Union Hill Novelty Hill | 51 | 4,369(1.17%)#26 | 182,671(0.03%)#716 |
| 27. | Garrett | 51 | 4,369(1.17%)#27 | 182,671(0.03%)#718 |
| 28. | Mountlake Terrace | 50 | 4,369(1.14%)#28 | 182,671(0.03%)#725 |
| 29. | Issaquah | 48 | 4,369(1.10%)#29 | 182,671(0.03%)#742 |
| 30. | Tumwater | 46 | 4,369(1.05%)#30 | 182,671(0.03%)#765 |
| 31. | Spokane | 45 | 4,369(1.03%)#31 | 182,671(0.02%)#773 |
| 32. | Redmond | 40 | 4,369(0.92%)#32 | 182,671(0.02%)#835 |
| 33. | Marysville | 37 | 4,369(0.85%)#33 | 182,671(0.02%)#895 |
| 34. | Everett | 36 | 4,369(0.82%)#34 | 182,671(0.02%)#915 |
| 35. | Kennewick | 36 | 4,369(0.82%)#35 | 182,671(0.02%)#916 |
| 36. | Parkland | 36 | 4,369(0.82%)#36 | 182,671(0.02%)#923 |
| 37. | Colfax | 34 | 4,369(0.78%)#37 | 182,671(0.02%)#964 |
| 38. | Auburn | 31 | 4,369(0.71%)#38 | 182,671(0.02%)#1,008 |
| 39. | Edmonds | 31 | 4,369(0.71%)#39 | 182,671(0.02%)#1,012 |
| 40. | Lake Stevens | 28 | 4,369(0.64%)#40 | 182,671(0.02%)#1,075 |
| 41. | Camas | 24 | 4,369(0.55%)#41 | 182,671(0.01%)#1,154 |
| 42. | Hazel Dell | 24 | 4,369(0.55%)#42 | 182,671(0.01%)#1,156 |
| 43. | Waller | 22 | 4,369(0.50%)#43 | 182,671(0.01%)#1,218 |
| 44. | Long Beach | 22 | 4,369(0.50%)#44 | 182,671(0.01%)#1,227 |
| 45. | Moses Lake | 21 | 4,369(0.48%)#45 | 182,671(0.01%)#1,241 |
| 46. | Lake Forest Park | 21 | 4,369(0.48%)#46 | 182,671(0.01%)#1,247 |
| 47. | Bryn Mawr Skyway | 19 | 4,369(0.43%)#47 | 182,671(0.01%)#1,293 |
| 48. | Bothell East | 19 | 4,369(0.43%)#48 | 182,671(0.01%)#1,296 |
| 49. | Port Angeles | 17 | 4,369(0.39%)#49 | 182,671(0.01%)#1,363 |
| 50. | Richland | 16 | 4,369(0.37%)#50 | 182,671(0.01%)#1,380 |
| 51. | Lake Stickney | 16 | 4,369(0.37%)#51 | 182,671(0.01%)#1,396 |
| 52. | Cavalero | 16 | 4,369(0.37%)#52 | 182,671(0.01%)#1,412 |
| 53. | Bonney Lake | 14 | 4,369(0.32%)#53 | 182,671(0.01%)#1,463 |
| 54. | Fife | 14 | 4,369(0.32%)#54 | 182,671(0.01%)#1,473 |
| 55. | Fife Heights | 14 | 4,369(0.32%)#55 | 182,671(0.01%)#1,481 |
| 56. | Bainbridge Island | 13 | 4,369(0.30%)#56 | 182,671(0.01%)#1,495 |
| 57. | Edgewood | 13 | 4,369(0.30%)#57 | 182,671(0.01%)#1,501 |
| 58. | Peaceful Valley | 10 | 4,369(0.23%)#58 | 182,671(0.01%)#1,655 |
| 59. | Lynnwood | 8 | 4,369(0.18%)#59 | 182,671(0.00%)#1,711 |
| 60. | Picnic Point | 7 | 4,369(0.16%)#60 | 182,671(0.00%)#1,778 |
| 61. | Maple Heights Lake Desire | 6 | 4,369(0.14%)#61 | 182,671(0.00%)#1,825 |
| 62. | West Richland | 5 | 4,369(0.11%)#62 | 182,671(0.00%)#1,849 |
| 63. | Fairchild Afb | 5 | 4,369(0.11%)#63 | 182,671(0.00%)#1,862 |
| 64. | White Salmon | 5 | 4,369(0.11%)#64 | 182,671(0.00%)#1,866 |
| 65. | Rock Island | 5 | 4,369(0.11%)#65 | 182,671(0.00%)#1,874 |
| 66. | Lakewood | 4 | 4,369(0.09%)#66 | 182,671(0.00%)#1,880 |
| 67. | Indianola | 4 | 4,369(0.09%)#67 | 182,671(0.00%)#1,900 |
| 68. | Anacortes | 3 | 4,369(0.07%)#68 | 182,671(0.00%)#1,931 |
| 69. | Roche Harbor | 3 | 4,369(0.07%)#69 | 182,671(0.00%)#1,948 |
| 70. | White Center | 2 | 4,369(0.05%)#70 | 182,671(0.00%)#1,959 |
| 71. | Medical Lake | 2 | 4,369(0.05%)#71 | 182,671(0.00%)#1,965 |
| 72. | Bethel | 1 | 4,369(0.02%)#72 | 182,671(0.00%)#1,998 |
| 73. | Yarrow Point | 1 | 4,369(0.02%)#73 | 182,671(0.00%)#2,004 |
Common Questions
What are the Top 10 Cities with the Largest Chilean Community in Washington?
Top 10 Cities with the Largest Chilean Community in Washington are:
#1
587
#2
346
#3
154
#4
147
#5
145
#6
142
#7
130
#8
127
#9
105
#10
100
What city has the Largest Chilean Community in Washington?
Seattle has the Largest Chilean Community in Washington with 587.
What is the Total Chilean Population in the State of Washington?
Total Chilean Population in Washington is 4,369.
What is the Total Chilean Population in the United States?
Total Chilean Population in the United States is 182,671.