Cities with the Highest Percentage of Population Employed in Educational Services in Washington
RELATED REPORTS & OPTIONS
Educational Services
Washington
Compare Cities
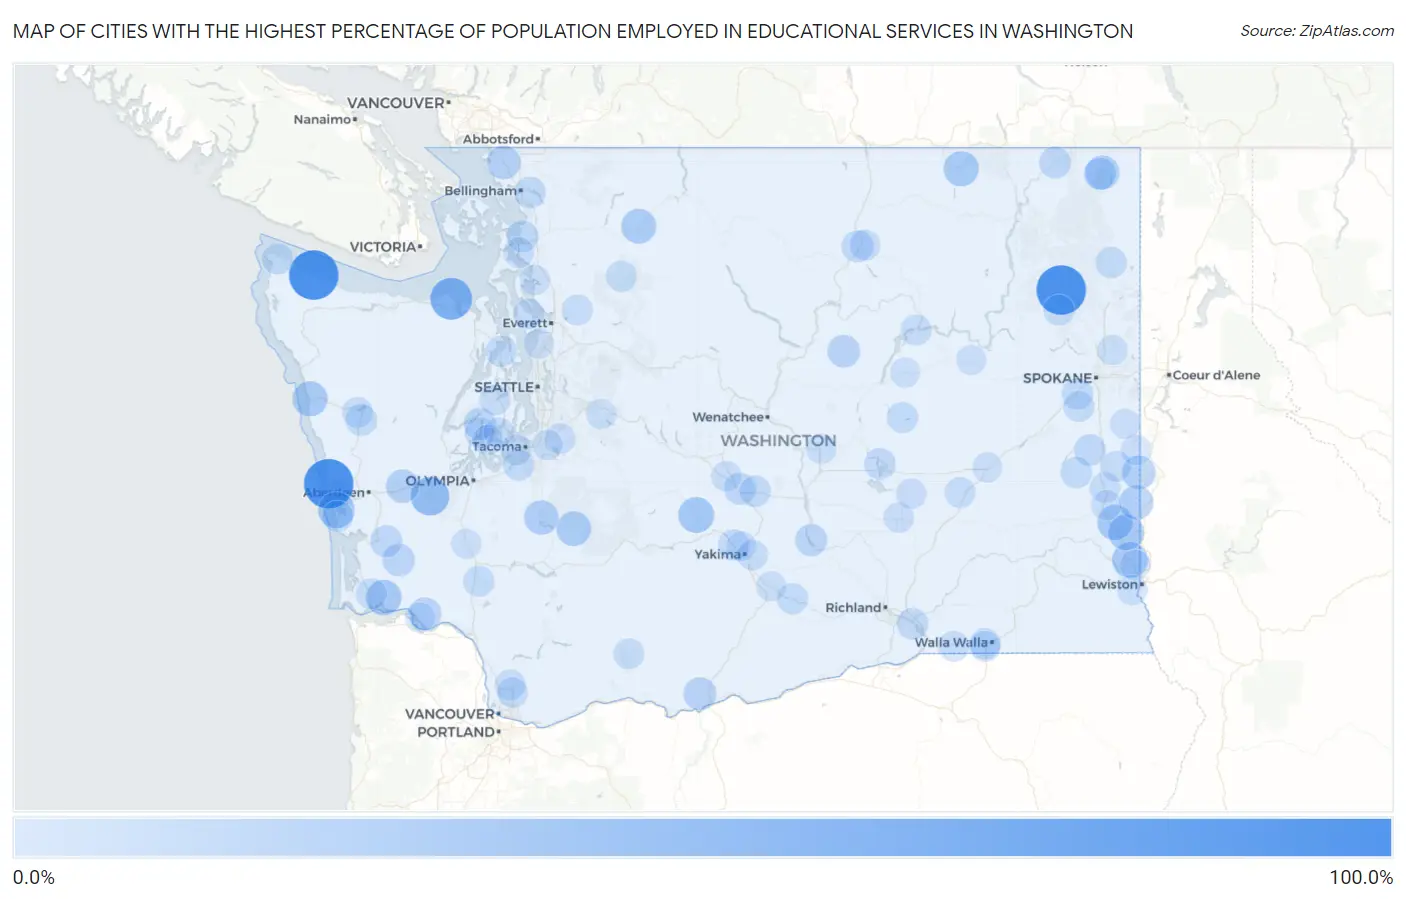
Map of Cities with the Highest Percentage of Population Employed in Educational Services in Washington
0.0%
100.0%
Cities with the Highest Percentage of Population Employed in Educational Services in Washington
| City | % Employed | vs State | vs National | |
| 1. | Valley | 100.0% | 8.3%(+91.7)#1 | 9.3%(+90.7)#8 |
| 2. | Sekiu | 100.0% | 8.3%(+91.7)#2 | 9.3%(+90.7)#16 |
| 3. | Oyehut | 100.0% | 8.3%(+91.7)#3 | 9.3%(+90.7)#19 |
| 4. | Jamestown | 64.7% | 8.3%(+56.4)#4 | 9.3%(+55.4)#90 |
| 5. | Porter | 50.0% | 8.3%(+41.7)#5 | 9.3%(+40.7)#203 |
| 6. | Sunland Estates | 50.0% | 8.3%(+41.7)#6 | 9.3%(+40.7)#206 |
| 7. | Cohassett Beach | 40.2% | 8.3%(+31.9)#7 | 9.3%(+30.9)#387 |
| 8. | Nile | 37.5% | 8.3%(+29.2)#8 | 9.3%(+28.2)#464 |
| 9. | Colton | 37.1% | 8.3%(+28.8)#9 | 9.3%(+27.8)#475 |
| 10. | Deep River | 36.8% | 8.3%(+28.5)#10 | 9.3%(+27.5)#485 |
| 11. | Pullman | 36.6% | 8.3%(+28.3)#11 | 9.3%(+27.3)#497 |
| 12. | Albion | 35.8% | 8.3%(+27.5)#12 | 9.3%(+26.5)#525 |
| 13. | Curlew | 34.7% | 8.3%(+26.4)#13 | 9.3%(+25.4)#588 |
| 14. | Bow | 34.7% | 8.3%(+26.4)#14 | 9.3%(+25.3)#589 |
| 15. | Queets | 34.5% | 8.3%(+26.2)#15 | 9.3%(+25.2)#596 |
| 16. | Marblemount | 33.3% | 8.3%(+25.0)#16 | 9.3%(+24.0)#640 |
| 17. | Ashford | 32.8% | 8.3%(+24.5)#17 | 9.3%(+23.5)#669 |
| 18. | La Grande | 31.1% | 8.3%(+22.8)#18 | 9.3%(+21.7)#759 |
| 19. | Metaline Falls | 30.4% | 8.3%(+22.1)#19 | 9.3%(+21.1)#799 |
| 20. | Palouse | 30.1% | 8.3%(+21.8)#20 | 9.3%(+20.7)#819 |
| 21. | Farmington | 28.6% | 8.3%(+20.3)#21 | 9.3%(+19.3)#921 |
| 22. | Custer | 28.4% | 8.3%(+20.1)#22 | 9.3%(+19.1)#933 |
| 23. | Brady | 27.4% | 8.3%(+19.1)#23 | 9.3%(+18.1)#1,017 |
| 24. | Centerville | 25.4% | 8.3%(+17.1)#24 | 9.3%(+16.1)#1,216 |
| 25. | Mansfield | 24.2% | 8.3%(+15.9)#25 | 9.3%(+14.9)#1,345 |
| 26. | Upper Elochoman | 23.8% | 8.3%(+15.5)#26 | 9.3%(+14.5)#1,394 |
| 27. | Lebam | 23.5% | 8.3%(+15.2)#27 | 9.3%(+14.2)#1,449 |
| 28. | Desert Aire | 22.5% | 8.3%(+14.2)#28 | 9.3%(+13.2)#1,601 |
| 29. | Metaline | 22.0% | 8.3%(+13.7)#29 | 9.3%(+12.7)#1,691 |
| 30. | Allyn | 21.5% | 8.3%(+13.2)#30 | 9.3%(+12.2)#1,774 |
| 31. | Willapa | 21.1% | 8.3%(+12.8)#31 | 9.3%(+11.8)#1,846 |
| 32. | Ellensburg | 21.0% | 8.3%(+12.7)#32 | 9.3%(+11.7)#1,879 |
| 33. | Omak | 20.8% | 8.3%(+12.5)#33 | 9.3%(+11.4)#1,940 |
| 34. | Northport | 20.4% | 8.3%(+12.1)#34 | 9.3%(+11.1)#2,034 |
| 35. | Bay View | 20.3% | 8.3%(+12.0)#35 | 9.3%(+11.0)#2,044 |
| 36. | Malden | 20.0% | 8.3%(+11.7)#36 | 9.3%(+10.7)#2,111 |
| 37. | Neilton | 19.4% | 8.3%(+11.1)#37 | 9.3%(+10.1)#2,280 |
| 38. | Finley | 19.3% | 8.3%(+11.0)#38 | 9.3%(+10.0)#2,303 |
| 39. | St John | 19.3% | 8.3%(+11.0)#39 | 9.3%(+9.98)#2,310 |
| 40. | Geneva | 19.3% | 8.3%(+11.0)#40 | 9.3%(+9.94)#2,323 |
| 41. | Cascade Valley | 19.2% | 8.3%(+10.9)#41 | 9.3%(+9.92)#2,326 |
| 42. | Four Lakes | 18.6% | 8.3%(+10.3)#42 | 9.3%(+9.31)#2,517 |
| 43. | Kittitas | 18.6% | 8.3%(+10.3)#43 | 9.3%(+9.29)#2,523 |
| 44. | Gleed | 18.6% | 8.3%(+10.3)#44 | 9.3%(+9.24)#2,547 |
| 45. | Garrett | 18.3% | 8.3%(+9.97)#45 | 9.3%(+8.96)#2,655 |
| 46. | Cusick | 18.2% | 8.3%(+9.88)#46 | 9.3%(+8.87)#2,687 |
| 47. | Lofall | 18.0% | 8.3%(+9.66)#47 | 9.3%(+8.64)#2,763 |
| 48. | Grayland | 17.9% | 8.3%(+9.63)#48 | 9.3%(+8.62)#2,778 |
| 49. | Outlook | 17.9% | 8.3%(+9.57)#49 | 9.3%(+8.56)#2,799 |
| 50. | Wilson Creek | 17.9% | 8.3%(+9.56)#50 | 9.3%(+8.54)#2,803 |
| 51. | Neah Bay | 17.8% | 8.3%(+9.47)#51 | 9.3%(+8.45)#2,831 |
| 52. | Mcchord Afb | 17.4% | 8.3%(+9.05)#52 | 9.3%(+8.04)#3,002 |
| 53. | Toledo | 17.0% | 8.3%(+8.68)#53 | 9.3%(+7.67)#3,177 |
| 54. | College Place | 16.7% | 8.3%(+8.43)#54 | 9.3%(+7.41)#3,297 |
| 55. | Darrington | 16.7% | 8.3%(+8.41)#55 | 9.3%(+7.39)#3,304 |
| 56. | Cheney | 16.7% | 8.3%(+8.39)#56 | 9.3%(+7.37)#3,311 |
| 57. | Steptoe | 16.7% | 8.3%(+8.37)#57 | 9.3%(+7.35)#3,351 |
| 58. | Amanda Park | 16.7% | 8.3%(+8.37)#58 | 9.3%(+7.35)#3,359 |
| 59. | Gorst | 16.6% | 8.3%(+8.29)#59 | 9.3%(+7.28)#3,409 |
| 60. | Naselle | 16.5% | 8.3%(+8.21)#60 | 9.3%(+7.20)#3,454 |
| 61. | Lake Bosworth | 16.5% | 8.3%(+8.19)#61 | 9.3%(+7.17)#3,464 |
| 62. | North Omak | 16.4% | 8.3%(+8.15)#62 | 9.3%(+7.13)#3,477 |
| 63. | Cherry Grove | 16.3% | 8.3%(+7.97)#63 | 9.3%(+6.95)#3,558 |
| 64. | Springdale | 16.1% | 8.3%(+7.83)#64 | 9.3%(+6.81)#3,644 |
| 65. | Riverpoint | 16.1% | 8.3%(+7.79)#65 | 9.3%(+6.78)#3,670 |
| 66. | Lind | 16.0% | 8.3%(+7.75)#66 | 9.3%(+6.73)#3,692 |
| 67. | Grand Coulee | 15.9% | 8.3%(+7.63)#67 | 9.3%(+6.62)#3,757 |
| 68. | Meadow Glade | 15.9% | 8.3%(+7.56)#68 | 9.3%(+6.55)#3,789 |
| 69. | Terrace Heights | 15.9% | 8.3%(+7.56)#69 | 9.3%(+6.54)#3,790 |
| 70. | Touchet | 15.8% | 8.3%(+7.49)#70 | 9.3%(+6.47)#3,833 |
| 71. | Langley | 15.7% | 8.3%(+7.42)#71 | 9.3%(+6.40)#3,868 |
| 72. | Fircrest | 15.6% | 8.3%(+7.34)#72 | 9.3%(+6.32)#3,917 |
| 73. | Trout Lake | 15.6% | 8.3%(+7.33)#73 | 9.3%(+6.31)#3,920 |
| 74. | Oakesdale | 15.6% | 8.3%(+7.33)#74 | 9.3%(+6.31)#3,921 |
| 75. | Grapeview | 15.5% | 8.3%(+7.16)#75 | 9.3%(+6.14)#4,030 |
| 76. | La Conner | 15.3% | 8.3%(+6.97)#76 | 9.3%(+5.95)#4,148 |
| 77. | Home | 15.2% | 8.3%(+6.87)#77 | 9.3%(+5.85)#4,196 |
| 78. | Lake Holm | 15.0% | 8.3%(+6.66)#78 | 9.3%(+5.65)#4,332 |
| 79. | Othello | 14.9% | 8.3%(+6.64)#79 | 9.3%(+5.62)#4,348 |
| 80. | Tekoa | 14.9% | 8.3%(+6.55)#80 | 9.3%(+5.54)#4,404 |
| 81. | Pacific | 14.7% | 8.3%(+6.37)#81 | 9.3%(+5.36)#4,532 |
| 82. | Thorp | 14.6% | 8.3%(+6.33)#82 | 9.3%(+5.32)#4,563 |
| 83. | Warden | 14.6% | 8.3%(+6.29)#83 | 9.3%(+5.27)#4,610 |
| 84. | Clarkston Heights Vineland | 14.3% | 8.3%(+6.04)#84 | 9.3%(+5.02)#4,804 |
| 85. | Uniontown | 14.3% | 8.3%(+5.99)#85 | 9.3%(+4.97)#4,853 |
| 86. | Raft Island | 14.2% | 8.3%(+5.93)#86 | 9.3%(+4.91)#4,922 |
| 87. | Quincy | 14.2% | 8.3%(+5.90)#87 | 9.3%(+4.89)#4,935 |
| 88. | Green Bluff | 14.2% | 8.3%(+5.85)#88 | 9.3%(+4.84)#4,975 |
| 89. | Wilderness Rim | 14.0% | 8.3%(+5.66)#89 | 9.3%(+4.64)#5,150 |
| 90. | Ritzville | 14.0% | 8.3%(+5.65)#90 | 9.3%(+4.63)#5,159 |
| 91. | Colfax | 13.9% | 8.3%(+5.62)#91 | 9.3%(+4.61)#5,181 |
| 92. | Meadowdale | 13.9% | 8.3%(+5.59)#92 | 9.3%(+4.58)#5,198 |
| 93. | Stanwood | 13.8% | 8.3%(+5.45)#93 | 9.3%(+4.44)#5,316 |
| 94. | Lower Elochoman | 13.7% | 8.3%(+5.39)#94 | 9.3%(+4.38)#5,360 |
| 95. | Creston | 13.5% | 8.3%(+5.21)#95 | 9.3%(+4.20)#5,520 |
| 96. | Chehalis | 13.5% | 8.3%(+5.19)#96 | 9.3%(+4.18)#5,537 |
| 97. | Zillah | 13.5% | 8.3%(+5.17)#97 | 9.3%(+4.16)#5,550 |
| 98. | Selah | 13.4% | 8.3%(+5.10)#98 | 9.3%(+4.09)#5,613 |
| 99. | Fairfield | 13.4% | 8.3%(+5.09)#99 | 9.3%(+4.07)#5,624 |
| 100. | Hartline | 13.3% | 8.3%(+5.03)#100 | 9.3%(+4.02)#5,672 |
Common Questions
What are the Top 10 Cities with the Highest Percentage of Population Employed in Educational Services in Washington?
Top 10 Cities with the Highest Percentage of Population Employed in Educational Services in Washington are:
#1
100.0%
#2
100.0%
#3
100.0%
#4
64.7%
#5
50.0%
#6
40.2%
#7
37.5%
#8
37.1%
#9
36.8%
#10
36.6%
What city has the Highest Percentage of Population Employed in Educational Services in Washington?
Valley has the Highest Percentage of Population Employed in Educational Services in Washington with 100.0%.
What is the Percentage of Population Employed in Educational Services in the State of Washington?
Percentage of Population Employed in Educational Services in Washington is 8.3%.
What is the Percentage of Population Employed in Educational Services in the United States?
Percentage of Population Employed in Educational Services in the United States is 9.3%.