Cities with the Highest Percentage of Population Employed in Firefighting & Prevention in Washington
RELATED REPORTS & OPTIONS
Firefighting & Prevention
Washington
Compare Cities
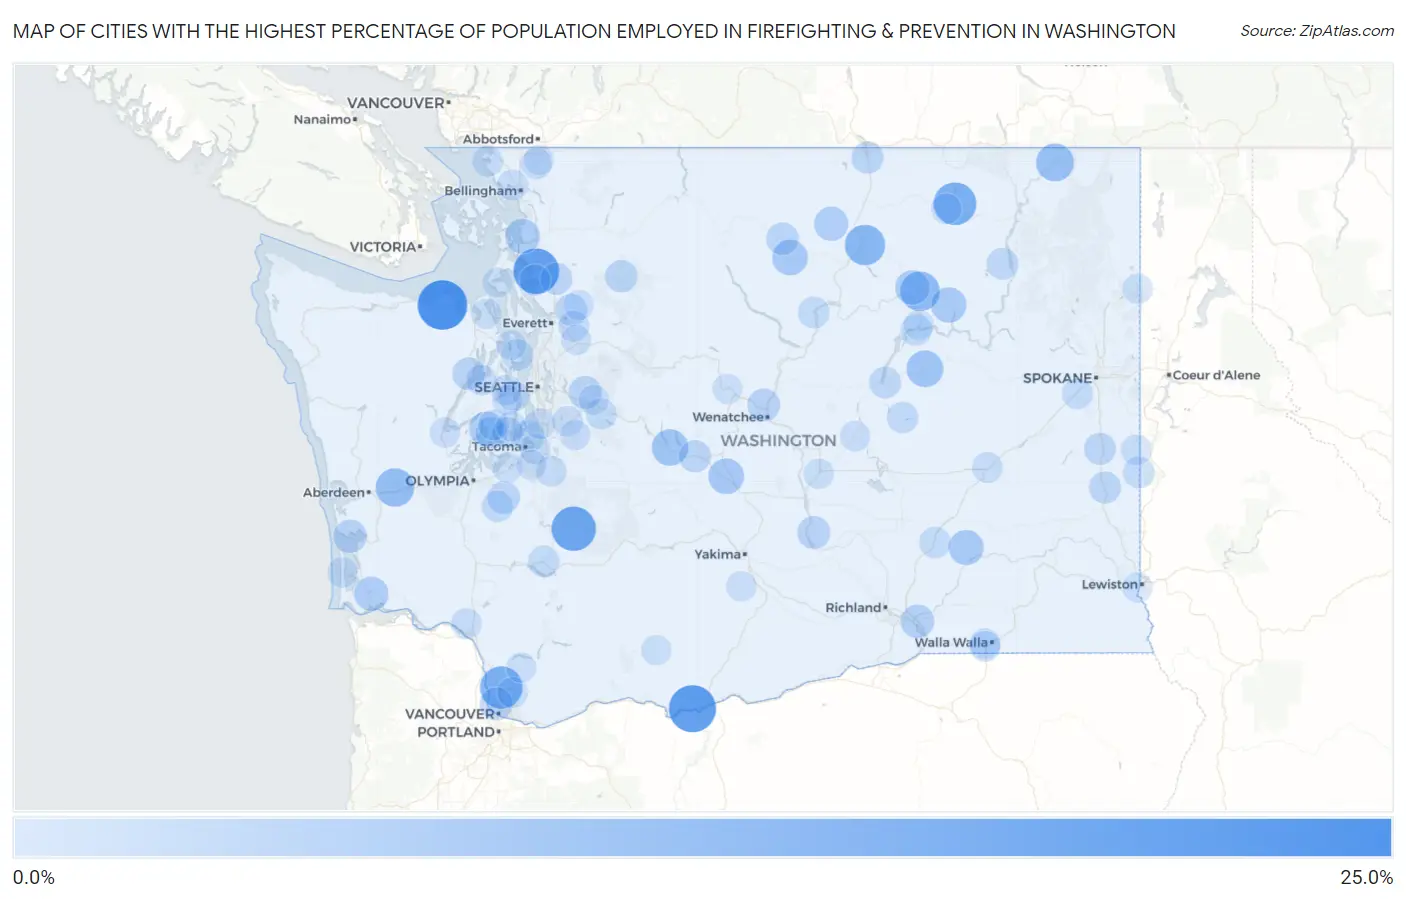
Map of Cities with the Highest Percentage of Population Employed in Firefighting & Prevention in Washington
0.0%
25.0%
Cities with the Highest Percentage of Population Employed in Firefighting & Prevention in Washington
| City | % Employed | vs State | vs National | |
| 1. | Carlsborg | 20.2% | 1.1%(+19.1)#1 | 1.2%(+19.0)#110 |
| 2. | Wishram | 18.0% | 1.1%(+16.8)#2 | 1.2%(+16.8)#137 |
| 3. | Lake Ketchum | 16.6% | 1.1%(+15.5)#3 | 1.2%(+15.4)#163 |
| 4. | Ashford | 15.4% | 1.1%(+14.2)#4 | 1.2%(+14.2)#195 |
| 5. | Torboy | 13.7% | 1.1%(+12.6)#5 | 1.2%(+12.6)#245 |
| 6. | Duluth | 13.5% | 1.1%(+12.4)#6 | 1.2%(+12.4)#253 |
| 7. | North Omak | 11.6% | 1.1%(+10.4)#7 | 1.2%(+10.4)#336 |
| 8. | Nespelem | 10.9% | 1.1%(+9.73)#8 | 1.2%(+9.68)#373 |
| 9. | Montesano | 9.8% | 1.1%(+8.63)#9 | 1.2%(+8.58)#441 |
| 10. | Northport | 9.3% | 1.1%(+8.12)#10 | 1.2%(+8.07)#475 |
| 11. | Almira | 8.3% | 1.1%(+7.20)#11 | 1.2%(+7.15)#571 |
| 12. | Easton | 8.1% | 1.1%(+6.97)#12 | 1.2%(+6.92)#603 |
| 13. | Thorp | 7.3% | 1.1%(+6.18)#13 | 1.2%(+6.13)#708 |
| 14. | Twisp | 7.2% | 1.1%(+6.09)#14 | 1.2%(+6.04)#720 |
| 15. | Keller | 7.0% | 1.1%(+5.86)#15 | 1.2%(+5.81)#761 |
| 16. | Kahlotus | 6.8% | 1.1%(+5.64)#16 | 1.2%(+5.59)#800 |
| 17. | Bay View | 6.6% | 1.1%(+5.43)#17 | 1.2%(+5.38)#838 |
| 18. | Nespelem Community | 6.4% | 1.1%(+5.23)#18 | 1.2%(+5.18)#878 |
| 19. | Vaughn | 6.2% | 1.1%(+5.06)#19 | 1.2%(+5.01)#908 |
| 20. | Naselle | 6.1% | 1.1%(+4.98)#20 | 1.2%(+4.93)#920 |
| 21. | Conconully | 6.0% | 1.1%(+4.83)#21 | 1.2%(+4.78)#965 |
| 22. | Burbank | 5.3% | 1.1%(+4.19)#22 | 1.2%(+4.14)#1,160 |
| 23. | Tokeland | 5.3% | 1.1%(+4.13)#23 | 1.2%(+4.08)#1,187 |
| 24. | Fall City | 5.0% | 1.1%(+3.85)#24 | 1.2%(+3.80)#1,281 |
| 25. | Mattawa | 4.9% | 1.1%(+3.80)#25 | 1.2%(+3.75)#1,298 |
| 26. | Lake Shore | 4.9% | 1.1%(+3.72)#26 | 1.2%(+3.67)#1,327 |
| 27. | Sunnyslope | 4.8% | 1.1%(+3.62)#27 | 1.2%(+3.57)#1,377 |
| 28. | Brinnon | 4.7% | 1.1%(+3.61)#28 | 1.2%(+3.56)#1,384 |
| 29. | Winthrop | 4.6% | 1.1%(+3.46)#29 | 1.2%(+3.41)#1,447 |
| 30. | Yelm | 4.6% | 1.1%(+3.43)#30 | 1.2%(+3.38)#1,460 |
| 31. | Darrington | 4.4% | 1.1%(+3.27)#31 | 1.2%(+3.22)#1,553 |
| 32. | Lochsloy | 4.3% | 1.1%(+3.15)#32 | 1.2%(+3.10)#1,627 |
| 33. | South Cle Elum | 4.2% | 1.1%(+3.03)#33 | 1.2%(+2.98)#1,684 |
| 34. | Steptoe | 4.2% | 1.1%(+3.03)#34 | 1.2%(+2.98)#1,690 |
| 35. | Bryant | 4.2% | 1.1%(+3.03)#35 | 1.2%(+2.98)#1,693 |
| 36. | Oroville | 4.2% | 1.1%(+3.02)#36 | 1.2%(+2.97)#1,694 |
| 37. | Rosalia | 4.1% | 1.1%(+2.98)#37 | 1.2%(+2.93)#1,714 |
| 38. | Key Center | 4.0% | 1.1%(+2.86)#38 | 1.2%(+2.81)#1,791 |
| 39. | Banks Lake South | 4.0% | 1.1%(+2.86)#39 | 1.2%(+2.81)#1,798 |
| 40. | Clear Lake Cdp Skagit County | 3.9% | 1.1%(+2.81)#40 | 1.2%(+2.76)#1,822 |
| 41. | Kingston | 3.9% | 1.1%(+2.74)#41 | 1.2%(+2.69)#1,869 |
| 42. | Inchelium | 3.8% | 1.1%(+2.71)#42 | 1.2%(+2.66)#1,886 |
| 43. | Rainier | 3.8% | 1.1%(+2.67)#43 | 1.2%(+2.62)#1,925 |
| 44. | Dash Point | 3.8% | 1.1%(+2.65)#44 | 1.2%(+2.60)#1,943 |
| 45. | Pateros | 3.7% | 1.1%(+2.58)#45 | 1.2%(+2.53)#1,995 |
| 46. | Connell | 3.7% | 1.1%(+2.56)#46 | 1.2%(+2.51)#2,024 |
| 47. | Kitsap Lake | 3.7% | 1.1%(+2.53)#47 | 1.2%(+2.48)#2,055 |
| 48. | Grand Coulee | 3.6% | 1.1%(+2.44)#48 | 1.2%(+2.39)#2,139 |
| 49. | Wilson Creek | 3.6% | 1.1%(+2.44)#49 | 1.2%(+2.39)#2,144 |
| 50. | Farmington | 3.6% | 1.1%(+2.44)#50 | 1.2%(+2.39)#2,145 |
| 51. | Morton | 3.5% | 1.1%(+2.41)#51 | 1.2%(+2.36)#2,163 |
| 52. | Gig Harbor | 3.4% | 1.1%(+2.24)#52 | 1.2%(+2.19)#2,342 |
| 53. | Stanwood | 3.3% | 1.1%(+2.15)#53 | 1.2%(+2.10)#2,428 |
| 54. | Wilderness Rim | 3.3% | 1.1%(+2.12)#54 | 1.2%(+2.07)#2,477 |
| 55. | Four Lakes | 3.2% | 1.1%(+2.10)#55 | 1.2%(+2.05)#2,497 |
| 56. | Fife | 3.2% | 1.1%(+2.07)#56 | 1.2%(+2.02)#2,536 |
| 57. | Snohomish | 3.2% | 1.1%(+2.06)#57 | 1.2%(+2.01)#2,545 |
| 58. | Marietta Alderwood | 3.2% | 1.1%(+2.05)#58 | 1.2%(+2.00)#2,556 |
| 59. | Birch Bay | 3.2% | 1.1%(+2.02)#59 | 1.2%(+1.97)#2,580 |
| 60. | Longview Heights | 3.1% | 1.1%(+1.97)#60 | 1.2%(+1.92)#2,625 |
| 61. | Everson | 3.1% | 1.1%(+1.96)#61 | 1.2%(+1.91)#2,638 |
| 62. | Ritzville | 3.1% | 1.1%(+1.95)#62 | 1.2%(+1.90)#2,651 |
| 63. | Garrett | 3.0% | 1.1%(+1.91)#63 | 1.2%(+1.86)#2,705 |
| 64. | Meadow Glade | 3.0% | 1.1%(+1.87)#64 | 1.2%(+1.82)#2,766 |
| 65. | College Place | 3.0% | 1.1%(+1.86)#65 | 1.2%(+1.81)#2,769 |
| 66. | Des Moines | 3.0% | 1.1%(+1.86)#66 | 1.2%(+1.81)#2,777 |
| 67. | Stansberry Lake | 3.0% | 1.1%(+1.84)#67 | 1.2%(+1.79)#2,811 |
| 68. | Orting | 3.0% | 1.1%(+1.84)#68 | 1.2%(+1.79)#2,814 |
| 69. | Tekoa | 3.0% | 1.1%(+1.83)#69 | 1.2%(+1.78)#2,827 |
| 70. | Beacon Hill | 2.9% | 1.1%(+1.80)#70 | 1.2%(+1.75)#2,873 |
| 71. | Seabeck | 2.9% | 1.1%(+1.78)#71 | 1.2%(+1.73)#2,895 |
| 72. | Republic | 2.9% | 1.1%(+1.72)#72 | 1.2%(+1.67)#2,957 |
| 73. | Manchester | 2.9% | 1.1%(+1.72)#73 | 1.2%(+1.67)#2,976 |
| 74. | Shadow Lake | 2.8% | 1.1%(+1.70)#74 | 1.2%(+1.65)#2,986 |
| 75. | Ocean Park | 2.8% | 1.1%(+1.69)#75 | 1.2%(+1.64)#3,013 |
| 76. | Ephrata | 2.8% | 1.1%(+1.67)#76 | 1.2%(+1.62)#3,023 |
| 77. | Enetai | 2.7% | 1.1%(+1.58)#77 | 1.2%(+1.53)#3,167 |
| 78. | Parkwood | 2.7% | 1.1%(+1.56)#78 | 1.2%(+1.51)#3,206 |
| 79. | Black Diamond | 2.7% | 1.1%(+1.55)#79 | 1.2%(+1.50)#3,217 |
| 80. | Skokomish | 2.7% | 1.1%(+1.54)#80 | 1.2%(+1.49)#3,224 |
| 81. | Newport | 2.7% | 1.1%(+1.53)#81 | 1.2%(+1.48)#3,250 |
| 82. | Port Hadlock Irondale | 2.7% | 1.1%(+1.52)#82 | 1.2%(+1.47)#3,257 |
| 83. | Glenwood | 2.7% | 1.1%(+1.52)#83 | 1.2%(+1.47)#3,263 |
| 84. | George | 2.6% | 1.1%(+1.50)#84 | 1.2%(+1.45)#3,284 |
| 85. | Harrah | 2.6% | 1.1%(+1.48)#85 | 1.2%(+1.43)#3,326 |
| 86. | Suncrest | 2.6% | 1.1%(+1.48)#86 | 1.2%(+1.43)#3,328 |
| 87. | Granite Falls | 2.6% | 1.1%(+1.48)#87 | 1.2%(+1.43)#3,329 |
| 88. | Maplewood | 2.6% | 1.1%(+1.47)#88 | 1.2%(+1.42)#3,333 |
| 89. | Roche Harbor | 2.6% | 1.1%(+1.47)#89 | 1.2%(+1.42)#3,340 |
| 90. | Port Gamble Tribal Community | 2.6% | 1.1%(+1.46)#90 | 1.2%(+1.41)#3,372 |
| 91. | Coupeville | 2.6% | 1.1%(+1.43)#91 | 1.2%(+1.38)#3,419 |
| 92. | North Fort Lewis | 2.6% | 1.1%(+1.42)#92 | 1.2%(+1.37)#3,440 |
| 93. | West Clarkston Highland | 2.6% | 1.1%(+1.42)#93 | 1.2%(+1.37)#3,448 |
| 94. | Monroe North | 2.5% | 1.1%(+1.40)#94 | 1.2%(+1.35)#3,488 |
| 95. | Coulee Dam | 2.5% | 1.1%(+1.39)#95 | 1.2%(+1.34)#3,511 |
| 96. | Leavenworth | 2.5% | 1.1%(+1.38)#96 | 1.2%(+1.33)#3,531 |
| 97. | Clover Creek | 2.5% | 1.1%(+1.36)#97 | 1.2%(+1.31)#3,569 |
| 98. | Amboy | 2.5% | 1.1%(+1.36)#98 | 1.2%(+1.31)#3,573 |
| 99. | Snoqualmie | 2.5% | 1.1%(+1.35)#99 | 1.2%(+1.30)#3,591 |
| 100. | Nooksack | 2.5% | 1.1%(+1.34)#100 | 1.2%(+1.29)#3,598 |
Common Questions
What are the Top 10 Cities with the Highest Percentage of Population Employed in Firefighting & Prevention in Washington?
Top 10 Cities with the Highest Percentage of Population Employed in Firefighting & Prevention in Washington are:
#1
20.2%
#2
18.0%
#3
16.6%
#4
15.4%
#5
13.7%
#6
13.5%
#7
11.6%
#8
10.9%
#9
9.8%
#10
9.3%
What city has the Highest Percentage of Population Employed in Firefighting & Prevention in Washington?
Carlsborg has the Highest Percentage of Population Employed in Firefighting & Prevention in Washington with 20.2%.
What is the Percentage of Population Employed in Firefighting & Prevention in the State of Washington?
Percentage of Population Employed in Firefighting & Prevention in Washington is 1.1%.
What is the Percentage of Population Employed in Firefighting & Prevention in the United States?
Percentage of Population Employed in Firefighting & Prevention in the United States is 1.2%.