Cities with the Highest Percentage of Immigrants from Northern Europe in Washington
RELATED REPORTS & OPTIONS
Northern Europe
Washington
Compare Cities
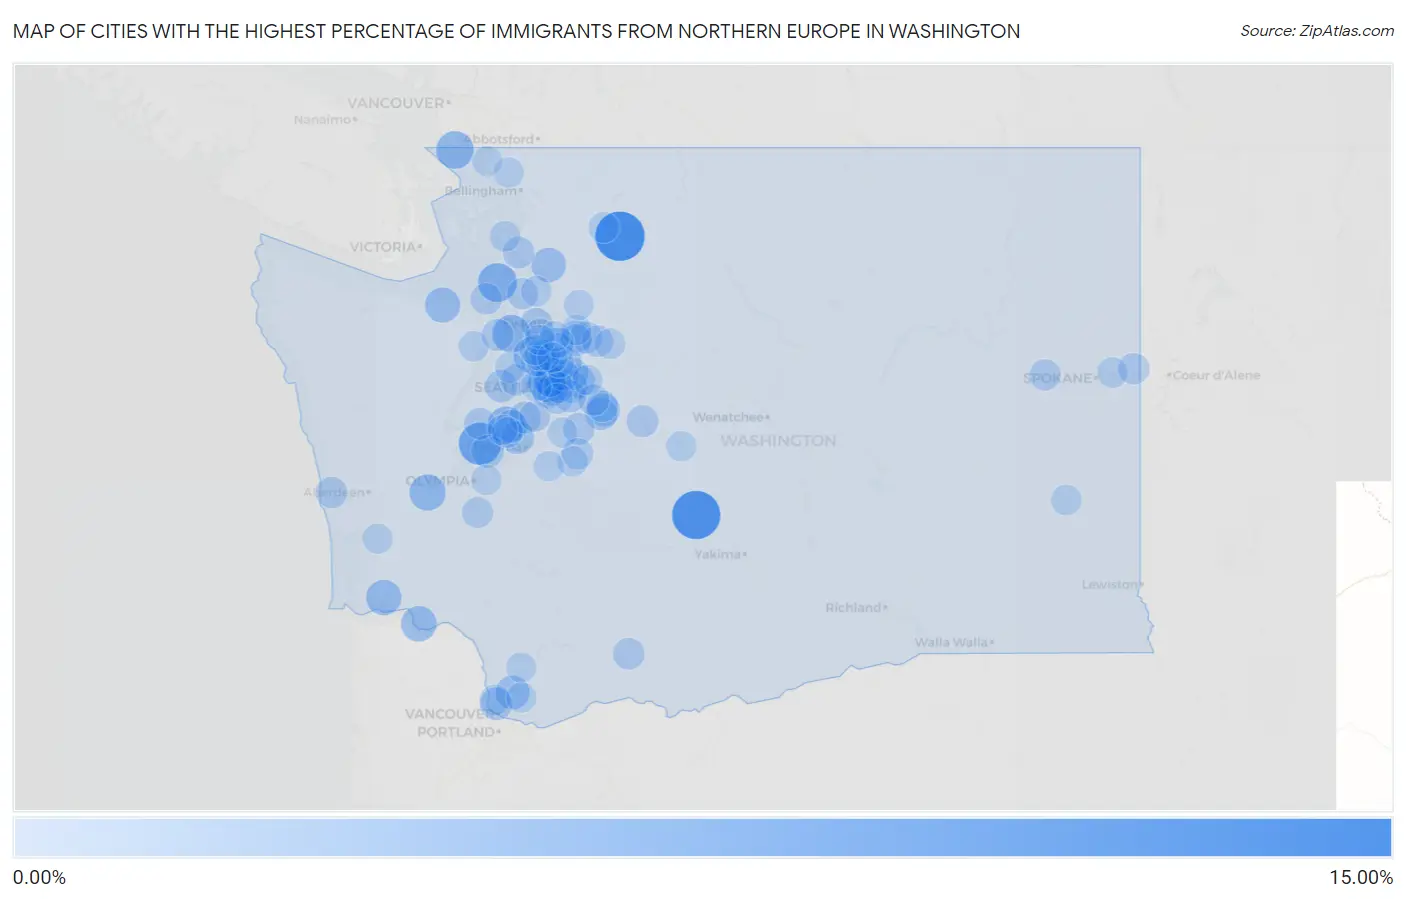
Map of Cities with the Highest Percentage of Immigrants from Northern Europe in Washington
0.00%
15.00%
Cities with the Highest Percentage of Immigrants from Northern Europe in Washington
| City | Northern Europe | vs State | vs National | |
| 1. | Rockport | 10.17% | 0.42%(+9.75)#1 | 0.29%(+9.88)#31 |
| 2. | Nile | 9.57% | 0.42%(+9.15)#2 | 0.29%(+9.28)#35 |
| 3. | Herron Island | 6.56% | 0.42%(+6.14)#3 | 0.29%(+6.27)#62 |
| 4. | Medina | 4.93% | 0.42%(+4.51)#4 | 0.29%(+4.64)#95 |
| 5. | Coupeville | 4.90% | 0.42%(+4.49)#5 | 0.29%(+4.62)#96 |
| 6. | Hansville | 4.31% | 0.42%(+3.90)#6 | 0.29%(+4.03)#134 |
| 7. | Point Roberts | 4.24% | 0.42%(+3.83)#7 | 0.29%(+3.96)#141 |
| 8. | Canterwood | 4.01% | 0.42%(+3.60)#8 | 0.29%(+3.73)#161 |
| 9. | Malone | 3.52% | 0.42%(+3.10)#9 | 0.29%(+3.23)#214 |
| 10. | Woodway | 3.40% | 0.42%(+2.98)#10 | 0.29%(+3.11)#224 |
| 11. | Puget Island | 3.22% | 0.42%(+2.80)#11 | 0.29%(+2.93)#242 |
| 12. | Deep River | 3.14% | 0.42%(+2.73)#12 | 0.29%(+2.86)#252 |
| 13. | Carlsborg | 3.00% | 0.42%(+2.59)#13 | 0.29%(+2.72)#278 |
| 14. | Roche Harbor | 2.79% | 0.42%(+2.37)#14 | 0.29%(+2.50)#319 |
| 15. | Hunts Point | 2.79% | 0.42%(+2.37)#15 | 0.29%(+2.50)#322 |
| 16. | Lake Mcmurray | 2.75% | 0.42%(+2.33)#16 | 0.29%(+2.46)#329 |
| 17. | Meadow Glade | 2.47% | 0.42%(+2.05)#17 | 0.29%(+2.18)#394 |
| 18. | Yarrow Point | 2.19% | 0.42%(+1.77)#18 | 0.29%(+1.90)#463 |
| 19. | Ruston | 2.13% | 0.42%(+1.71)#19 | 0.29%(+1.84)#480 |
| 20. | Ames Lake | 1.99% | 0.42%(+1.57)#20 | 0.29%(+1.70)#540 |
| 21. | Riverbend | 1.96% | 0.42%(+1.54)#21 | 0.29%(+1.67)#559 |
| 22. | Wilderness Rim | 1.87% | 0.42%(+1.45)#22 | 0.29%(+1.58)#595 |
| 23. | Sammamish | 1.85% | 0.42%(+1.43)#23 | 0.29%(+1.56)#607 |
| 24. | Lake Shore | 1.84% | 0.42%(+1.42)#24 | 0.29%(+1.55)#611 |
| 25. | Longbranch | 1.79% | 0.42%(+1.37)#25 | 0.29%(+1.50)#635 |
| 26. | Tracyton | 1.76% | 0.42%(+1.35)#26 | 0.29%(+1.48)#647 |
| 27. | Maplewood | 1.76% | 0.42%(+1.34)#27 | 0.29%(+1.47)#652 |
| 28. | Union Hill Novelty Hill | 1.70% | 0.42%(+1.28)#28 | 0.29%(+1.41)#682 |
| 29. | Mercer Island | 1.60% | 0.42%(+1.19)#29 | 0.29%(+1.32)#749 |
| 30. | Issaquah | 1.55% | 0.42%(+1.13)#30 | 0.29%(+1.26)#785 |
| 31. | Vashon | 1.47% | 0.42%(+1.06)#31 | 0.29%(+1.19)#850 |
| 32. | Woods Creek | 1.43% | 0.42%(+1.02)#32 | 0.29%(+1.15)#882 |
| 33. | Snoqualmie Pass | 1.43% | 0.42%(+1.01)#33 | 0.29%(+1.14)#885 |
| 34. | Port Ludlow | 1.42% | 0.42%(+1.01)#34 | 0.29%(+1.14)#890 |
| 35. | La Conner | 1.40% | 0.42%(+0.984)#35 | 0.29%(+1.11)#909 |
| 36. | Clinton | 1.37% | 0.42%(+0.958)#36 | 0.29%(+1.09)#931 |
| 37. | Ravensdale | 1.35% | 0.42%(+0.936)#37 | 0.29%(+1.07)#955 |
| 38. | Mill Creek | 1.35% | 0.42%(+0.936)#38 | 0.29%(+1.07)#956 |
| 39. | Chain Lake | 1.35% | 0.42%(+0.932)#39 | 0.29%(+1.06)#958 |
| 40. | Trout Lake | 1.34% | 0.42%(+0.923)#40 | 0.29%(+1.05)#968 |
| 41. | Allyn | 1.33% | 0.42%(+0.918)#41 | 0.29%(+1.05)#974 |
| 42. | Kenmore | 1.33% | 0.42%(+0.910)#42 | 0.29%(+1.04)#984 |
| 43. | Lake Forest Park | 1.30% | 0.42%(+0.884)#43 | 0.29%(+1.01)#1,010 |
| 44. | Monroe North | 1.28% | 0.42%(+0.861)#44 | 0.29%(+0.991)#1,035 |
| 45. | Sultan | 1.26% | 0.42%(+0.848)#45 | 0.29%(+0.978)#1,050 |
| 46. | North Bend | 1.26% | 0.42%(+0.843)#46 | 0.29%(+0.973)#1,063 |
| 47. | Kirkland | 1.24% | 0.42%(+0.824)#47 | 0.29%(+0.955)#1,077 |
| 48. | Ocean Shores | 1.23% | 0.42%(+0.813)#48 | 0.29%(+0.943)#1,100 |
| 49. | Bainbridge Island | 1.22% | 0.42%(+0.800)#49 | 0.29%(+0.930)#1,114 |
| 50. | Cottage Lake | 1.21% | 0.42%(+0.790)#50 | 0.29%(+0.920)#1,124 |
| 51. | Clearview | 1.20% | 0.42%(+0.780)#51 | 0.29%(+0.910)#1,139 |
| 52. | Enumclaw | 1.20% | 0.42%(+0.780)#52 | 0.29%(+0.910)#1,141 |
| 53. | Mountlake Terrace | 1.19% | 0.42%(+0.774)#53 | 0.29%(+0.904)#1,148 |
| 54. | Otis Orchards East Farms | 1.18% | 0.42%(+0.760)#54 | 0.29%(+0.890)#1,172 |
| 55. | Port Townsend | 1.17% | 0.42%(+0.756)#55 | 0.29%(+0.886)#1,178 |
| 56. | Beaux Arts Village | 1.16% | 0.42%(+0.747)#56 | 0.29%(+0.877)#1,192 |
| 57. | Clyde Hill | 1.16% | 0.42%(+0.743)#57 | 0.29%(+0.873)#1,196 |
| 58. | Camano | 1.16% | 0.42%(+0.741)#58 | 0.29%(+0.871)#1,198 |
| 59. | Reardan | 1.15% | 0.42%(+0.730)#59 | 0.29%(+0.860)#1,216 |
| 60. | Snoqualmie | 1.13% | 0.42%(+0.718)#60 | 0.29%(+0.848)#1,231 |
| 61. | Tenino | 1.08% | 0.42%(+0.660)#61 | 0.29%(+0.790)#1,321 |
| 62. | Redmond | 1.02% | 0.42%(+0.604)#62 | 0.29%(+0.735)#1,438 |
| 63. | Normandy Park | 0.99% | 0.42%(+0.570)#63 | 0.29%(+0.700)#1,503 |
| 64. | Bellevue | 0.95% | 0.42%(+0.536)#64 | 0.29%(+0.666)#1,582 |
| 65. | Felida | 0.88% | 0.42%(+0.468)#65 | 0.29%(+0.599)#1,723 |
| 66. | Concrete | 0.88% | 0.42%(+0.468)#66 | 0.29%(+0.598)#1,724 |
| 67. | Anacortes | 0.88% | 0.42%(+0.462)#67 | 0.29%(+0.592)#1,735 |
| 68. | Tehaleh | 0.87% | 0.42%(+0.457)#68 | 0.29%(+0.587)#1,748 |
| 69. | Buckley | 0.87% | 0.42%(+0.451)#69 | 0.29%(+0.581)#1,765 |
| 70. | Warm Beach | 0.86% | 0.42%(+0.440)#70 | 0.29%(+0.570)#1,806 |
| 71. | Millwood | 0.83% | 0.42%(+0.413)#71 | 0.29%(+0.544)#1,879 |
| 72. | Quilcene | 0.82% | 0.42%(+0.404)#72 | 0.29%(+0.534)#1,908 |
| 73. | Gold Bar | 0.81% | 0.42%(+0.397)#73 | 0.29%(+0.527)#1,928 |
| 74. | Endicott | 0.79% | 0.42%(+0.378)#74 | 0.29%(+0.508)#1,980 |
| 75. | Newcastle | 0.78% | 0.42%(+0.365)#75 | 0.29%(+0.496)#2,021 |
| 76. | Gig Harbor | 0.78% | 0.42%(+0.365)#76 | 0.29%(+0.495)#2,023 |
| 77. | Woodinville | 0.76% | 0.42%(+0.344)#77 | 0.29%(+0.474)#2,079 |
| 78. | Mcmillin | 0.75% | 0.42%(+0.338)#78 | 0.29%(+0.468)#2,096 |
| 79. | Brier | 0.75% | 0.42%(+0.334)#79 | 0.29%(+0.464)#2,111 |
| 80. | Seattle | 0.73% | 0.42%(+0.316)#80 | 0.29%(+0.446)#2,158 |
| 81. | Three Lakes | 0.73% | 0.42%(+0.312)#81 | 0.29%(+0.443)#2,169 |
| 82. | Roslyn | 0.73% | 0.42%(+0.310)#82 | 0.29%(+0.440)#2,173 |
| 83. | Shoreline | 0.72% | 0.42%(+0.305)#83 | 0.29%(+0.436)#2,190 |
| 84. | Tanglewilde | 0.69% | 0.42%(+0.271)#84 | 0.29%(+0.401)#2,302 |
| 85. | Granite Falls | 0.68% | 0.42%(+0.263)#85 | 0.29%(+0.393)#2,332 |
| 86. | Carnation | 0.68% | 0.42%(+0.260)#86 | 0.29%(+0.391)#2,339 |
| 87. | Suquamish | 0.67% | 0.42%(+0.254)#87 | 0.29%(+0.385)#2,367 |
| 88. | Edmonds | 0.67% | 0.42%(+0.254)#88 | 0.29%(+0.384)#2,368 |
| 89. | Lake Morton Berrydale | 0.64% | 0.42%(+0.225)#89 | 0.29%(+0.355)#2,474 |
| 90. | Silver Firs | 0.63% | 0.42%(+0.219)#90 | 0.29%(+0.349)#2,494 |
| 91. | Mukilteo | 0.63% | 0.42%(+0.216)#91 | 0.29%(+0.346)#2,504 |
| 92. | Ferndale | 0.63% | 0.42%(+0.212)#92 | 0.29%(+0.343)#2,520 |
| 93. | Eastmont | 0.63% | 0.42%(+0.210)#93 | 0.29%(+0.340)#2,529 |
| 94. | Raymond | 0.61% | 0.42%(+0.199)#94 | 0.29%(+0.329)#2,583 |
| 95. | Picnic Point | 0.60% | 0.42%(+0.187)#95 | 0.29%(+0.318)#2,634 |
| 96. | Hockinson | 0.60% | 0.42%(+0.184)#96 | 0.29%(+0.315)#2,643 |
| 97. | Amboy | 0.60% | 0.42%(+0.180)#97 | 0.29%(+0.310)#2,668 |
| 98. | Birch Bay | 0.59% | 0.42%(+0.177)#98 | 0.29%(+0.307)#2,684 |
| 99. | Bothell | 0.59% | 0.42%(+0.173)#99 | 0.29%(+0.303)#2,700 |
| 100. | Rosedale | 0.59% | 0.42%(+0.169)#100 | 0.29%(+0.300)#2,720 |
Common Questions
What are the Top 10 Cities with the Highest Percentage of Immigrants from Northern Europe in Washington?
Top 10 Cities with the Highest Percentage of Immigrants from Northern Europe in Washington are:
#1
10.17%
#2
9.57%
#3
6.56%
#4
4.93%
#5
4.90%
#6
4.31%
#7
4.24%
#8
4.01%
#9
3.52%
#10
3.40%
What city has the Highest Percentage of Immigrants from Northern Europe in Washington?
Rockport has the Highest Percentage of Immigrants from Northern Europe in Washington with 10.17%.
What is the Percentage of Immigrants from Northern Europe in the State of Washington?
Percentage of Immigrants from Northern Europe in Washington is 0.42%.
What is the Percentage of Immigrants from Northern Europe in the United States?
Percentage of Immigrants from Northern Europe in the United States is 0.29%.