Morton, WA Map & Demographics
Morton Map
Morton Overview
$26,056
PER CAPITA INCOME
$60,417
AVG FAMILY INCOME
$55,156
AVG HOUSEHOLD INCOME
41.4%
WAGE / INCOME GAP [ % ]
58.6¢/ $1
WAGE / INCOME GAP [ $ ]
0.41
INEQUALITY / GINI INDEX
1,333
TOTAL POPULATION
640
MALE POPULATION
693
FEMALE POPULATION
92.35
MALES / 100 FEMALES
108.28
FEMALES / 100 MALES
49.5
MEDIAN AGE
2.9
AVG FAMILY SIZE
2.5
AVG HOUSEHOLD SIZE
507
LABOR FORCE [ PEOPLE ]
45.9%
PERCENT IN LABOR FORCE
11.0%
UNEMPLOYMENT RATE
Morton Zip Codes
Morton Area Codes
Income in Morton
Income Overview in Morton
Per Capita Income in Morton is $26,056, while median incomes of families and households are $60,417 and $55,156 respectively.
| Characteristic | Number | Measure |
| Per Capita Income | 1,333 | $26,056 |
| Median Family Income | 351 | $60,417 |
| Mean Family Income | 351 | $78,577 |
| Median Household Income | 503 | $55,156 |
| Mean Household Income | 503 | $63,815 |
| Income Deficit | 351 | $0 |
| Wage / Income Gap (%) | 1,333 | 41.42% |
| Wage / Income Gap ($) | 1,333 | 58.58¢ per $1 |
| Gini / Inequality Index | 1,333 | 0.41 |
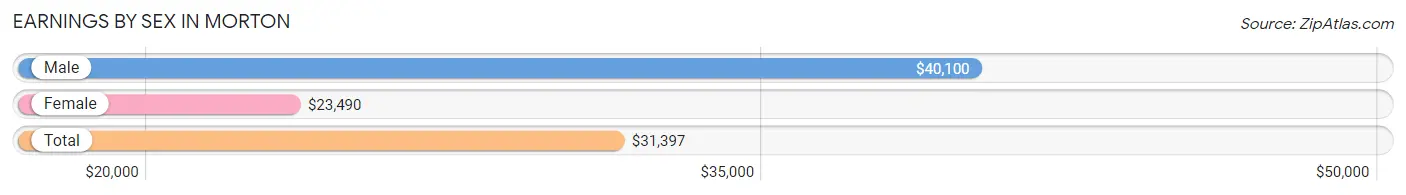
Earnings by Sex in Morton
Average Earnings in Morton are $31,397, $40,100 for men and $23,490 for women, a difference of 41.4%.
| Sex | Number | Average Earnings |
| Male | 270 (51.0%) | $40,100 |
| Female | 259 (49.0%) | $23,490 |
| Total | 529 (100.0%) | $31,397 |
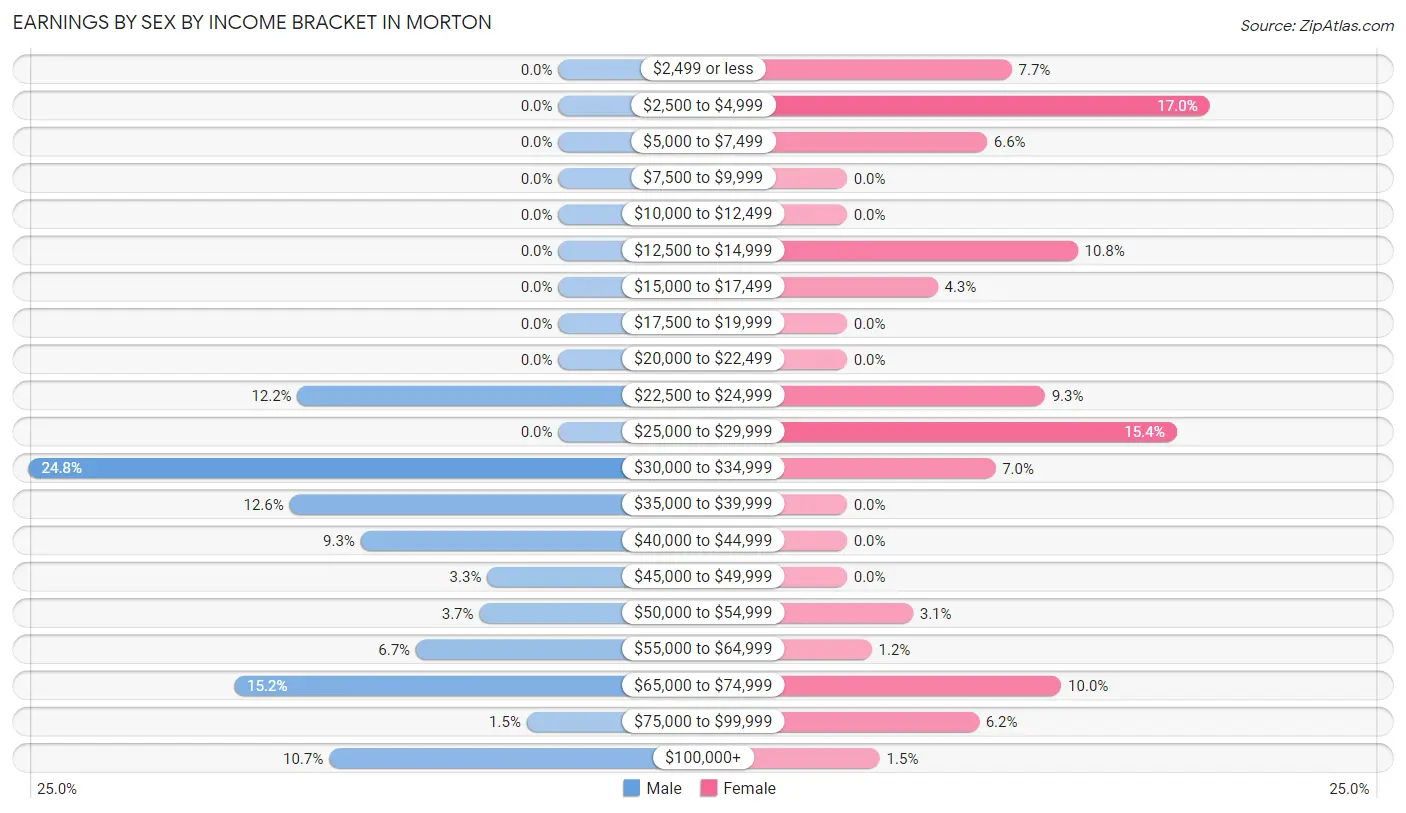
Earnings by Sex by Income Bracket in Morton
The most common earnings brackets in Morton are $30,000 to $34,999 for men (67 | 24.8%) and $2,500 to $4,999 for women (44 | 17.0%).
| Income | Male | Female |
| $2,499 or less | 0 (0.0%) | 20 (7.7%) |
| $2,500 to $4,999 | 0 (0.0%) | 44 (17.0%) |
| $5,000 to $7,499 | 0 (0.0%) | 17 (6.6%) |
| $7,500 to $9,999 | 0 (0.0%) | 0 (0.0%) |
| $10,000 to $12,499 | 0 (0.0%) | 0 (0.0%) |
| $12,500 to $14,999 | 0 (0.0%) | 28 (10.8%) |
| $15,000 to $17,499 | 0 (0.0%) | 11 (4.3%) |
| $17,500 to $19,999 | 0 (0.0%) | 0 (0.0%) |
| $20,000 to $22,499 | 0 (0.0%) | 0 (0.0%) |
| $22,500 to $24,999 | 33 (12.2%) | 24 (9.3%) |
| $25,000 to $29,999 | 0 (0.0%) | 40 (15.4%) |
| $30,000 to $34,999 | 67 (24.8%) | 18 (7.0%) |
| $35,000 to $39,999 | 34 (12.6%) | 0 (0.0%) |
| $40,000 to $44,999 | 25 (9.3%) | 0 (0.0%) |
| $45,000 to $49,999 | 9 (3.3%) | 0 (0.0%) |
| $50,000 to $54,999 | 10 (3.7%) | 8 (3.1%) |
| $55,000 to $64,999 | 18 (6.7%) | 3 (1.2%) |
| $65,000 to $74,999 | 41 (15.2%) | 26 (10.0%) |
| $75,000 to $99,999 | 4 (1.5%) | 16 (6.2%) |
| $100,000+ | 29 (10.7%) | 4 (1.5%) |
| Total | 270 (100.0%) | 259 (100.0%) |
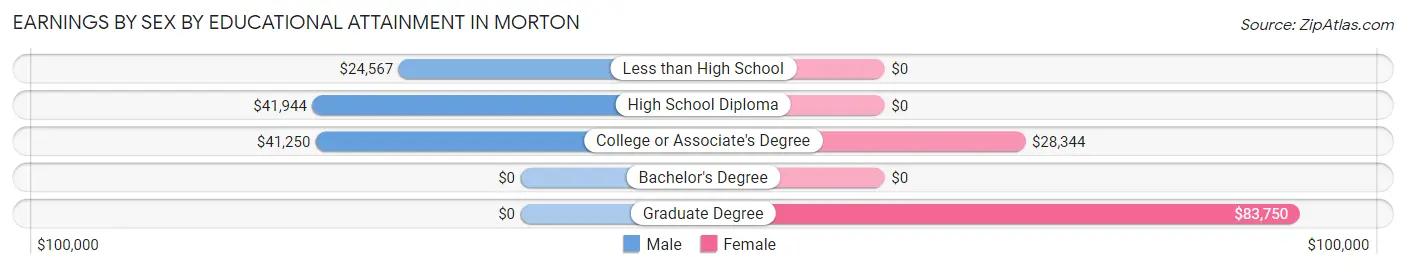
Earnings by Sex by Educational Attainment in Morton
| Educational Attainment | Male Income | Female Income |
| Less than High School | $24,567 | $0 |
| High School Diploma | $41,944 | $0 |
| College or Associate's Degree | $41,250 | $28,344 |
| Bachelor's Degree | - | - |
| Graduate Degree | - | - |
| Total | $41,000 | $0 |
Family Income in Morton
Family Income Brackets in Morton
According to the Morton family income data, there are 144 families falling into the $50,000 to $74,999 income range, which is the most common income bracket and makes up 41.0% of all families.
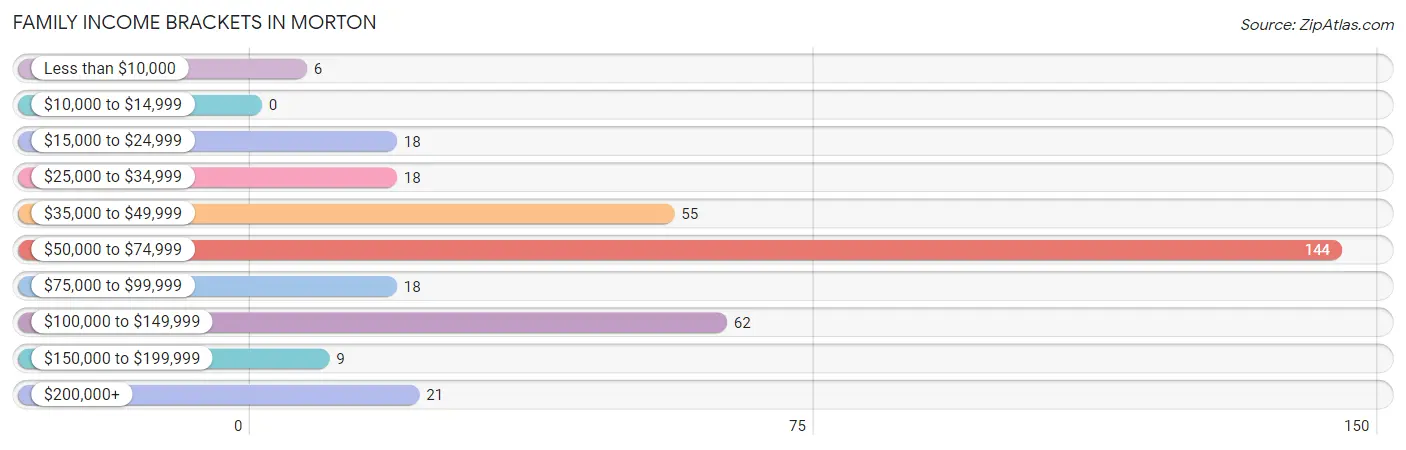
| Income Bracket | # Families | % Families |
| Less than $10,000 | 6 | 1.7% |
| $10,000 to $14,999 | 0 | 0.0% |
| $15,000 to $24,999 | 18 | 5.1% |
| $25,000 to $34,999 | 18 | 5.1% |
| $35,000 to $49,999 | 55 | 15.7% |
| $50,000 to $74,999 | 144 | 41.0% |
| $75,000 to $99,999 | 18 | 5.1% |
| $100,000 to $149,999 | 62 | 17.7% |
| $150,000 to $199,999 | 9 | 2.6% |
| $200,000+ | 21 | 6.0% |
Family Income by Famaliy Size in Morton
3-person families (38 | 10.8%) account for the highest median family income in Morton with $105,714 per family, while 3-person families (38 | 10.8%) have the highest median income of $35,238 per family member.
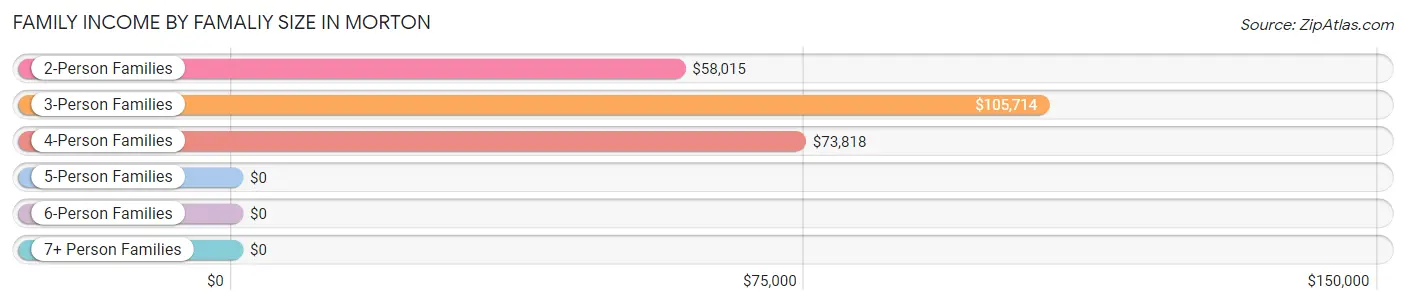
| Income Bracket | # Families | Median Income |
| 2-Person Families | 195 (55.6%) | $58,015 |
| 3-Person Families | 38 (10.8%) | $105,714 |
| 4-Person Families | 97 (27.6%) | $73,818 |
| 5-Person Families | 11 (3.1%) | $0 |
| 6-Person Families | 0 (0.0%) | $0 |
| 7+ Person Families | 10 (2.9%) | $0 |
| Total | 351 (100.0%) | $60,417 |
Family Income by Number of Earners in Morton
The median family income in Morton is $60,417, with families comprising 3+ earners (34) having the highest median family income of $143,333, while families with no earners (105) have the lowest median family income of $46,250, accounting for 9.7% and 29.9% of families, respectively.
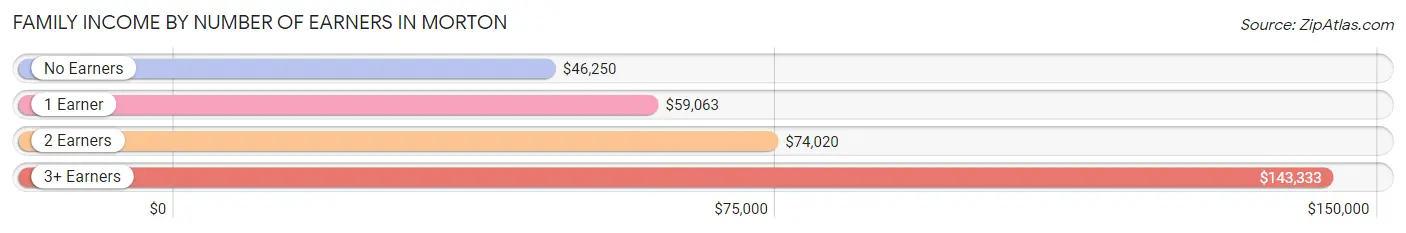
| Number of Earners | # Families | Median Income |
| No Earners | 105 (29.9%) | $46,250 |
| 1 Earner | 85 (24.2%) | $59,063 |
| 2 Earners | 127 (36.2%) | $74,020 |
| 3+ Earners | 34 (9.7%) | $143,333 |
| Total | 351 (100.0%) | $60,417 |
Household Income in Morton
Household Income Brackets in Morton
With 112 households falling in the category, the $50,000 to $74,999 income range is the most frequent in Morton, accounting for 22.3% of all households. In contrast, only 9 households (1.8%) fall into the $150,000 to $199,999 income bracket, making it the least populous group.
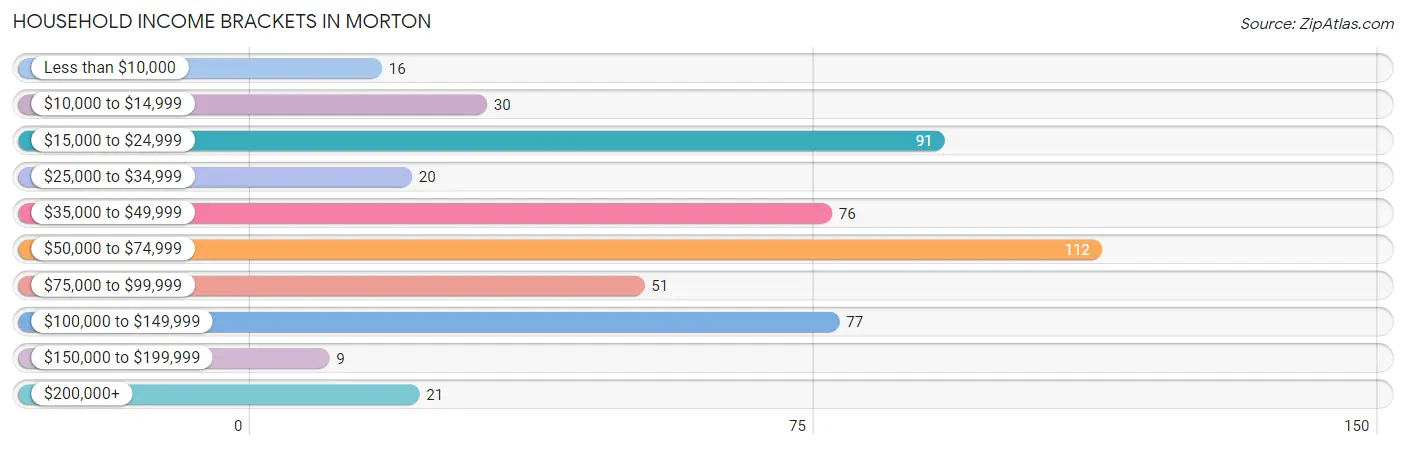
| Income Bracket | # Households | % Households |
| Less than $10,000 | 16 | 3.2% |
| $10,000 to $14,999 | 30 | 6.0% |
| $15,000 to $24,999 | 91 | 18.1% |
| $25,000 to $34,999 | 20 | 4.0% |
| $35,000 to $49,999 | 76 | 15.1% |
| $50,000 to $74,999 | 112 | 22.3% |
| $75,000 to $99,999 | 51 | 10.1% |
| $100,000 to $149,999 | 77 | 15.3% |
| $150,000 to $199,999 | 9 | 1.8% |
| $200,000+ | 21 | 4.2% |
Household Income by Householder Age in Morton
The median household income in Morton is $55,156, with the highest median household income of $75,236 found in the 25 to 44 years age bracket for the primary householder. A total of 137 households (27.2%) fall into this category. Meanwhile, the 15 to 24 years age bracket for the primary householder has the lowest median household income of $0, with 7 households (1.4%) in this group.
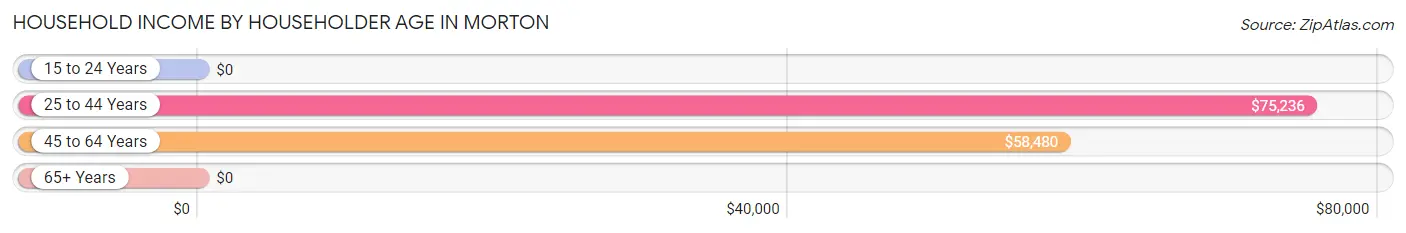
| Income Bracket | # Households | Median Income |
| 15 to 24 Years | 7 (1.4%) | $0 |
| 25 to 44 Years | 137 (27.2%) | $75,236 |
| 45 to 64 Years | 208 (41.3%) | $58,480 |
| 65+ Years | 151 (30.0%) | $0 |
| Total | 503 (100.0%) | $55,156 |
Poverty in Morton
Income Below Poverty by Sex and Age in Morton
With 8.3% poverty level for males and 18.8% for females among the residents of Morton, under 5 year old males and 16 and 17 year old females are the most vulnerable to poverty, with 6 males (28.6%) and 7 females (100.0%) in their respective age groups living below the poverty level.
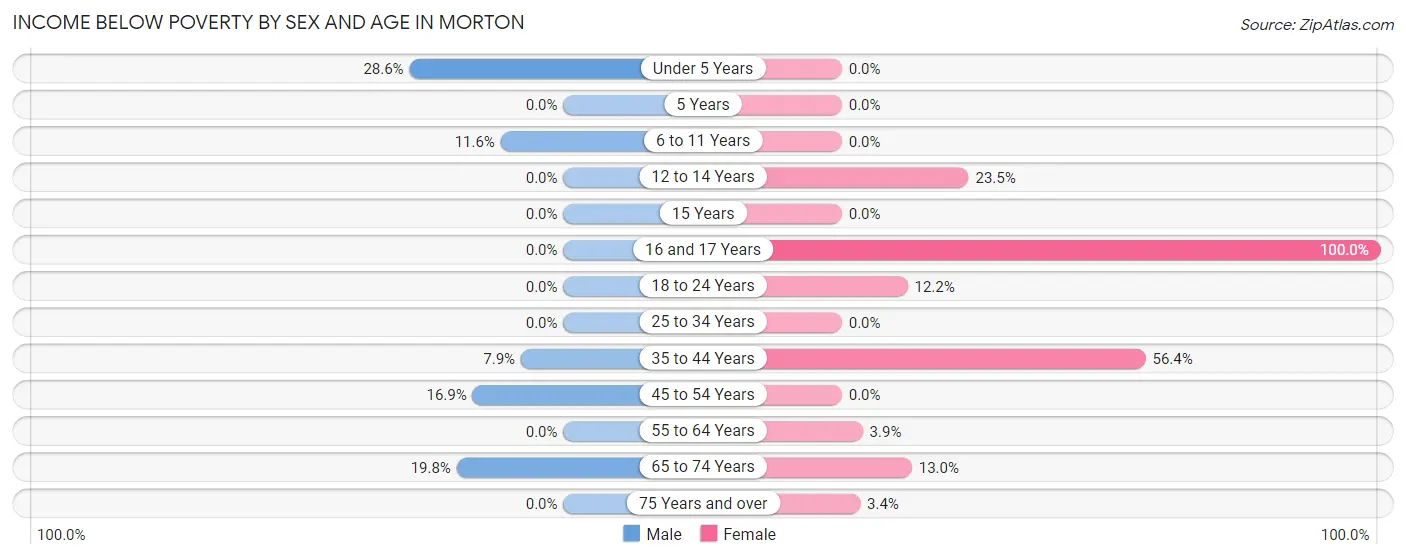
| Age Bracket | Male | Female |
| Under 5 Years | 6 (28.6%) | 0 (0.0%) |
| 5 Years | 0 (0.0%) | 0 (0.0%) |
| 6 to 11 Years | 5 (11.6%) | 0 (0.0%) |
| 12 to 14 Years | 0 (0.0%) | 4 (23.5%) |
| 15 Years | 0 (0.0%) | 0 (0.0%) |
| 16 and 17 Years | 0 (0.0%) | 7 (100.0%) |
| 18 to 24 Years | 0 (0.0%) | 5 (12.2%) |
| 25 to 34 Years | 0 (0.0%) | 0 (0.0%) |
| 35 to 44 Years | 7 (7.9%) | 84 (56.4%) |
| 45 to 54 Years | 15 (16.9%) | 0 (0.0%) |
| 55 to 64 Years | 0 (0.0%) | 6 (3.9%) |
| 65 to 74 Years | 20 (19.8%) | 10 (13.0%) |
| 75 Years and over | 0 (0.0%) | 2 (3.4%) |
| Total | 53 (8.3%) | 118 (18.8%) |
Income Above Poverty by Sex and Age in Morton
According to the poverty statistics in Morton, males aged 12 to 14 years and females aged 6 to 11 years are the age groups that are most secure financially, with 100.0% of males and 100.0% of females in these age groups living above the poverty line.
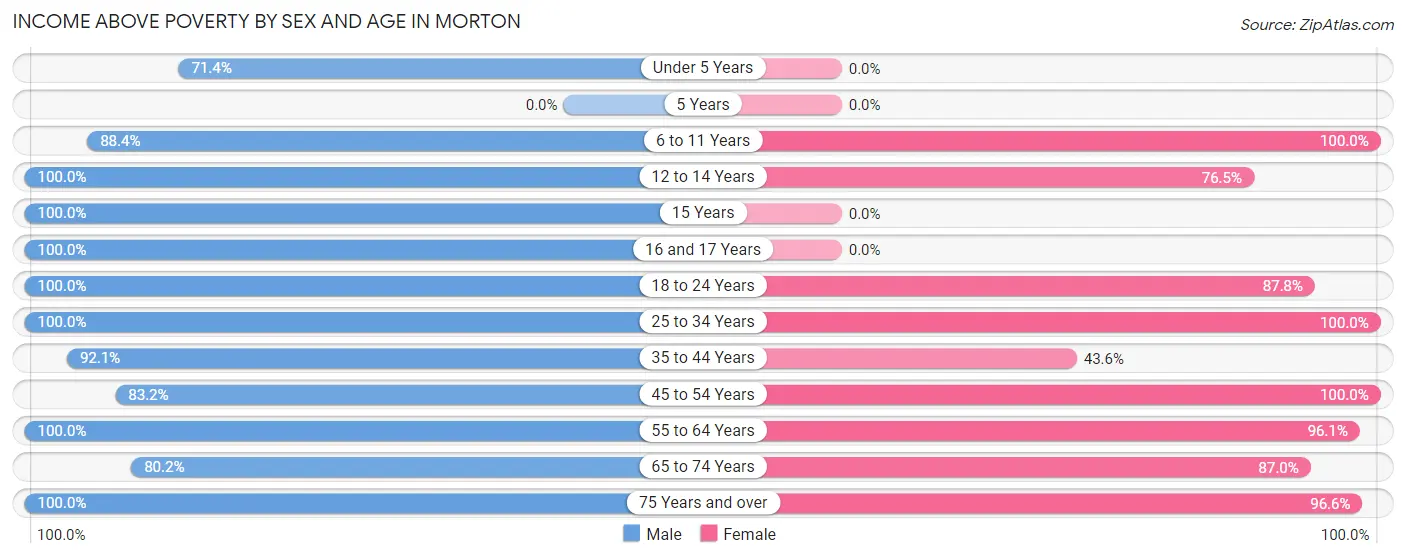
| Age Bracket | Male | Female |
| Under 5 Years | 15 (71.4%) | 0 (0.0%) |
| 5 Years | 0 (0.0%) | 0 (0.0%) |
| 6 to 11 Years | 38 (88.4%) | 54 (100.0%) |
| 12 to 14 Years | 58 (100.0%) | 13 (76.5%) |
| 15 Years | 25 (100.0%) | 0 (0.0%) |
| 16 and 17 Years | 8 (100.0%) | 0 (0.0%) |
| 18 to 24 Years | 30 (100.0%) | 36 (87.8%) |
| 25 to 34 Years | 38 (100.0%) | 38 (100.0%) |
| 35 to 44 Years | 82 (92.1%) | 65 (43.6%) |
| 45 to 54 Years | 74 (83.2%) | 31 (100.0%) |
| 55 to 64 Years | 105 (100.0%) | 149 (96.1%) |
| 65 to 74 Years | 81 (80.2%) | 67 (87.0%) |
| 75 Years and over | 29 (100.0%) | 57 (96.6%) |
| Total | 583 (91.7%) | 510 (81.2%) |
Income Below Poverty Among Married-Couple Families in Morton
The poverty statistics for married-couple families in Morton show that 2.5% or 7 of the total 277 families live below the poverty line. Families with 1 or 2 children have the highest poverty rate of 6.5%, comprising of 7 families. On the other hand, families with no children have the lowest poverty rate of 0.0%, which includes 0 families.
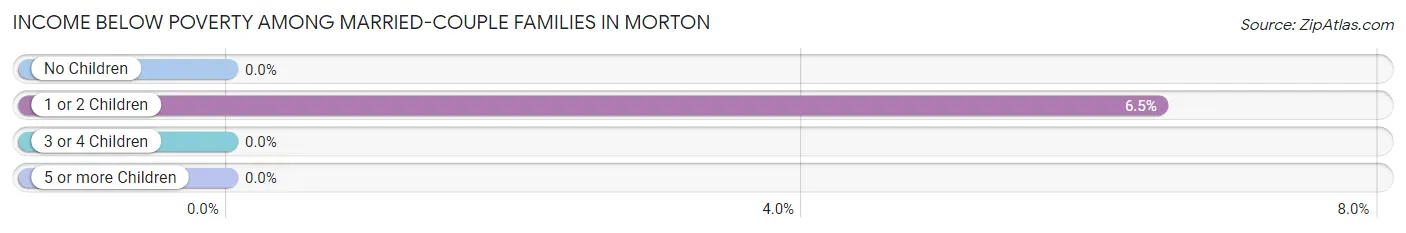
| Children | Above Poverty | Below Poverty |
| No Children | 158 (100.0%) | 0 (0.0%) |
| 1 or 2 Children | 101 (93.5%) | 7 (6.5%) |
| 3 or 4 Children | 11 (100.0%) | 0 (0.0%) |
| 5 or more Children | 0 (0.0%) | 0 (0.0%) |
| Total | 270 (97.5%) | 7 (2.5%) |
Income Below Poverty Among Single-Parent Households in Morton
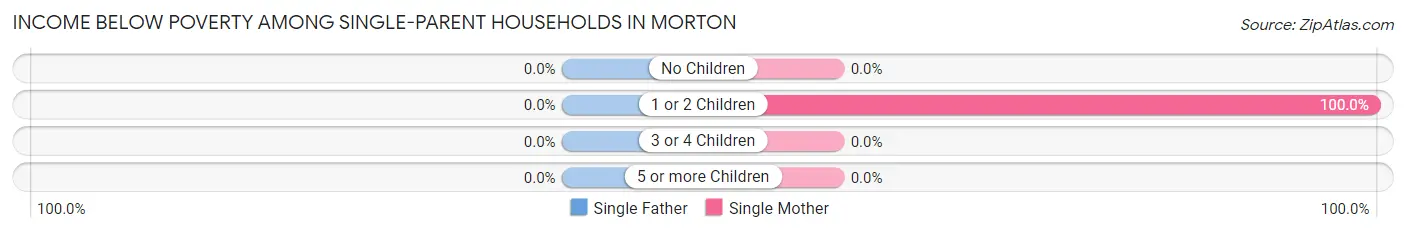
| Children | Single Father | Single Mother |
| No Children | 0 (0.0%) | 0 (0.0%) |
| 1 or 2 Children | 0 (0.0%) | 6 (100.0%) |
| 3 or 4 Children | 0 (0.0%) | 0 (0.0%) |
| 5 or more Children | 0 (0.0%) | 0 (0.0%) |
| Total | 0 (0.0%) | 6 (20.0%) |
Income Below Poverty Among Married-Couple vs Single-Parent Households in Morton
The poverty data for Morton shows that 7 of the married-couple family households (2.5%) and 6 of the single-parent households (8.1%) are living below the poverty level. Within the married-couple family households, those with 1 or 2 children have the highest poverty rate, with 7 households (6.5%) falling below the poverty line. Among the single-parent households, those with 1 or 2 children have the highest poverty rate, with 6 household (60.0%) living below poverty.
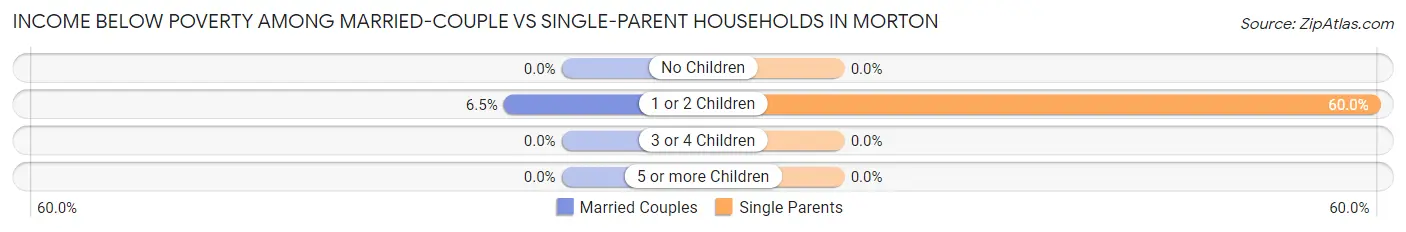
| Children | Married-Couple Families | Single-Parent Households |
| No Children | 0 (0.0%) | 0 (0.0%) |
| 1 or 2 Children | 7 (6.5%) | 6 (60.0%) |
| 3 or 4 Children | 0 (0.0%) | 0 (0.0%) |
| 5 or more Children | 0 (0.0%) | 0 (0.0%) |
| Total | 7 (2.5%) | 6 (8.1%) |
Race in Morton
The most populous races in Morton are White / Caucasian (1,081 | 81.1%), Hispanic or Latino (194 | 14.5%), and Two or more Races (174 | 13.1%).
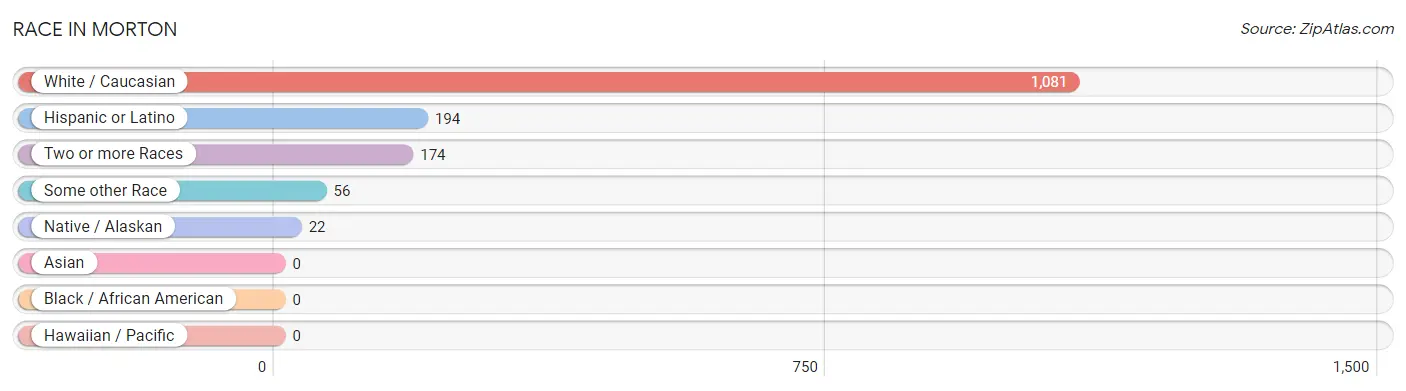
| Race | # Population | % Population |
| Asian | 0 | 0.0% |
| Black / African American | 0 | 0.0% |
| Hawaiian / Pacific | 0 | 0.0% |
| Hispanic or Latino | 194 | 14.5% |
| Native / Alaskan | 22 | 1.7% |
| White / Caucasian | 1,081 | 81.1% |
| Two or more Races | 174 | 13.1% |
| Some other Race | 56 | 4.2% |
| Total | 1,333 | 100.0% |
Ancestry in Morton
The most populous ancestries reported in Morton are German (274 | 20.6%), Irish (215 | 16.1%), Mexican (181 | 13.6%), American (130 | 9.8%), and English (130 | 9.8%), together accounting for 69.8% of all Morton residents.
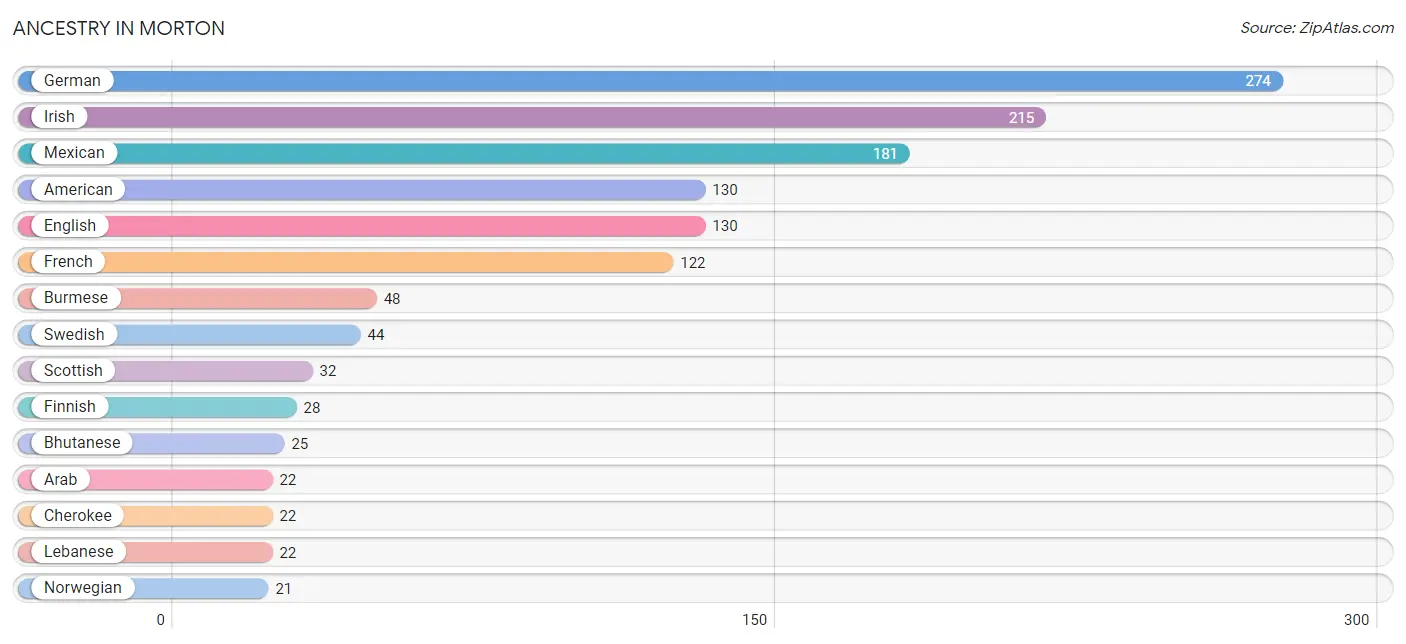
| Ancestry | # Population | % Population |
| American | 130 | 9.8% |
| Arab | 22 | 1.7% |
| Bhutanese | 25 | 1.9% |
| Blackfeet | 7 | 0.5% |
| Bulgarian | 11 | 0.8% |
| Burmese | 48 | 3.6% |
| Cherokee | 22 | 1.7% |
| Choctaw | 4 | 0.3% |
| Cuban | 13 | 1.0% |
| Dutch | 19 | 1.4% |
| English | 130 | 9.8% |
| European | 18 | 1.3% |
| Finnish | 28 | 2.1% |
| French | 122 | 9.1% |
| German | 274 | 20.6% |
| Irish | 215 | 16.1% |
| Lebanese | 22 | 1.7% |
| Mexican | 181 | 13.6% |
| Northern European | 8 | 0.6% |
| Norwegian | 21 | 1.6% |
| Polish | 21 | 1.6% |
| Russian | 8 | 0.6% |
| Scandinavian | 4 | 0.3% |
| Scottish | 32 | 2.4% |
| Swedish | 44 | 3.3% |
| Swiss | 8 | 0.6% |
| Tsimshian | 18 | 1.3% | View All 27 Rows |
Immigrants in Morton
The most numerous immigrant groups reported in Morton came from Latin America (44 | 3.3%), Central America (31 | 2.3%), Mexico (31 | 2.3%), Europe (19 | 1.4%), and Caribbean (13 | 1.0%), together accounting for 10.4% of all Morton residents.
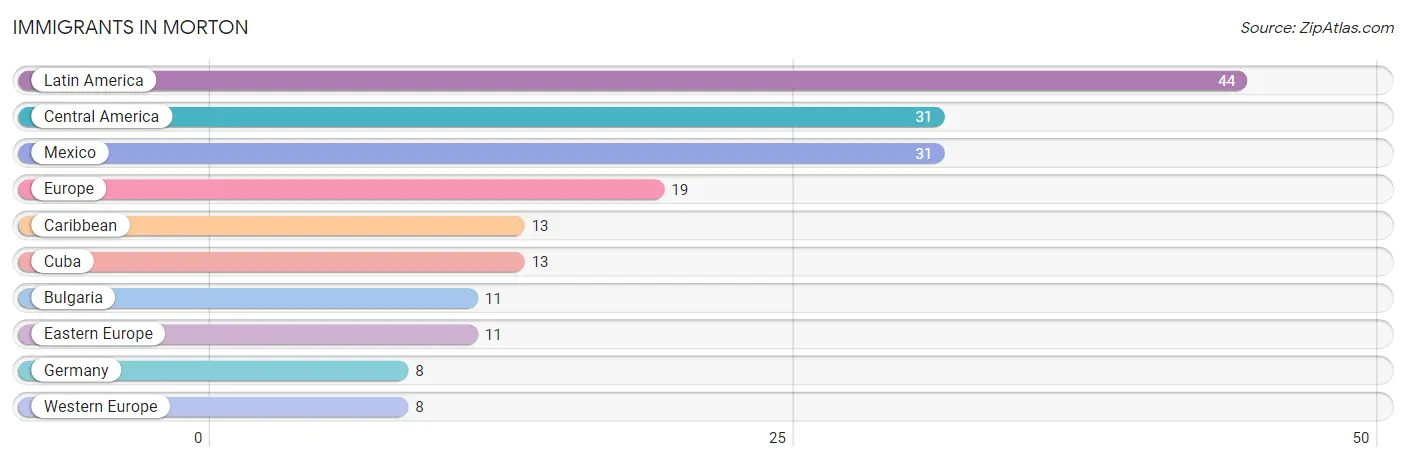
| Immigration Origin | # Population | % Population |
| Bulgaria | 11 | 0.8% |
| Caribbean | 13 | 1.0% |
| Central America | 31 | 2.3% |
| Cuba | 13 | 1.0% |
| Eastern Europe | 11 | 0.8% |
| Europe | 19 | 1.4% |
| Germany | 8 | 0.6% |
| Latin America | 44 | 3.3% |
| Mexico | 31 | 2.3% |
| Western Europe | 8 | 0.6% | View All 10 Rows |
Sex and Age in Morton
Sex and Age in Morton
The most populous age groups in Morton are 60 to 64 Years (105 | 16.4%) for men and 60 to 64 Years (138 | 19.9%) for women.
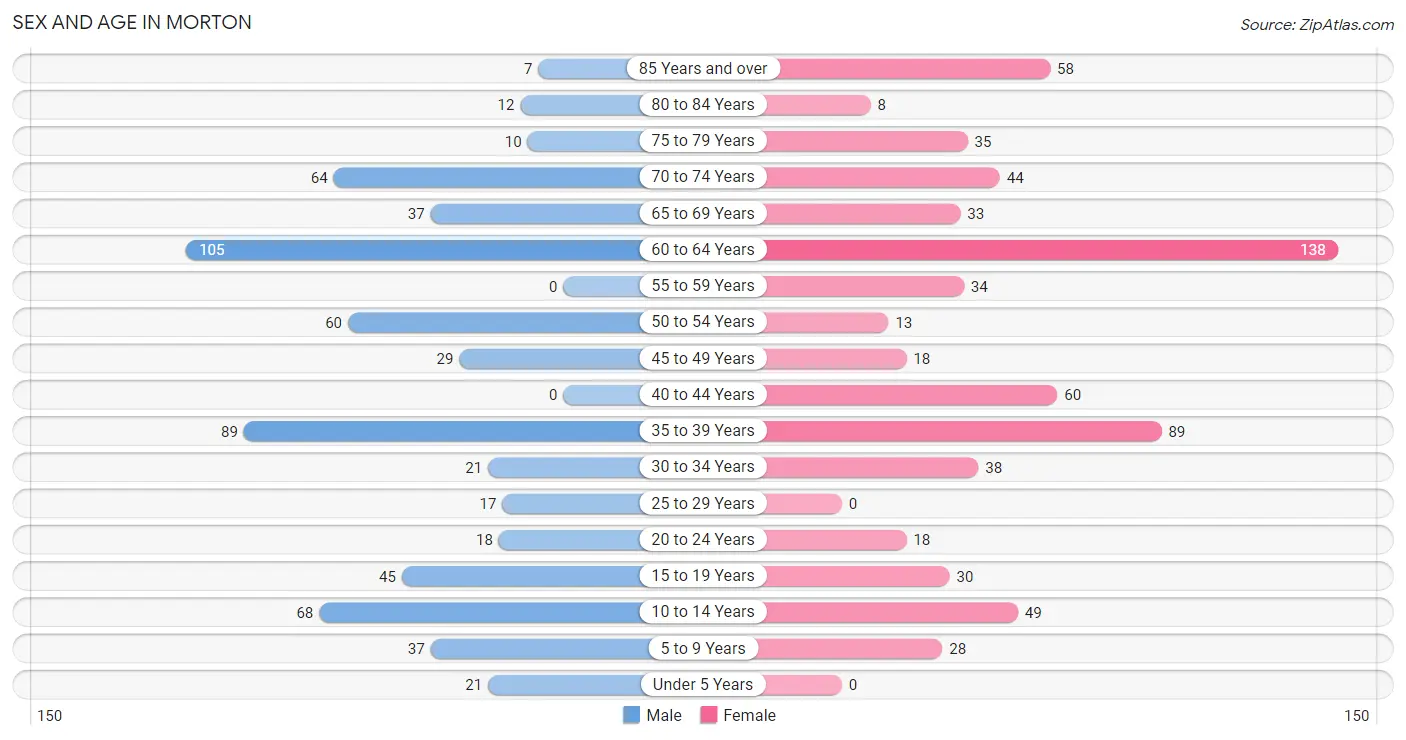
| Age Bracket | Male | Female |
| Under 5 Years | 21 (3.3%) | 0 (0.0%) |
| 5 to 9 Years | 37 (5.8%) | 28 (4.0%) |
| 10 to 14 Years | 68 (10.6%) | 49 (7.1%) |
| 15 to 19 Years | 45 (7.0%) | 30 (4.3%) |
| 20 to 24 Years | 18 (2.8%) | 18 (2.6%) |
| 25 to 29 Years | 17 (2.7%) | 0 (0.0%) |
| 30 to 34 Years | 21 (3.3%) | 38 (5.5%) |
| 35 to 39 Years | 89 (13.9%) | 89 (12.8%) |
| 40 to 44 Years | 0 (0.0%) | 60 (8.7%) |
| 45 to 49 Years | 29 (4.5%) | 18 (2.6%) |
| 50 to 54 Years | 60 (9.4%) | 13 (1.9%) |
| 55 to 59 Years | 0 (0.0%) | 34 (4.9%) |
| 60 to 64 Years | 105 (16.4%) | 138 (19.9%) |
| 65 to 69 Years | 37 (5.8%) | 33 (4.8%) |
| 70 to 74 Years | 64 (10.0%) | 44 (6.4%) |
| 75 to 79 Years | 10 (1.6%) | 35 (5.1%) |
| 80 to 84 Years | 12 (1.9%) | 8 (1.1%) |
| 85 Years and over | 7 (1.1%) | 58 (8.4%) |
| Total | 640 (100.0%) | 693 (100.0%) |
Families and Households in Morton
Median Family Size in Morton
The median family size in Morton is 2.89 persons per family, with married-couple families (277 | 78.9%) accounting for the largest median family size of 2.98 persons per family. On the other hand, single male/father families (44 | 12.5%) represent the smallest median family size with 2.48 persons per family.
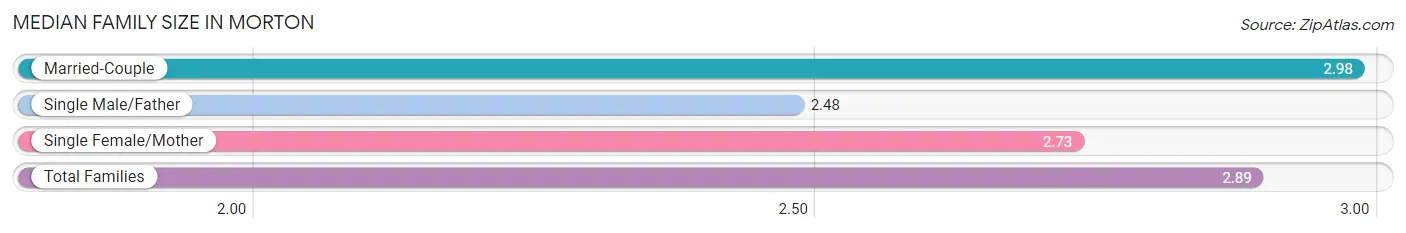
| Family Type | # Families | Family Size |
| Married-Couple | 277 (78.9%) | 2.98 |
| Single Male/Father | 44 (12.5%) | 2.48 |
| Single Female/Mother | 30 (8.6%) | 2.73 |
| Total Families | 351 (100.0%) | 2.89 |
Median Household Size in Morton
The median household size in Morton is 2.52 persons per household, with married-couple households (277 | 55.1%) accounting for the largest median household size of 3.15 persons per household. non-family households (152 | 30.2%) represent the smallest median household size with 1.16 persons per household.
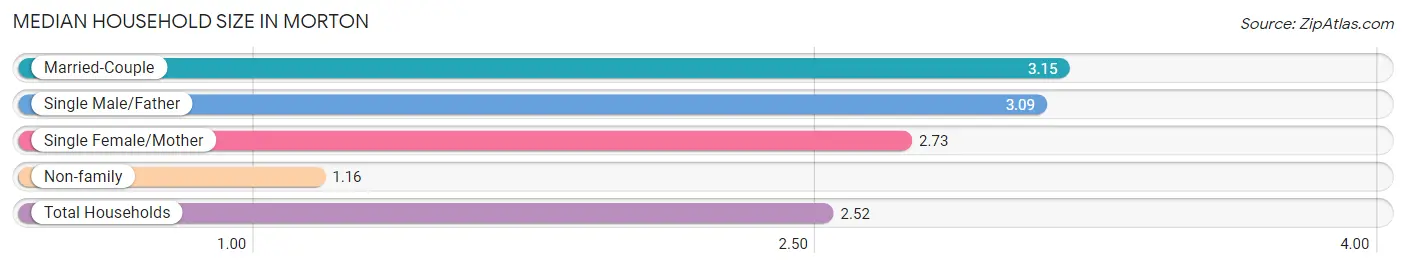
| Household Type | # Households | Household Size |
| Married-Couple | 277 (55.1%) | 3.15 |
| Single Male/Father | 44 (8.7%) | 3.09 |
| Single Female/Mother | 30 (6.0%) | 2.73 |
| Non-family | 152 (30.2%) | 1.16 |
| Total Households | 503 (100.0%) | 2.52 |
Household Size by Marriage Status in Morton
Out of a total of 503 households in Morton, 351 (69.8%) are family households, while 152 (30.2%) are nonfamily households. The most numerous type of family households are 2-person households, comprising 195, and the most common type of nonfamily households are 1-person households, comprising 138.
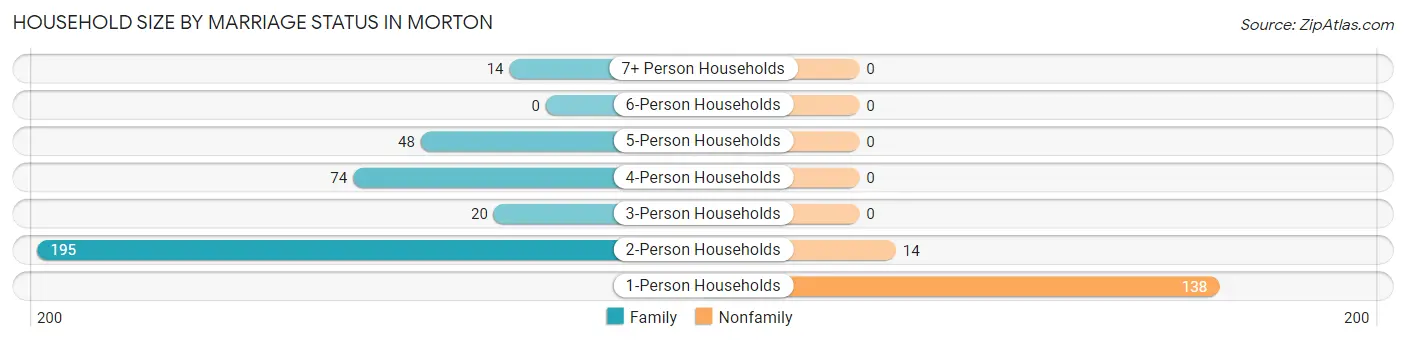
| Household Size | Family Households | Nonfamily Households |
| 1-Person Households | - | 138 (27.4%) |
| 2-Person Households | 195 (38.8%) | 14 (2.8%) |
| 3-Person Households | 20 (4.0%) | 0 (0.0%) |
| 4-Person Households | 74 (14.7%) | 0 (0.0%) |
| 5-Person Households | 48 (9.5%) | 0 (0.0%) |
| 6-Person Households | 0 (0.0%) | 0 (0.0%) |
| 7+ Person Households | 14 (2.8%) | 0 (0.0%) |
| Total | 351 (69.8%) | 152 (30.2%) |
Female Fertility in Morton
Fertility by Age in Morton
Average fertility rate in Morton is 30.0 births per 1,000 women. Women in the age bracket of 15 to 19 years have the highest fertility rate with 167.0 births per 1,000 women. Women in the age bracket of 15 to 19 years acount for 62.5% of all women with births.
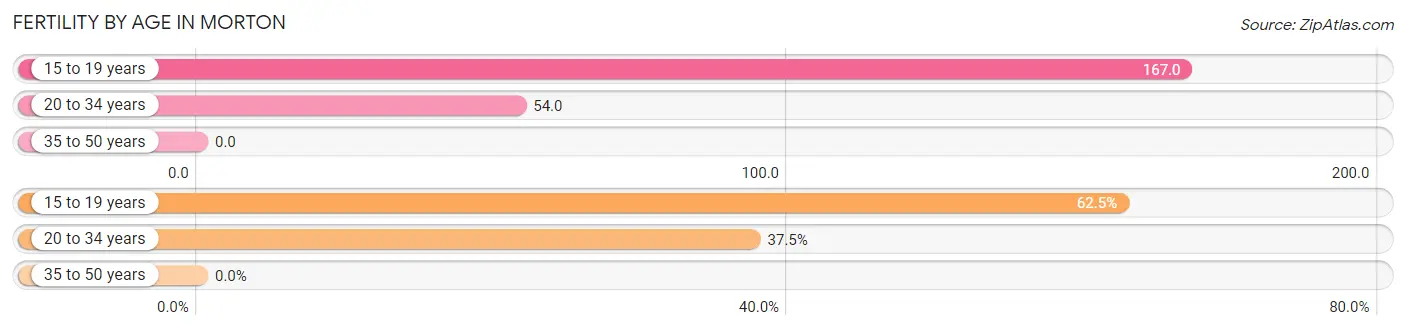
| Age Bracket | Women with Births | Births / 1,000 Women |
| 15 to 19 years | 5 (62.5%) | 167.0 |
| 20 to 34 years | 3 (37.5%) | 54.0 |
| 35 to 50 years | 0 (0.0%) | 0.0 |
| Total | 8 (100.0%) | 30.0 |
Fertility by Age by Marriage Status in Morton
37.5% of women with births (8) in Morton are married. The highest percentage of unmarried women with births falls into 15 to 19 years age bracket with 100.0% of them unmarried at the time of birth, while the lowest percentage of unmarried women with births belong to 20 to 34 years age bracket with 0.0% of them unmarried.
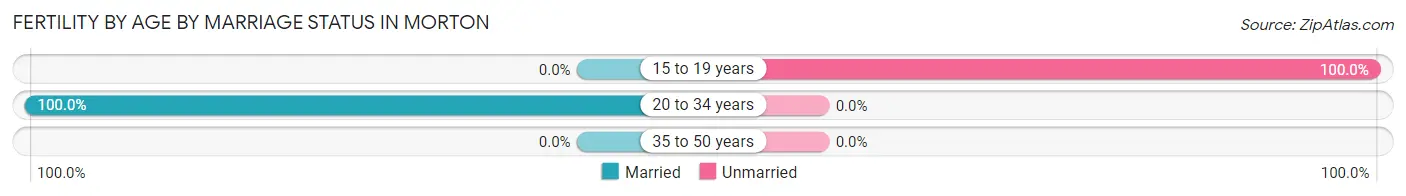
| Age Bracket | Married | Unmarried |
| 15 to 19 years | 0 (0.0%) | 5 (100.0%) |
| 20 to 34 years | 3 (100.0%) | 0 (0.0%) |
| 35 to 50 years | 0 (0.0%) | 0 (0.0%) |
| Total | 3 (37.5%) | 5 (62.5%) |
Fertility by Education in Morton
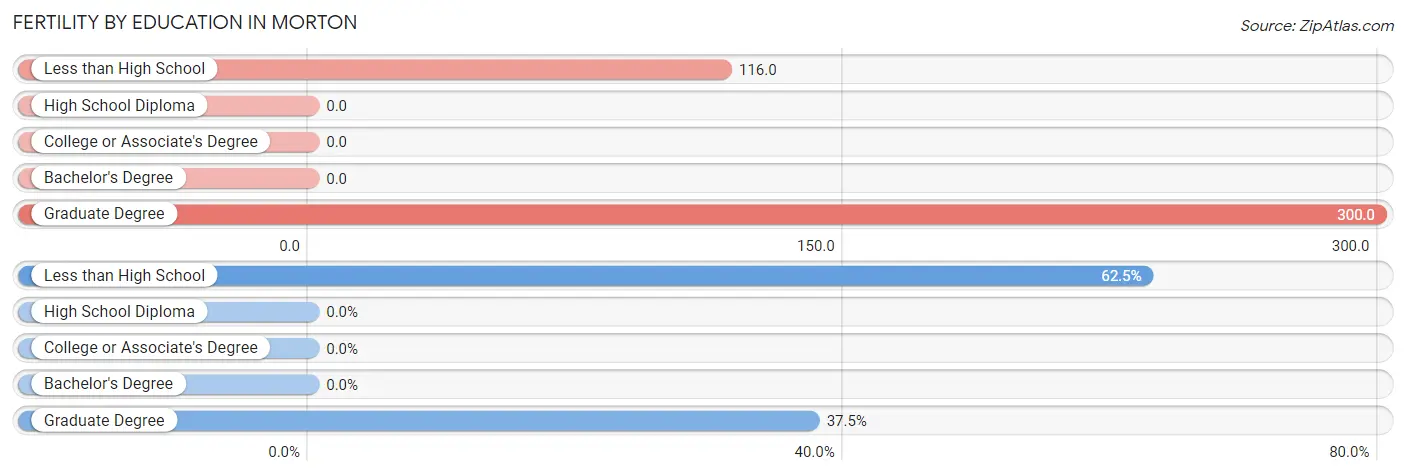
| Educational Attainment | Women with Births | Births / 1,000 Women |
| Less than High School | 5 (62.5%) | 116.0 |
| High School Diploma | 0 (0.0%) | 0.0 |
| College or Associate's Degree | 0 (0.0%) | 0.0 |
| Bachelor's Degree | 0 (0.0%) | 0.0 |
| Graduate Degree | 3 (37.5%) | 300.0 |
| Total | 8 (100.0%) | 30.0 |
Fertility by Education by Marriage Status in Morton
62.5% of women with births in Morton are unmarried. Women with the educational attainment of graduate degree are most likely to be married with 100.0% of them married at childbirth, while women with the educational attainment of less than high school are least likely to be married with 100.0% of them unmarried at childbirth.
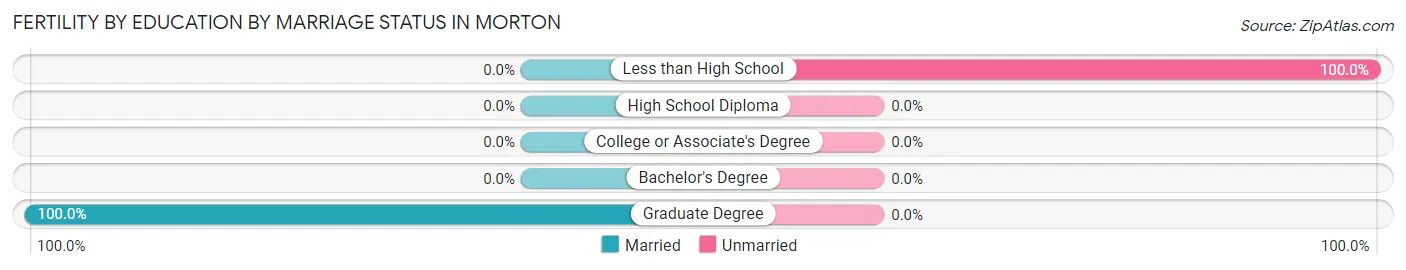
| Educational Attainment | Married | Unmarried |
| Less than High School | 0 (0.0%) | 5 (100.0%) |
| High School Diploma | 0 (0.0%) | 0 (0.0%) |
| College or Associate's Degree | 0 (0.0%) | 0 (0.0%) |
| Bachelor's Degree | 0 (0.0%) | 0 (0.0%) |
| Graduate Degree | 3 (100.0%) | 0 (0.0%) |
| Total | 3 (37.5%) | 5 (62.5%) |
Employment Characteristics in Morton
Employment by Class of Employer in Morton
Among the 451 employed individuals in Morton, private company employees (317 | 70.3%), state government employees (48 | 10.6%), and self-employed (incorporated) (23 | 5.1%) make up the most common classes of employment.
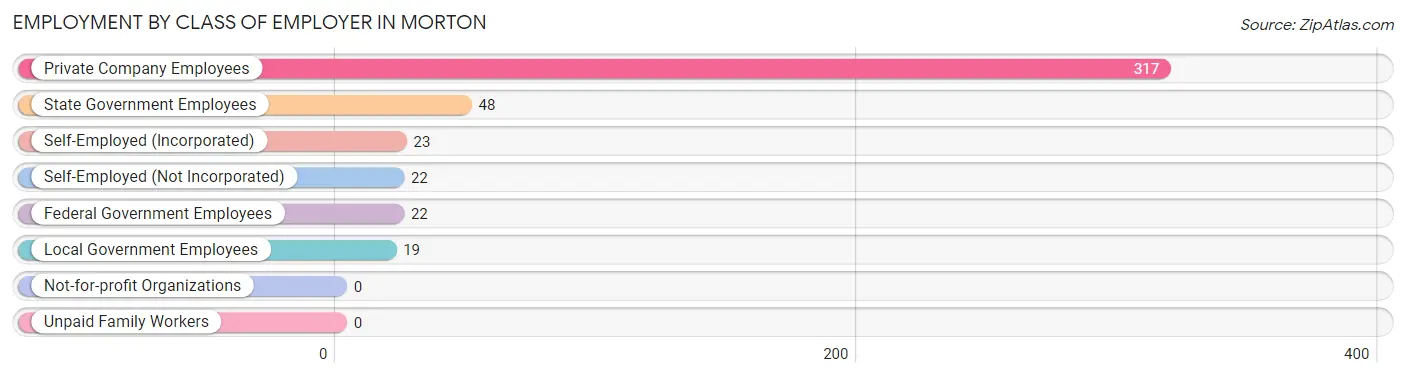
| Employer Class | # Employees | % Employees |
| Private Company Employees | 317 | 70.3% |
| Self-Employed (Incorporated) | 23 | 5.1% |
| Self-Employed (Not Incorporated) | 22 | 4.9% |
| Not-for-profit Organizations | 0 | 0.0% |
| Local Government Employees | 19 | 4.2% |
| State Government Employees | 48 | 10.6% |
| Federal Government Employees | 22 | 4.9% |
| Unpaid Family Workers | 0 | 0.0% |
| Total | 451 | 100.0% |
Employment Status by Age in Morton
According to the labor force statistics for Morton, out of the total population over 16 years of age (1,105), 45.9% or 507 individuals are in the labor force, with 11.0% or 56 of them unemployed. The age group with the highest labor force participation rate is 30 to 34 years, with 100.0% or 59 individuals in the labor force. Within the labor force, the 16 to 19 years age range has the highest percentage of unemployed individuals, with 40.0% or 12 of them being unemployed.
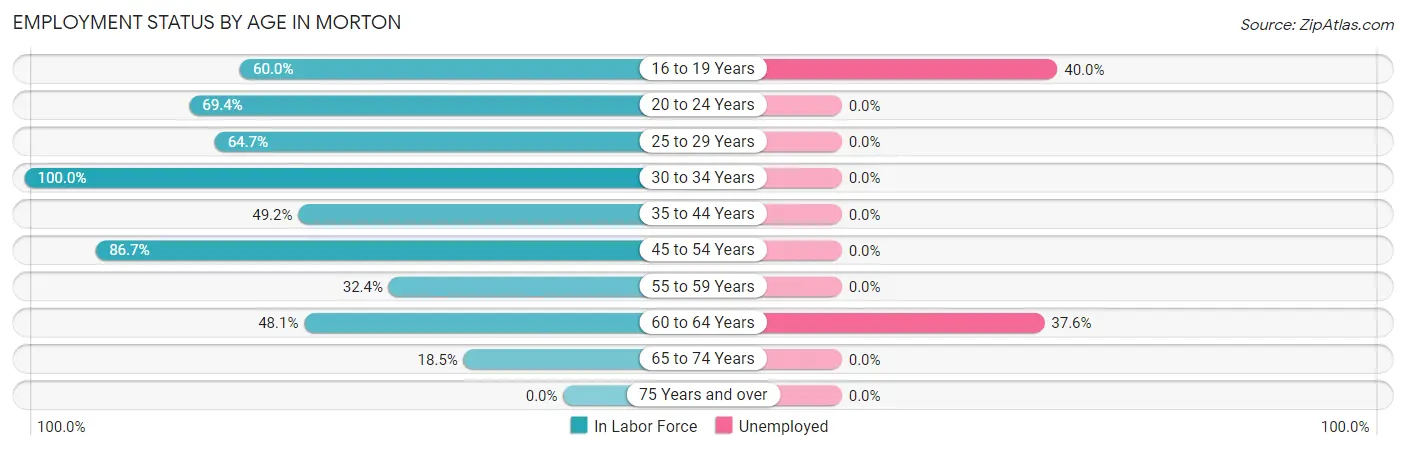
| Age Bracket | In Labor Force | Unemployed |
| 16 to 19 Years | 30 (60.0%) | 12 (40.0%) |
| 20 to 24 Years | 25 (69.4%) | 0 (0.0%) |
| 25 to 29 Years | 11 (64.7%) | 0 (0.0%) |
| 30 to 34 Years | 59 (100.0%) | 0 (0.0%) |
| 35 to 44 Years | 117 (49.2%) | 0 (0.0%) |
| 45 to 54 Years | 104 (86.7%) | 0 (0.0%) |
| 55 to 59 Years | 11 (32.4%) | 0 (0.0%) |
| 60 to 64 Years | 117 (48.1%) | 44 (37.6%) |
| 65 to 74 Years | 33 (18.5%) | 0 (0.0%) |
| 75 Years and over | 0 (0.0%) | 0 (0.0%) |
| Total | 507 (45.9%) | 56 (11.0%) |
Employment Status by Educational Attainment in Morton
According to labor force statistics for Morton, 58.9% of individuals (419) out of the total population between 25 and 64 years of age (711) are in the labor force, with 10.5% or 44 of them being unemployed. The group with the highest labor force participation rate are those with the educational attainment of bachelor's degree or higher, with 100.0% or 91 individuals in the labor force. Within the labor force, individuals with high school diploma education have the highest percentage of unemployment, with 34.9% or 44 of them being unemployed.
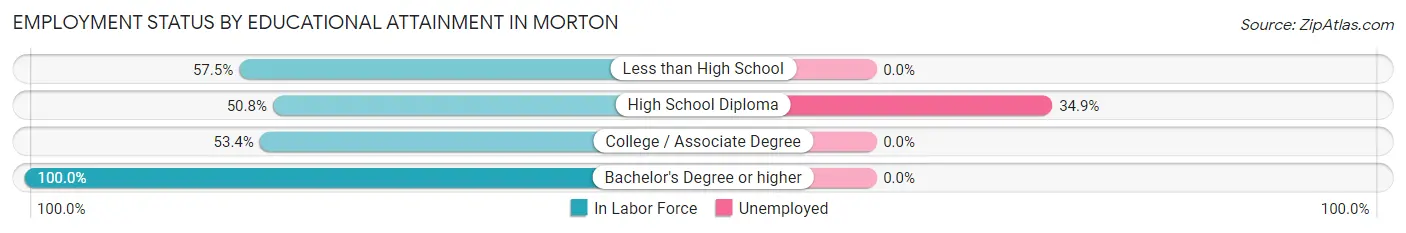
| Educational Attainment | In Labor Force | Unemployed |
| Less than High School | 46 (57.5%) | 0 (0.0%) |
| High School Diploma | 126 (50.8%) | 87 (34.9%) |
| College / Associate Degree | 156 (53.4%) | 0 (0.0%) |
| Bachelor's Degree or higher | 91 (100.0%) | 0 (0.0%) |
| Total | 419 (58.9%) | 75 (10.5%) |
Employment Occupations by Sex in Morton
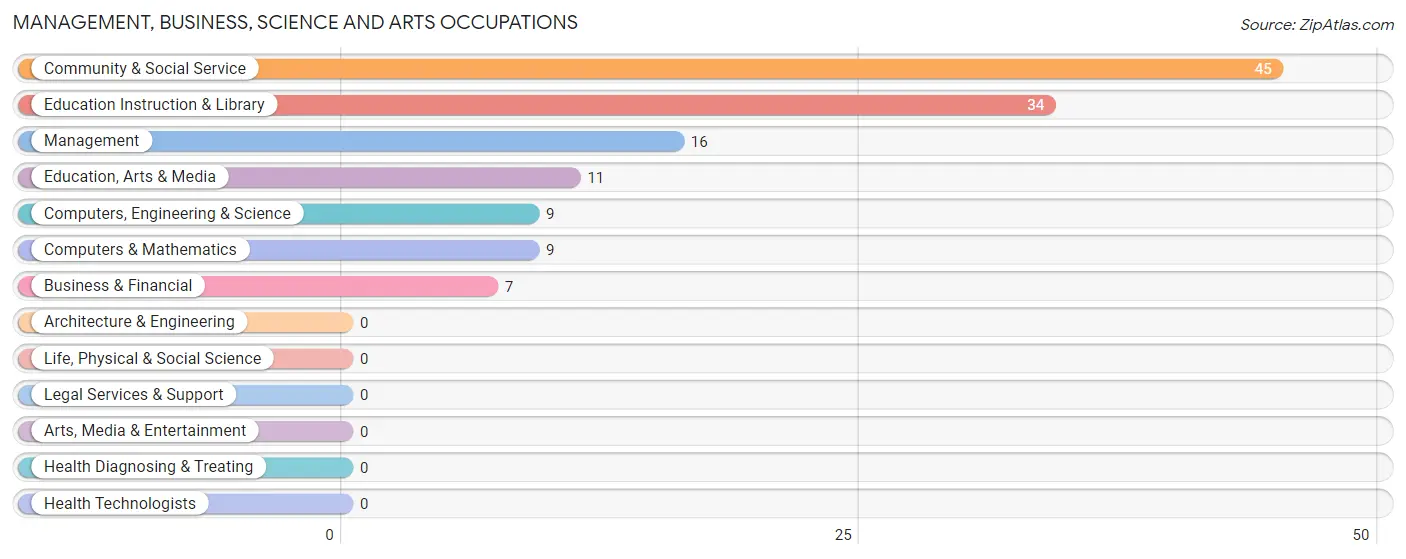
Management, Business, Science and Arts Occupations
The most common Management, Business, Science and Arts occupations in Morton are Community & Social Service (45 | 10.0%), Education Instruction & Library (34 | 7.5%), Management (16 | 3.5%), Education, Arts & Media (11 | 2.4%), and Computers, Engineering & Science (9 | 2.0%).
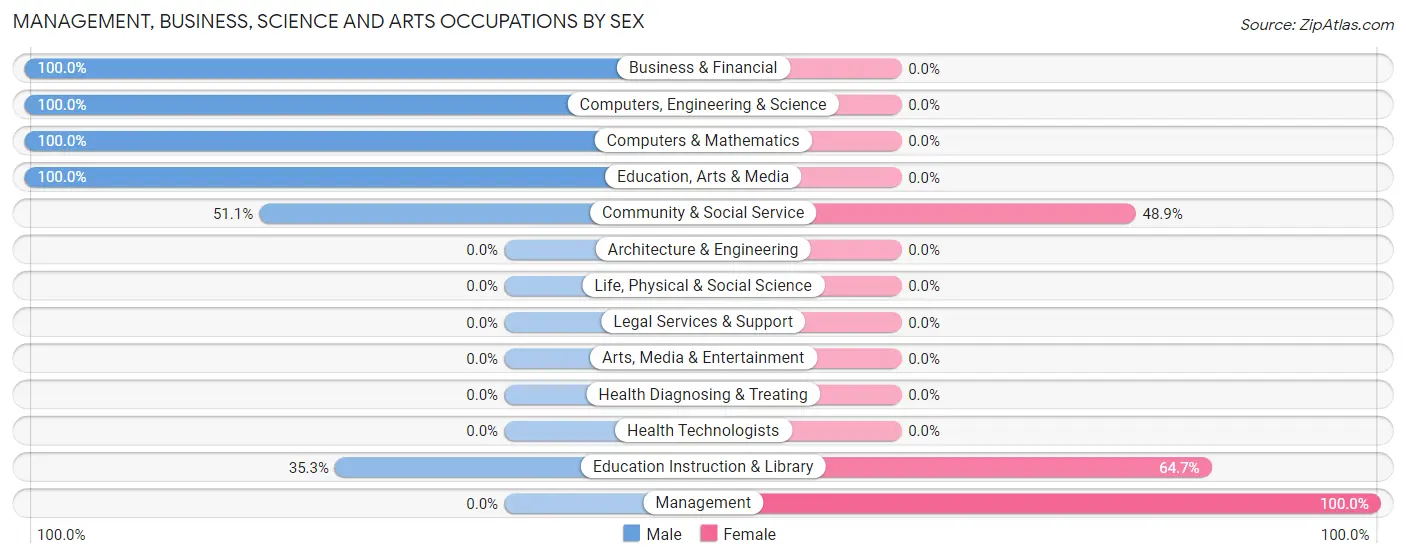
Management, Business, Science and Arts Occupations by Sex
Within the Management, Business, Science and Arts occupations in Morton, the most male-oriented occupations are Business & Financial (100.0%), Computers, Engineering & Science (100.0%), and Computers & Mathematics (100.0%), while the most female-oriented occupations are Management (100.0%), Education Instruction & Library (64.7%), and Community & Social Service (48.9%).
| Occupation | Male | Female |
| Management | 0 (0.0%) | 16 (100.0%) |
| Business & Financial | 7 (100.0%) | 0 (0.0%) |
| Computers, Engineering & Science | 9 (100.0%) | 0 (0.0%) |
| Computers & Mathematics | 9 (100.0%) | 0 (0.0%) |
| Architecture & Engineering | 0 (0.0%) | 0 (0.0%) |
| Life, Physical & Social Science | 0 (0.0%) | 0 (0.0%) |
| Community & Social Service | 23 (51.1%) | 22 (48.9%) |
| Education, Arts & Media | 11 (100.0%) | 0 (0.0%) |
| Legal Services & Support | 0 (0.0%) | 0 (0.0%) |
| Education Instruction & Library | 12 (35.3%) | 22 (64.7%) |
| Arts, Media & Entertainment | 0 (0.0%) | 0 (0.0%) |
| Health Diagnosing & Treating | 0 (0.0%) | 0 (0.0%) |
| Health Technologists | 0 (0.0%) | 0 (0.0%) |
| Total (Category) | 39 (50.6%) | 38 (49.3%) |
| Total (Overall) | 253 (56.1%) | 198 (43.9%) |
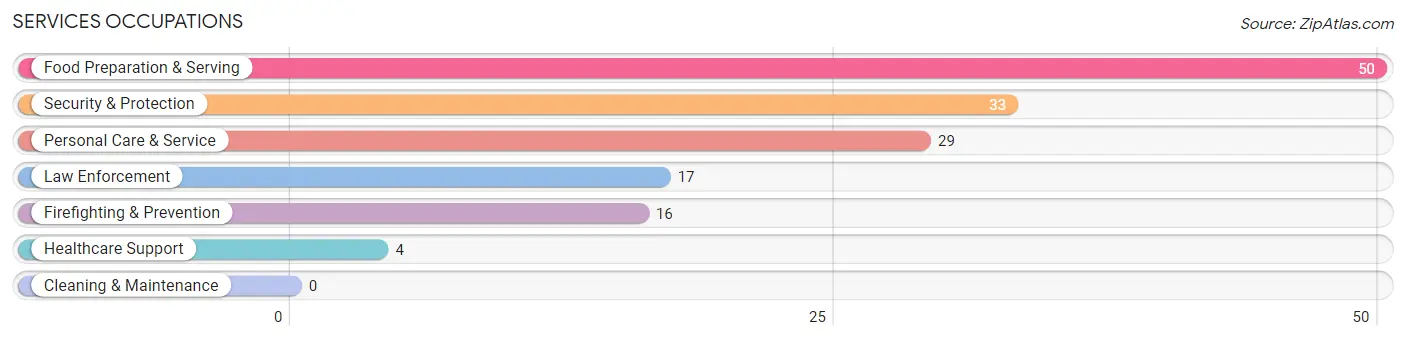
Services Occupations
The most common Services occupations in Morton are Food Preparation & Serving (50 | 11.1%), Security & Protection (33 | 7.3%), Personal Care & Service (29 | 6.4%), Law Enforcement (17 | 3.8%), and Firefighting & Prevention (16 | 3.5%).
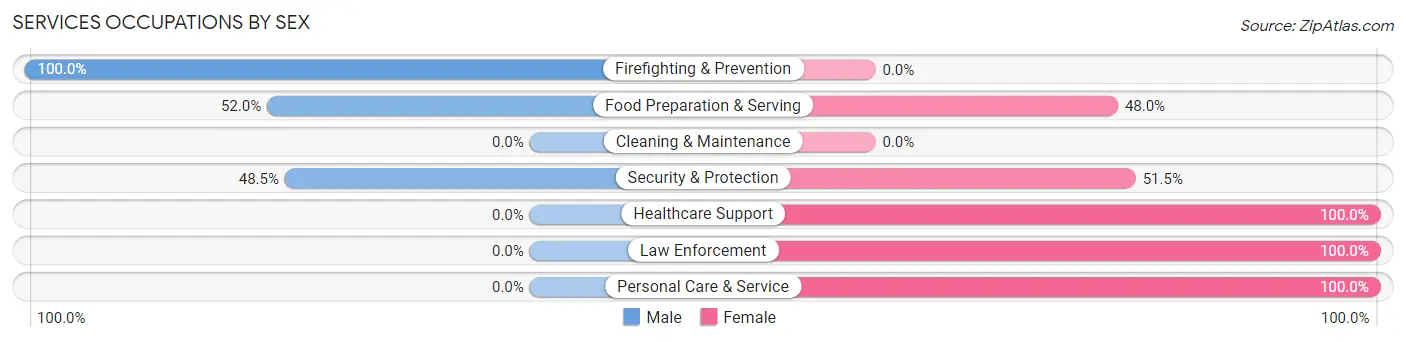
Services Occupations by Sex
Within the Services occupations in Morton, the most male-oriented occupations are Firefighting & Prevention (100.0%), Food Preparation & Serving (52.0%), and Security & Protection (48.5%), while the most female-oriented occupations are Healthcare Support (100.0%), Law Enforcement (100.0%), and Personal Care & Service (100.0%).
| Occupation | Male | Female |
| Healthcare Support | 0 (0.0%) | 4 (100.0%) |
| Security & Protection | 16 (48.5%) | 17 (51.5%) |
| Firefighting & Prevention | 16 (100.0%) | 0 (0.0%) |
| Law Enforcement | 0 (0.0%) | 17 (100.0%) |
| Food Preparation & Serving | 26 (52.0%) | 24 (48.0%) |
| Cleaning & Maintenance | 0 (0.0%) | 0 (0.0%) |
| Personal Care & Service | 0 (0.0%) | 29 (100.0%) |
| Total (Category) | 42 (36.2%) | 74 (63.8%) |
| Total (Overall) | 253 (56.1%) | 198 (43.9%) |
Sales and Office Occupations
The most common Sales and Office occupations in Morton are Sales & Related (86 | 19.1%), and Office & Administration (13 | 2.9%).
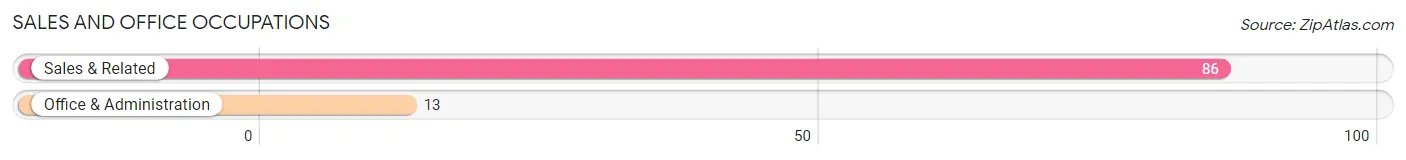
Sales and Office Occupations by Sex
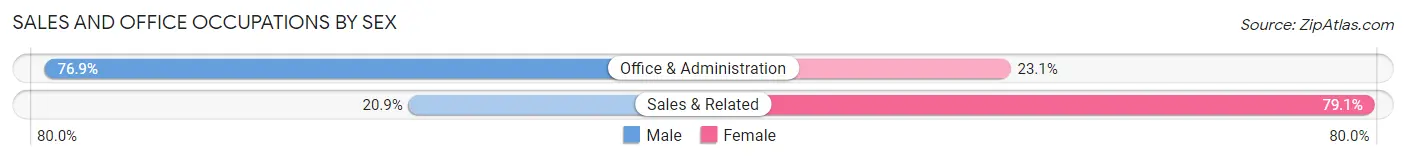
| Occupation | Male | Female |
| Sales & Related | 18 (20.9%) | 68 (79.1%) |
| Office & Administration | 10 (76.9%) | 3 (23.1%) |
| Total (Category) | 28 (28.3%) | 71 (71.7%) |
| Total (Overall) | 253 (56.1%) | 198 (43.9%) |
Natural Resources, Construction and Maintenance Occupations
The most common Natural Resources, Construction and Maintenance occupations in Morton are Installation, Maintenance & Repair (77 | 17.1%), and Construction & Extraction (28 | 6.2%).
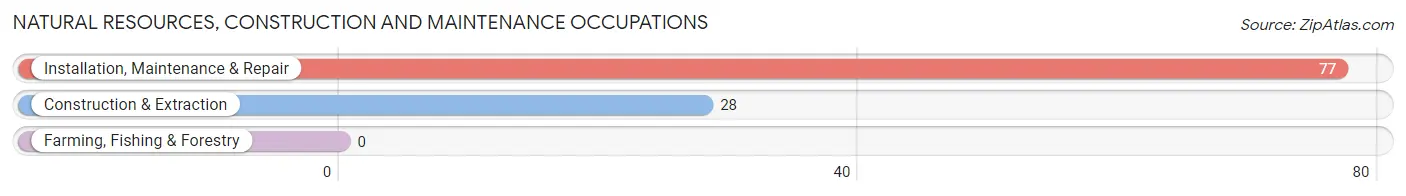
Natural Resources, Construction and Maintenance Occupations by Sex
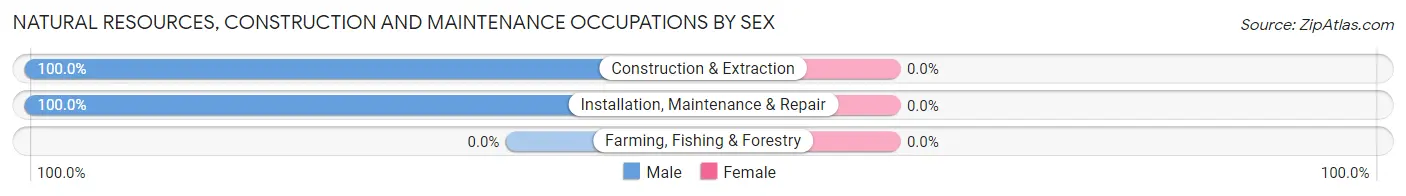
| Occupation | Male | Female |
| Farming, Fishing & Forestry | 0 (0.0%) | 0 (0.0%) |
| Construction & Extraction | 28 (100.0%) | 0 (0.0%) |
| Installation, Maintenance & Repair | 77 (100.0%) | 0 (0.0%) |
| Total (Category) | 105 (100.0%) | 0 (0.0%) |
| Total (Overall) | 253 (56.1%) | 198 (43.9%) |
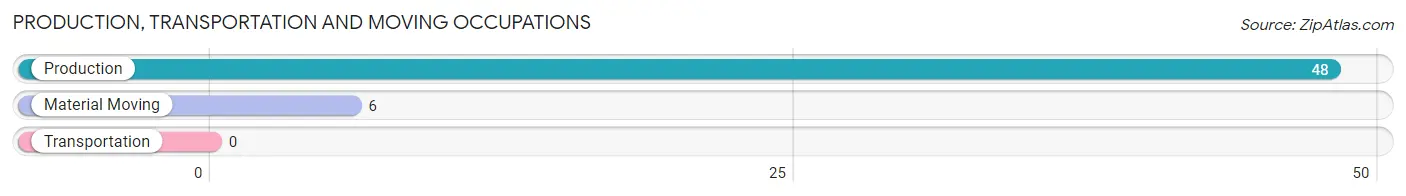
Production, Transportation and Moving Occupations
The most common Production, Transportation and Moving occupations in Morton are Production (48 | 10.6%), and Material Moving (6 | 1.3%).
Production, Transportation and Moving Occupations by Sex
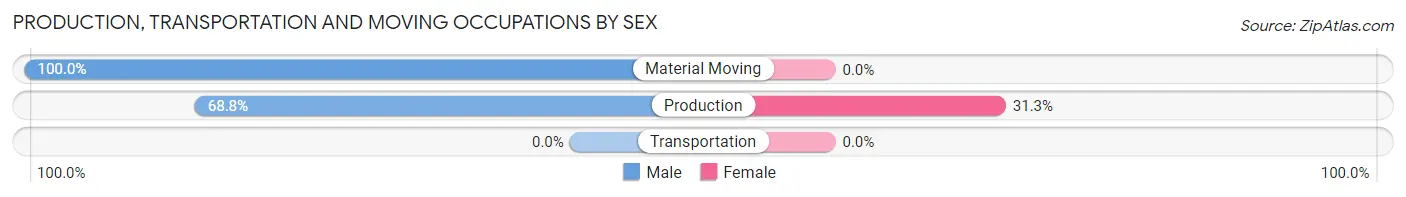
| Occupation | Male | Female |
| Production | 33 (68.8%) | 15 (31.2%) |
| Transportation | 0 (0.0%) | 0 (0.0%) |
| Material Moving | 6 (100.0%) | 0 (0.0%) |
| Total (Category) | 39 (72.2%) | 15 (27.8%) |
| Total (Overall) | 253 (56.1%) | 198 (43.9%) |
Employment Industries by Sex in Morton
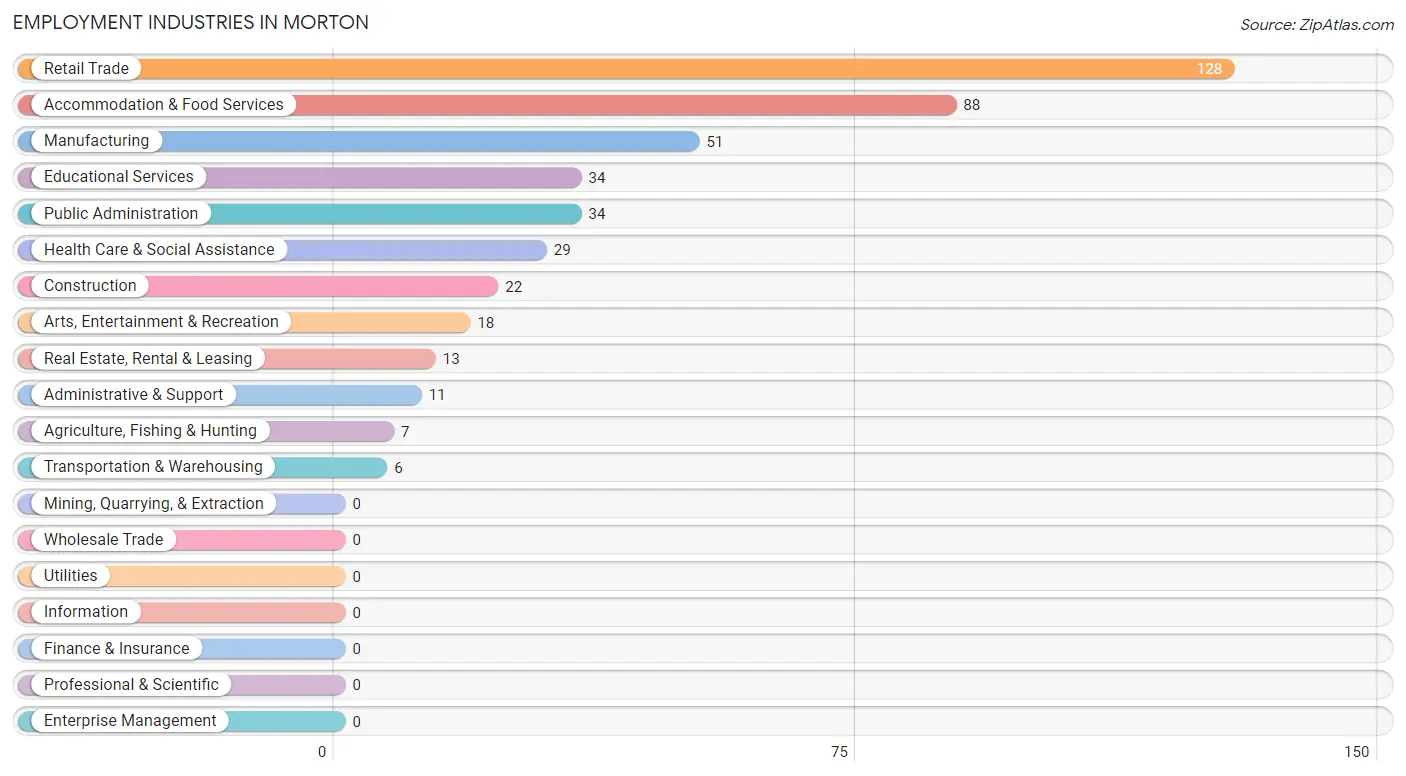
Employment Industries in Morton
The major employment industries in Morton include Retail Trade (128 | 28.4%), Accommodation & Food Services (88 | 19.5%), Manufacturing (51 | 11.3%), Educational Services (34 | 7.5%), and Public Administration (34 | 7.5%).
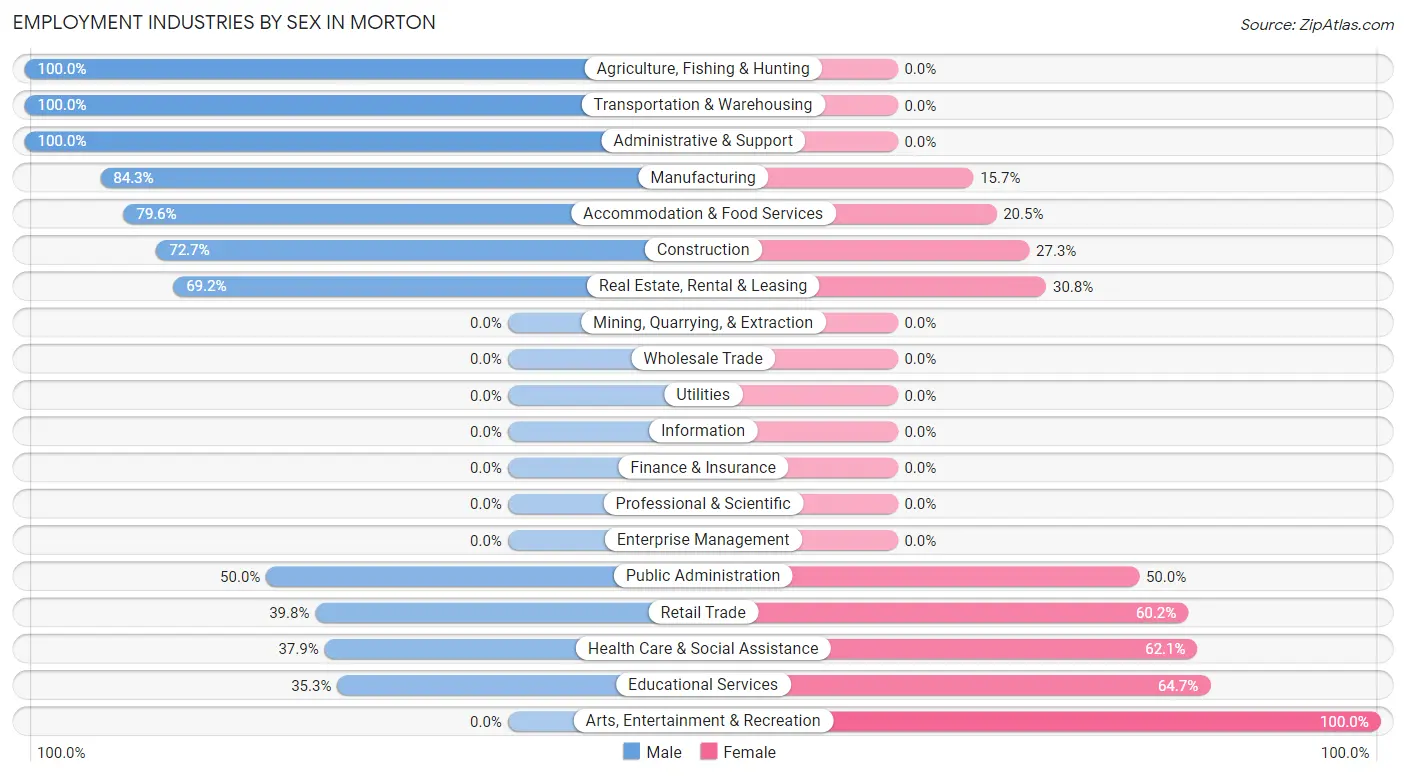
Employment Industries by Sex in Morton
The Morton industries that see more men than women are Agriculture, Fishing & Hunting (100.0%), Transportation & Warehousing (100.0%), and Administrative & Support (100.0%), whereas the industries that tend to have a higher number of women are Arts, Entertainment & Recreation (100.0%), Educational Services (64.7%), and Health Care & Social Assistance (62.1%).
| Industry | Male | Female |
| Agriculture, Fishing & Hunting | 7 (100.0%) | 0 (0.0%) |
| Mining, Quarrying, & Extraction | 0 (0.0%) | 0 (0.0%) |
| Construction | 16 (72.7%) | 6 (27.3%) |
| Manufacturing | 43 (84.3%) | 8 (15.7%) |
| Wholesale Trade | 0 (0.0%) | 0 (0.0%) |
| Retail Trade | 51 (39.8%) | 77 (60.2%) |
| Transportation & Warehousing | 6 (100.0%) | 0 (0.0%) |
| Utilities | 0 (0.0%) | 0 (0.0%) |
| Information | 0 (0.0%) | 0 (0.0%) |
| Finance & Insurance | 0 (0.0%) | 0 (0.0%) |
| Real Estate, Rental & Leasing | 9 (69.2%) | 4 (30.8%) |
| Professional & Scientific | 0 (0.0%) | 0 (0.0%) |
| Enterprise Management | 0 (0.0%) | 0 (0.0%) |
| Administrative & Support | 11 (100.0%) | 0 (0.0%) |
| Educational Services | 12 (35.3%) | 22 (64.7%) |
| Health Care & Social Assistance | 11 (37.9%) | 18 (62.1%) |
| Arts, Entertainment & Recreation | 0 (0.0%) | 18 (100.0%) |
| Accommodation & Food Services | 70 (79.5%) | 18 (20.4%) |
| Public Administration | 17 (50.0%) | 17 (50.0%) |
| Total | 253 (56.1%) | 198 (43.9%) |
Education in Morton
School Enrollment in Morton
The most common levels of schooling among the 223 students in Morton are middle school (66 | 29.6%), high school (58 | 26.0%), and elementary school (49 | 22.0%).
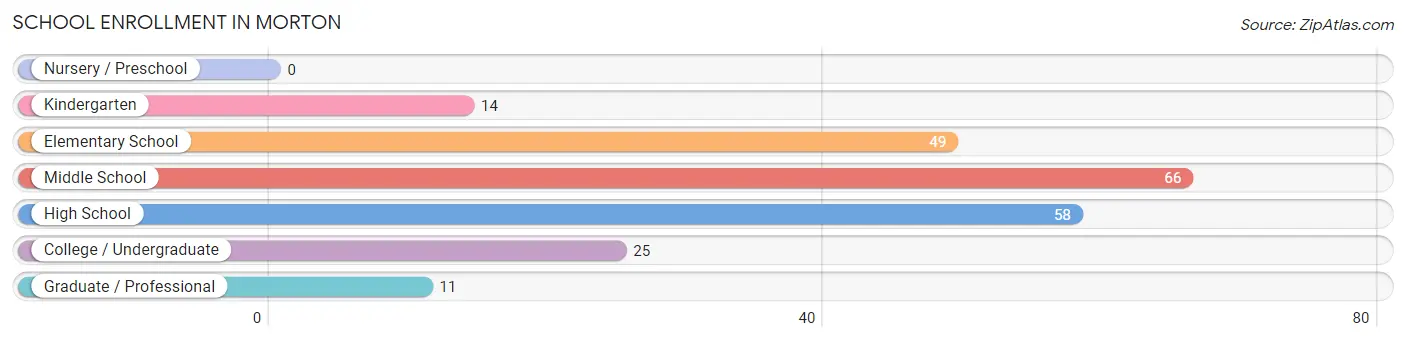
| School Level | # Students | % Students |
| Nursery / Preschool | 0 | 0.0% |
| Kindergarten | 14 | 6.3% |
| Elementary School | 49 | 22.0% |
| Middle School | 66 | 29.6% |
| High School | 58 | 26.0% |
| College / Undergraduate | 25 | 11.2% |
| Graduate / Professional | 11 | 4.9% |
| Total | 223 | 100.0% |
School Enrollment by Age by Funding Source in Morton
Out of a total of 223 students who are enrolled in schools in Morton, 40 (17.9%) attend a private institution, while the remaining 183 (82.1%) are enrolled in public schools. The age group of 25 to 34 year olds has the highest likelihood of being enrolled in private schools, with 11 (73.3% in the age bracket) enrolled. Conversely, the age group of 20 to 24 year olds has the lowest likelihood of being enrolled in a private school, with 11 (100.0% in the age bracket) attending a public institution.
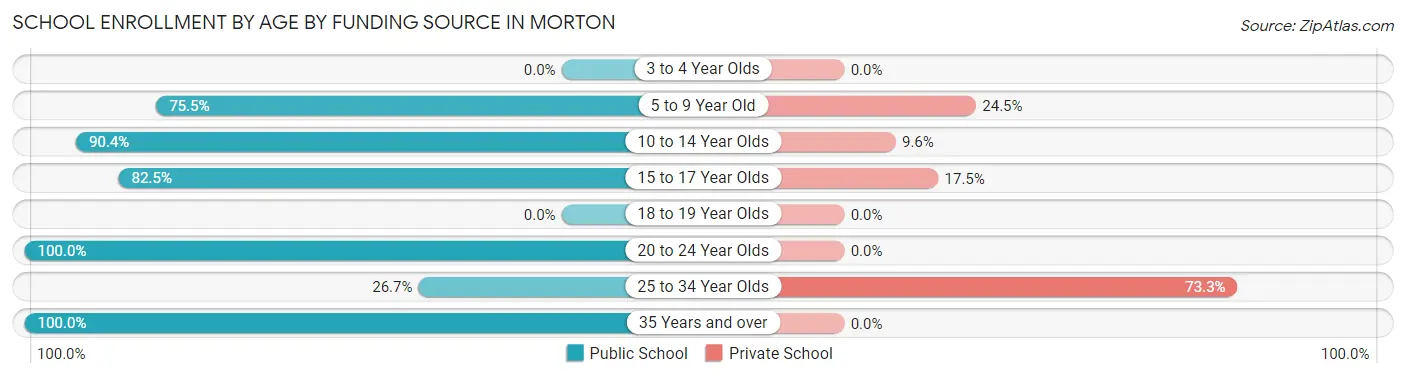
| Age Bracket | Public School | Private School |
| 3 to 4 Year Olds | 0 (0.0%) | 0 (0.0%) |
| 5 to 9 Year Old | 40 (75.5%) | 13 (24.5%) |
| 10 to 14 Year Olds | 85 (90.4%) | 9 (9.6%) |
| 15 to 17 Year Olds | 33 (82.5%) | 7 (17.5%) |
| 18 to 19 Year Olds | 0 (0.0%) | 0 (0.0%) |
| 20 to 24 Year Olds | 11 (100.0%) | 0 (0.0%) |
| 25 to 34 Year Olds | 4 (26.7%) | 11 (73.3%) |
| 35 Years and over | 10 (100.0%) | 0 (0.0%) |
| Total | 183 (82.1%) | 40 (17.9%) |
Educational Attainment by Field of Study in Morton
Education (45 | 34.4%), science & technology (32 | 24.4%), business (21 | 16.0%), computers & mathematics (11 | 8.4%), and psychology (11 | 8.4%) are the most common fields of study among 131 individuals in Morton who have obtained a bachelor's degree or higher.
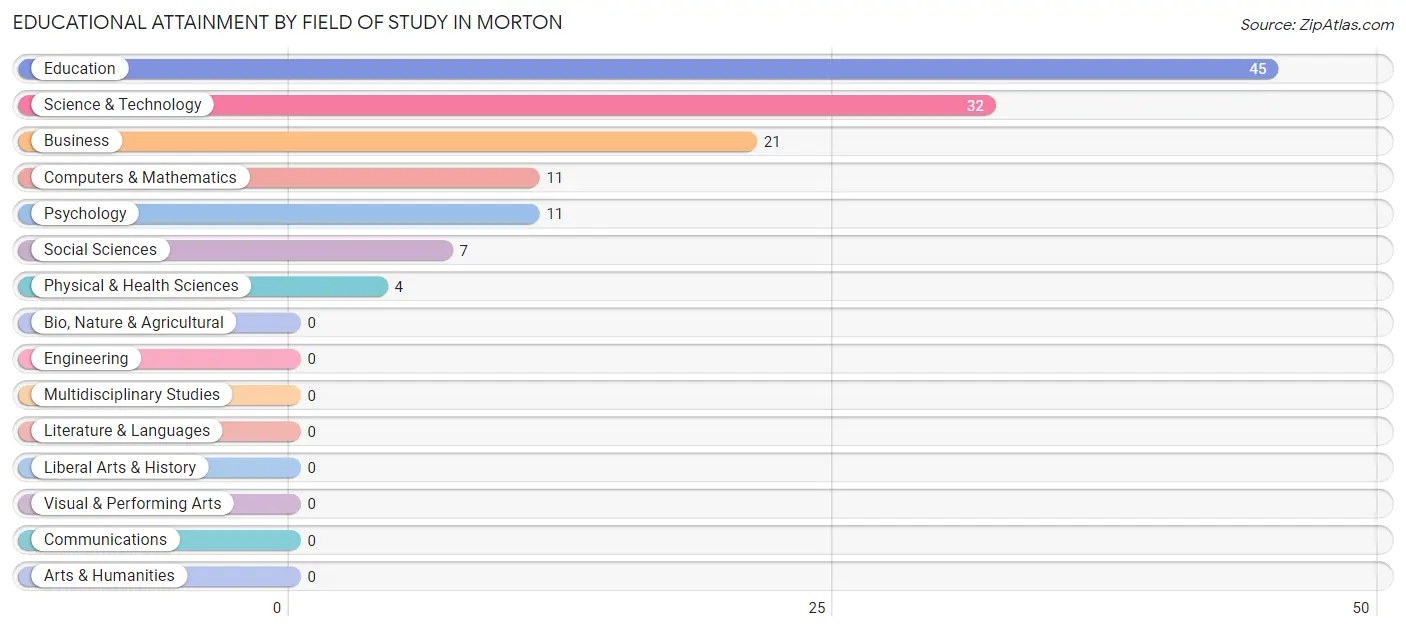
| Field of Study | # Graduates | % Graduates |
| Computers & Mathematics | 11 | 8.4% |
| Bio, Nature & Agricultural | 0 | 0.0% |
| Physical & Health Sciences | 4 | 3.0% |
| Psychology | 11 | 8.4% |
| Social Sciences | 7 | 5.3% |
| Engineering | 0 | 0.0% |
| Multidisciplinary Studies | 0 | 0.0% |
| Science & Technology | 32 | 24.4% |
| Business | 21 | 16.0% |
| Education | 45 | 34.4% |
| Literature & Languages | 0 | 0.0% |
| Liberal Arts & History | 0 | 0.0% |
| Visual & Performing Arts | 0 | 0.0% |
| Communications | 0 | 0.0% |
| Arts & Humanities | 0 | 0.0% |
| Total | 131 | 100.0% |
Transportation & Commute in Morton
Vehicle Availability by Sex in Morton
The most prevalent vehicle ownership categories in Morton are males with 3 vehicles (89, accounting for 35.2%) and females with 3 vehicles (40, making up 45.0%).
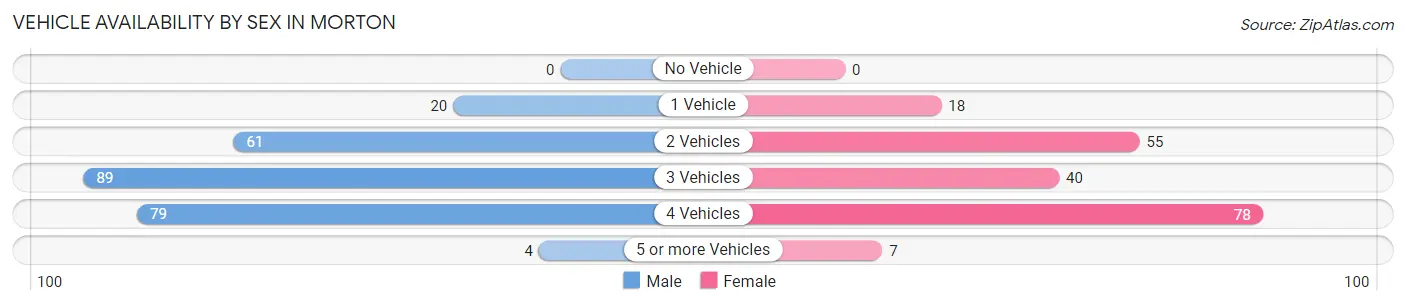
| Vehicles Available | Male | Female |
| No Vehicle | 0 (0.0%) | 0 (0.0%) |
| 1 Vehicle | 20 (7.9%) | 18 (9.1%) |
| 2 Vehicles | 61 (24.1%) | 55 (27.8%) |
| 3 Vehicles | 89 (35.2%) | 40 (20.2%) |
| 4 Vehicles | 79 (31.2%) | 78 (39.4%) |
| 5 or more Vehicles | 4 (1.6%) | 7 (3.5%) |
| Total | 253 (100.0%) | 198 (100.0%) |
Commute Time in Morton
The most frequently occuring commute durations in Morton are less than 5 minutes (170 commuters, 39.7%), 60 to 89 minutes (63 commuters, 14.7%), and 15 to 19 minutes (58 commuters, 13.6%).
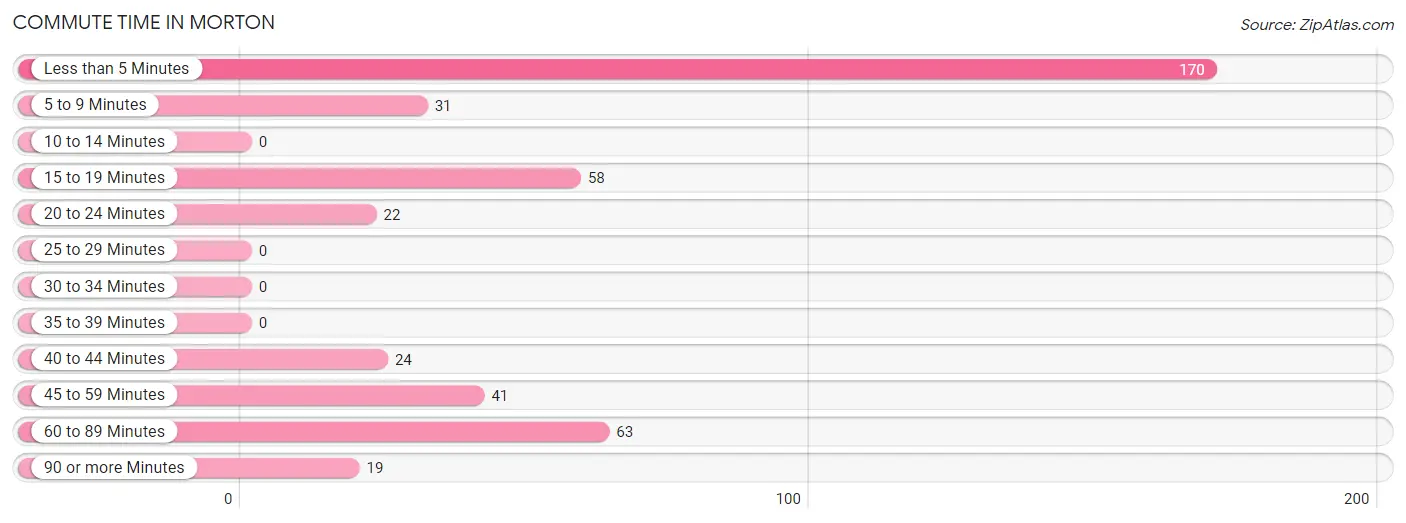
| Commute Time | # Commuters | % Commuters |
| Less than 5 Minutes | 170 | 39.7% |
| 5 to 9 Minutes | 31 | 7.2% |
| 10 to 14 Minutes | 0 | 0.0% |
| 15 to 19 Minutes | 58 | 13.6% |
| 20 to 24 Minutes | 22 | 5.1% |
| 25 to 29 Minutes | 0 | 0.0% |
| 30 to 34 Minutes | 0 | 0.0% |
| 35 to 39 Minutes | 0 | 0.0% |
| 40 to 44 Minutes | 24 | 5.6% |
| 45 to 59 Minutes | 41 | 9.6% |
| 60 to 89 Minutes | 63 | 14.7% |
| 90 or more Minutes | 19 | 4.4% |
Commute Time by Sex in Morton
The most common commute times in Morton are less than 5 minutes (69 commuters, 28.3%) for males and less than 5 minutes (101 commuters, 54.9%) for females.
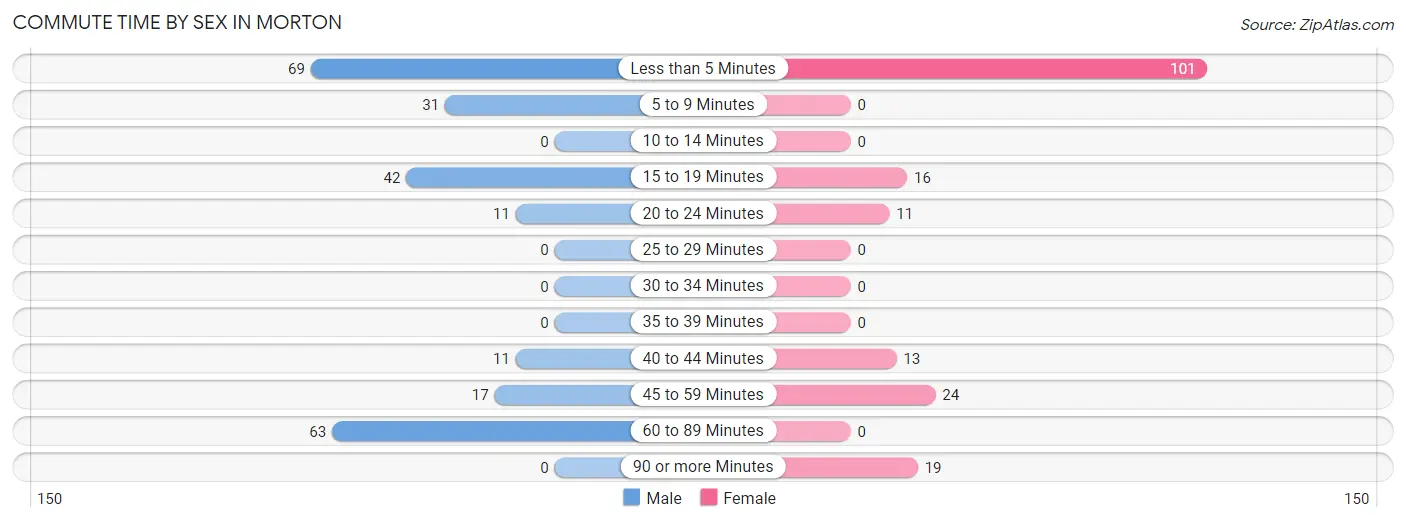
| Commute Time | Male | Female |
| Less than 5 Minutes | 69 (28.3%) | 101 (54.9%) |
| 5 to 9 Minutes | 31 (12.7%) | 0 (0.0%) |
| 10 to 14 Minutes | 0 (0.0%) | 0 (0.0%) |
| 15 to 19 Minutes | 42 (17.2%) | 16 (8.7%) |
| 20 to 24 Minutes | 11 (4.5%) | 11 (6.0%) |
| 25 to 29 Minutes | 0 (0.0%) | 0 (0.0%) |
| 30 to 34 Minutes | 0 (0.0%) | 0 (0.0%) |
| 35 to 39 Minutes | 0 (0.0%) | 0 (0.0%) |
| 40 to 44 Minutes | 11 (4.5%) | 13 (7.1%) |
| 45 to 59 Minutes | 17 (7.0%) | 24 (13.0%) |
| 60 to 89 Minutes | 63 (25.8%) | 0 (0.0%) |
| 90 or more Minutes | 0 (0.0%) | 19 (10.3%) |
Time of Departure to Work by Sex in Morton
The most frequent times of departure to work in Morton are 9:00 AM to 9:59 AM (56, 23.0%) for males and 8:30 AM to 8:59 AM (44, 23.9%) for females.
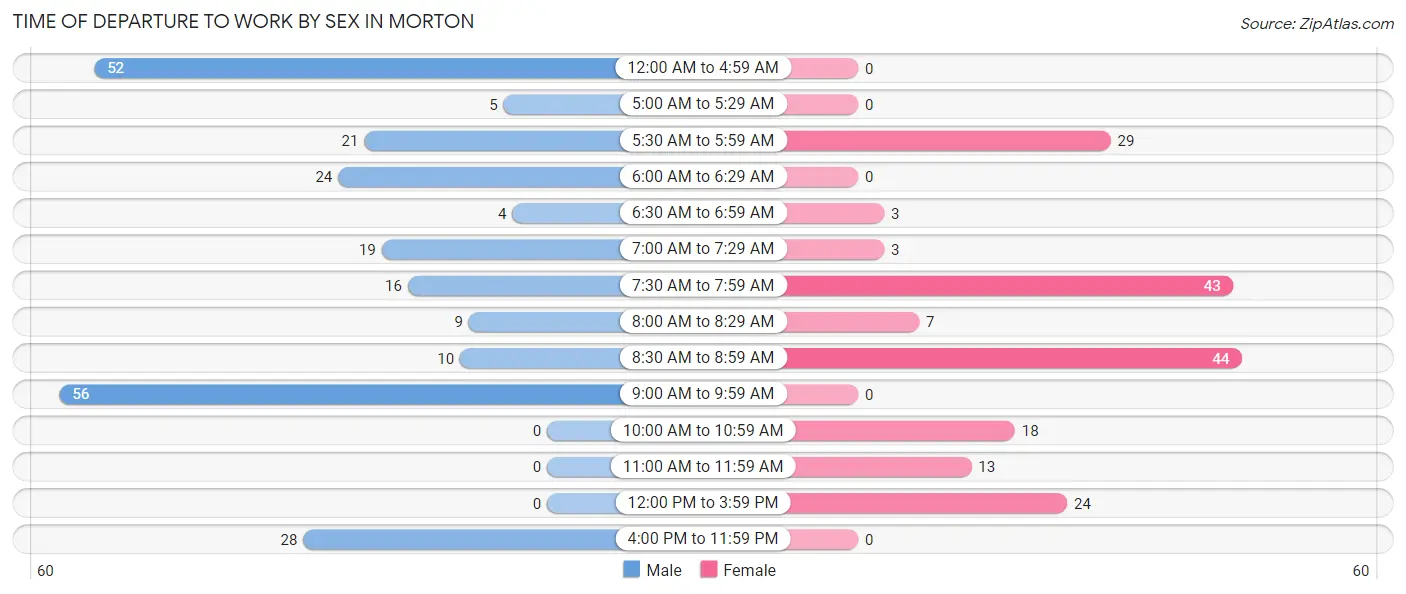
| Time of Departure | Male | Female |
| 12:00 AM to 4:59 AM | 52 (21.3%) | 0 (0.0%) |
| 5:00 AM to 5:29 AM | 5 (2.1%) | 0 (0.0%) |
| 5:30 AM to 5:59 AM | 21 (8.6%) | 29 (15.8%) |
| 6:00 AM to 6:29 AM | 24 (9.8%) | 0 (0.0%) |
| 6:30 AM to 6:59 AM | 4 (1.6%) | 3 (1.6%) |
| 7:00 AM to 7:29 AM | 19 (7.8%) | 3 (1.6%) |
| 7:30 AM to 7:59 AM | 16 (6.6%) | 43 (23.4%) |
| 8:00 AM to 8:29 AM | 9 (3.7%) | 7 (3.8%) |
| 8:30 AM to 8:59 AM | 10 (4.1%) | 44 (23.9%) |
| 9:00 AM to 9:59 AM | 56 (23.0%) | 0 (0.0%) |
| 10:00 AM to 10:59 AM | 0 (0.0%) | 18 (9.8%) |
| 11:00 AM to 11:59 AM | 0 (0.0%) | 13 (7.1%) |
| 12:00 PM to 3:59 PM | 0 (0.0%) | 24 (13.0%) |
| 4:00 PM to 11:59 PM | 28 (11.5%) | 0 (0.0%) |
| Total | 244 (100.0%) | 184 (100.0%) |
Housing Occupancy in Morton
Occupancy by Ownership in Morton
Of the total 503 dwellings in Morton, owner-occupied units account for 405 (80.5%), while renter-occupied units make up 98 (19.5%).
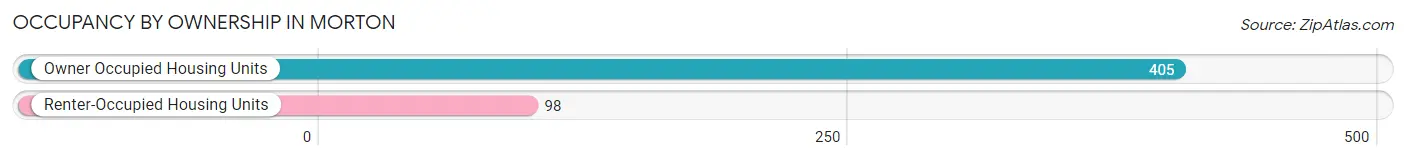
| Occupancy | # Housing Units | % Housing Units |
| Owner Occupied Housing Units | 405 | 80.5% |
| Renter-Occupied Housing Units | 98 | 19.5% |
| Total Occupied Housing Units | 503 | 100.0% |
Occupancy by Household Size in Morton
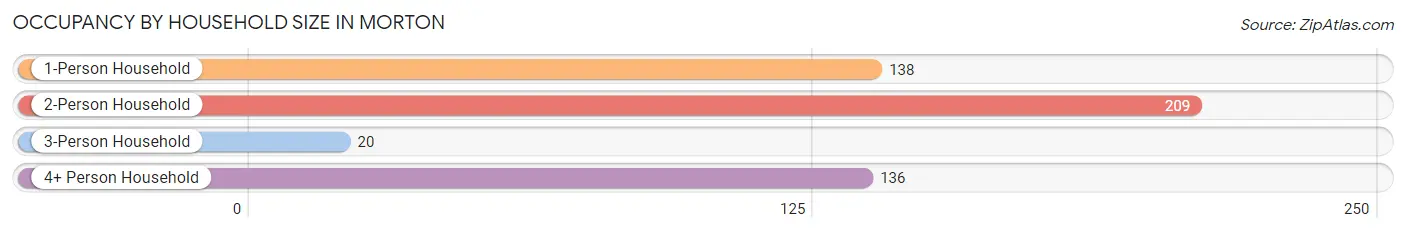
| Household Size | # Housing Units | % Housing Units |
| 1-Person Household | 138 | 27.4% |
| 2-Person Household | 209 | 41.5% |
| 3-Person Household | 20 | 4.0% |
| 4+ Person Household | 136 | 27.0% |
| Total Housing Units | 503 | 100.0% |
Occupancy by Ownership by Household Size in Morton
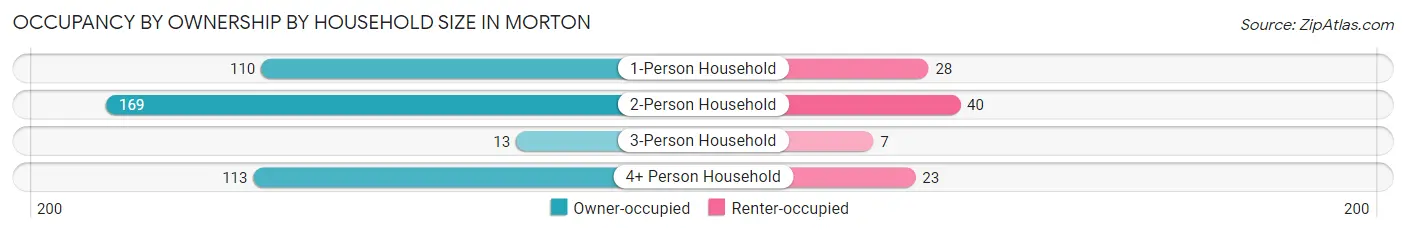
| Household Size | Owner-occupied | Renter-occupied |
| 1-Person Household | 110 (79.7%) | 28 (20.3%) |
| 2-Person Household | 169 (80.9%) | 40 (19.1%) |
| 3-Person Household | 13 (65.0%) | 7 (35.0%) |
| 4+ Person Household | 113 (83.1%) | 23 (16.9%) |
| Total Housing Units | 405 (80.5%) | 98 (19.5%) |
Occupancy by Educational Attainment in Morton
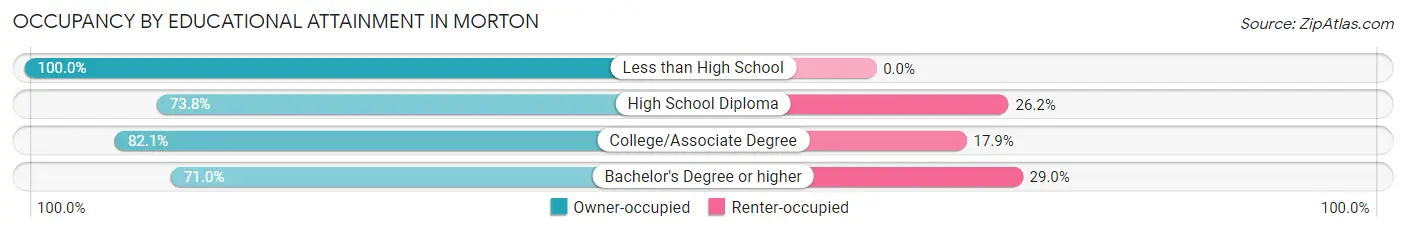
| Household Size | Owner-occupied | Renter-occupied |
| Less than High School | 60 (100.0%) | 0 (0.0%) |
| High School Diploma | 104 (73.8%) | 37 (26.2%) |
| College/Associate Degree | 197 (82.1%) | 43 (17.9%) |
| Bachelor's Degree or higher | 44 (71.0%) | 18 (29.0%) |
Occupancy by Age of Householder in Morton
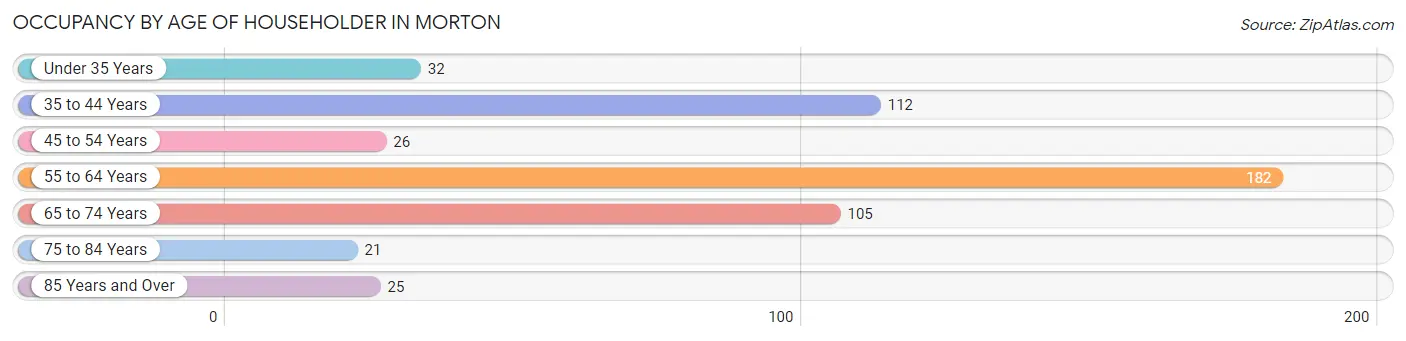
| Age Bracket | # Households | % Households |
| Under 35 Years | 32 | 6.4% |
| 35 to 44 Years | 112 | 22.3% |
| 45 to 54 Years | 26 | 5.2% |
| 55 to 64 Years | 182 | 36.2% |
| 65 to 74 Years | 105 | 20.9% |
| 75 to 84 Years | 21 | 4.2% |
| 85 Years and Over | 25 | 5.0% |
| Total | 503 | 100.0% |
Housing Finances in Morton
Median Income by Occupancy in Morton
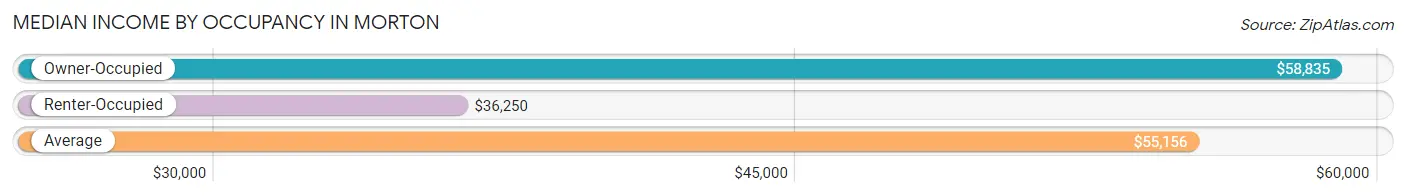
| Occupancy Type | # Households | Median Income |
| Owner-Occupied | 405 (80.5%) | $58,835 |
| Renter-Occupied | 98 (19.5%) | $36,250 |
| Average | 503 (100.0%) | $55,156 |
Occupancy by Householder Income Bracket in Morton
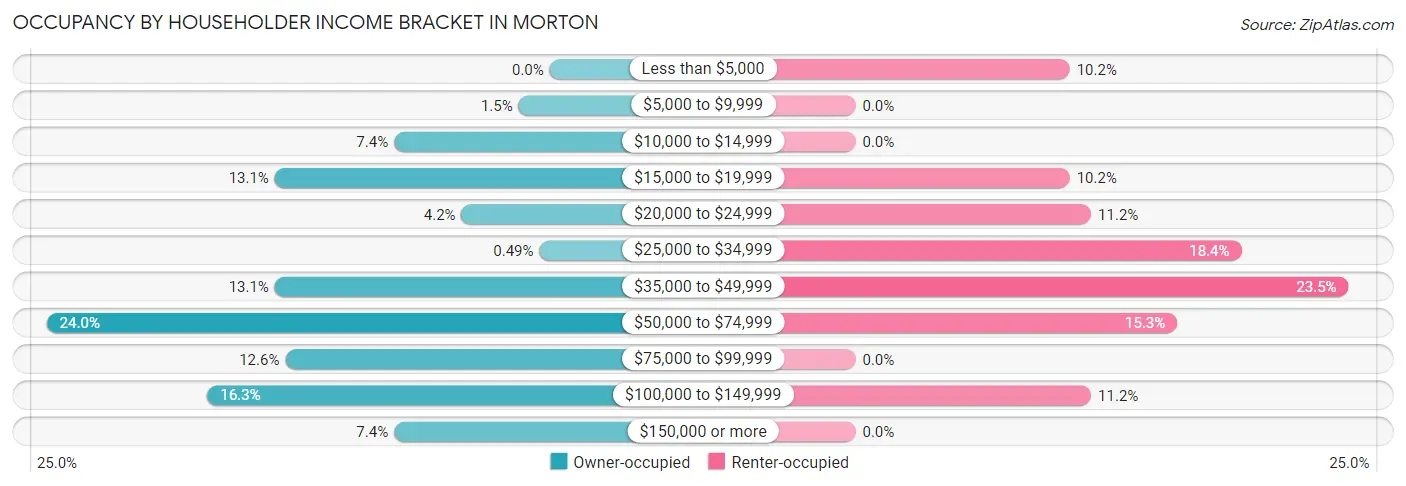
| Income Bracket | Owner-occupied | Renter-occupied |
| Less than $5,000 | 0 (0.0%) | 10 (10.2%) |
| $5,000 to $9,999 | 6 (1.5%) | 0 (0.0%) |
| $10,000 to $14,999 | 30 (7.4%) | 0 (0.0%) |
| $15,000 to $19,999 | 53 (13.1%) | 10 (10.2%) |
| $20,000 to $24,999 | 17 (4.2%) | 11 (11.2%) |
| $25,000 to $34,999 | 2 (0.5%) | 18 (18.4%) |
| $35,000 to $49,999 | 53 (13.1%) | 23 (23.5%) |
| $50,000 to $74,999 | 97 (23.9%) | 15 (15.3%) |
| $75,000 to $99,999 | 51 (12.6%) | 0 (0.0%) |
| $100,000 to $149,999 | 66 (16.3%) | 11 (11.2%) |
| $150,000 or more | 30 (7.4%) | 0 (0.0%) |
| Total | 405 (100.0%) | 98 (100.0%) |
Monthly Housing Cost Tiers in Morton
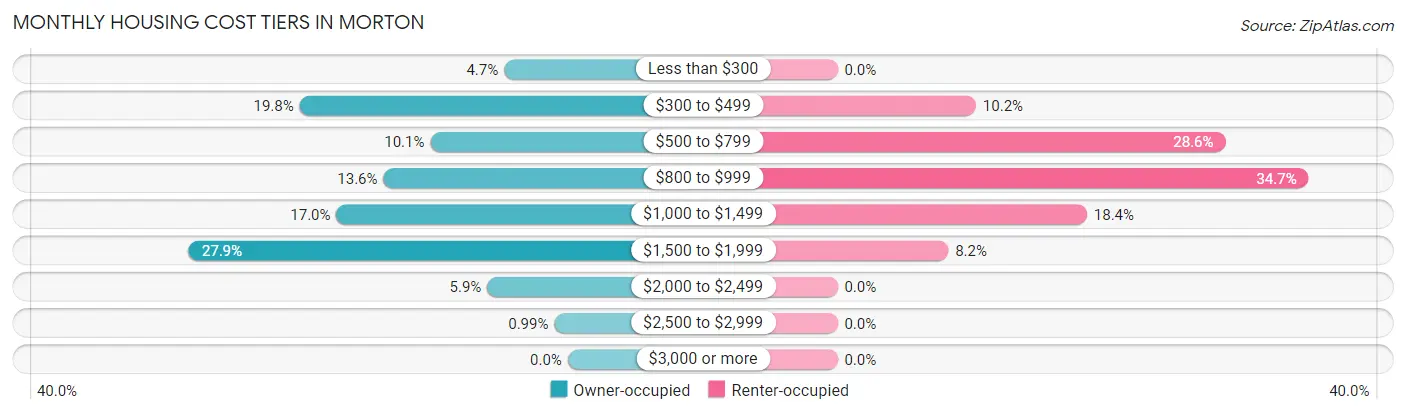
| Monthly Cost | Owner-occupied | Renter-occupied |
| Less than $300 | 19 (4.7%) | 0 (0.0%) |
| $300 to $499 | 80 (19.8%) | 10 (10.2%) |
| $500 to $799 | 41 (10.1%) | 28 (28.6%) |
| $800 to $999 | 55 (13.6%) | 34 (34.7%) |
| $1,000 to $1,499 | 69 (17.0%) | 18 (18.4%) |
| $1,500 to $1,999 | 113 (27.9%) | 8 (8.2%) |
| $2,000 to $2,499 | 24 (5.9%) | 0 (0.0%) |
| $2,500 to $2,999 | 4 (1.0%) | 0 (0.0%) |
| $3,000 or more | 0 (0.0%) | 0 (0.0%) |
| Total | 405 (100.0%) | 98 (100.0%) |
Physical Housing Characteristics in Morton
Housing Structures in Morton
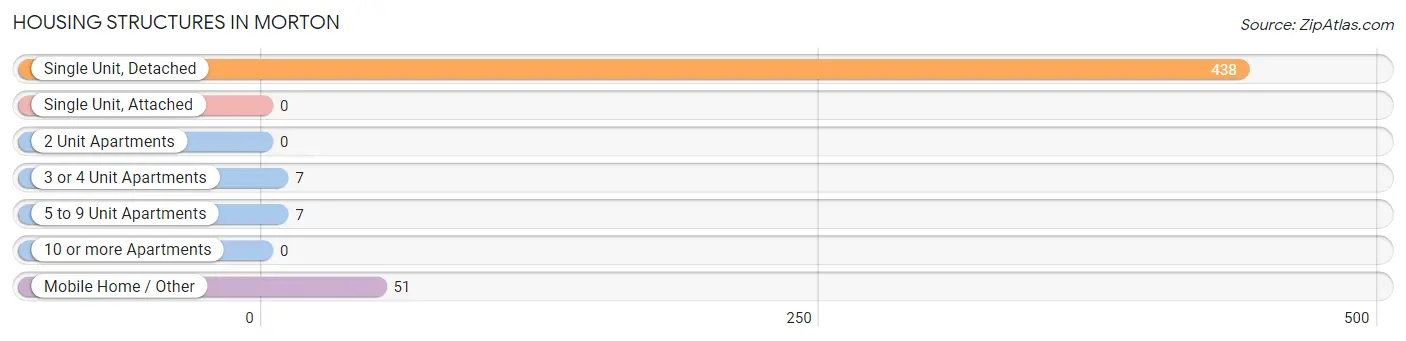
| Structure Type | # Housing Units | % Housing Units |
| Single Unit, Detached | 438 | 87.1% |
| Single Unit, Attached | 0 | 0.0% |
| 2 Unit Apartments | 0 | 0.0% |
| 3 or 4 Unit Apartments | 7 | 1.4% |
| 5 to 9 Unit Apartments | 7 | 1.4% |
| 10 or more Apartments | 0 | 0.0% |
| Mobile Home / Other | 51 | 10.1% |
| Total | 503 | 100.0% |
Housing Structures by Occupancy in Morton
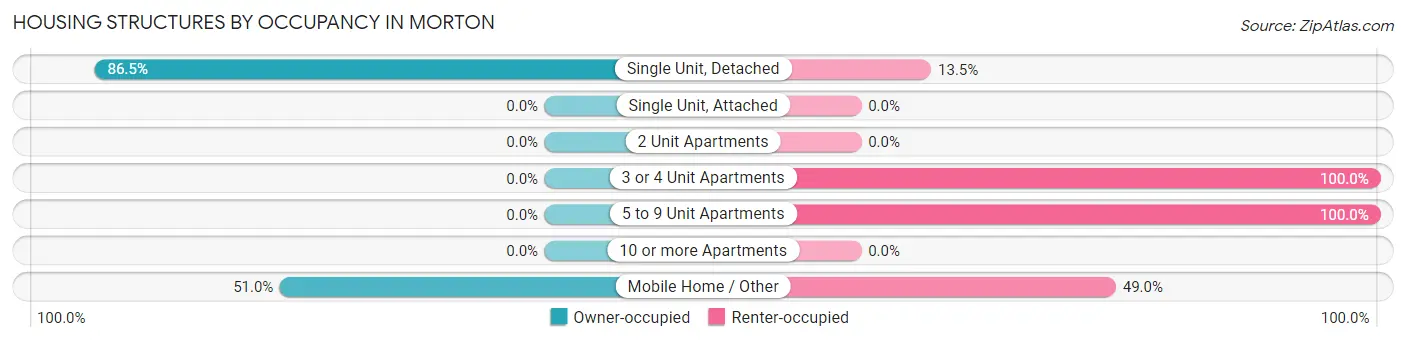
| Structure Type | Owner-occupied | Renter-occupied |
| Single Unit, Detached | 379 (86.5%) | 59 (13.5%) |
| Single Unit, Attached | 0 (0.0%) | 0 (0.0%) |
| 2 Unit Apartments | 0 (0.0%) | 0 (0.0%) |
| 3 or 4 Unit Apartments | 0 (0.0%) | 7 (100.0%) |
| 5 to 9 Unit Apartments | 0 (0.0%) | 7 (100.0%) |
| 10 or more Apartments | 0 (0.0%) | 0 (0.0%) |
| Mobile Home / Other | 26 (51.0%) | 25 (49.0%) |
| Total | 405 (80.5%) | 98 (19.5%) |
Housing Structures by Number of Rooms in Morton
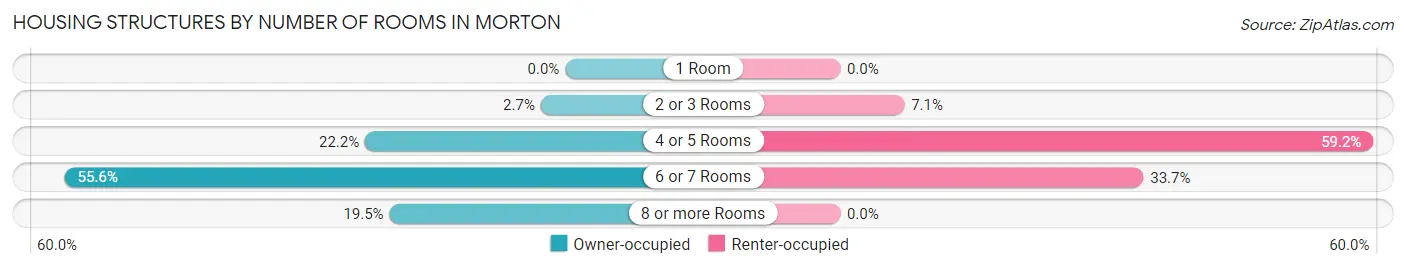
| Number of Rooms | Owner-occupied | Renter-occupied |
| 1 Room | 0 (0.0%) | 0 (0.0%) |
| 2 or 3 Rooms | 11 (2.7%) | 7 (7.1%) |
| 4 or 5 Rooms | 90 (22.2%) | 58 (59.2%) |
| 6 or 7 Rooms | 225 (55.6%) | 33 (33.7%) |
| 8 or more Rooms | 79 (19.5%) | 0 (0.0%) |
| Total | 405 (100.0%) | 98 (100.0%) |
Housing Structure by Heating Type in Morton
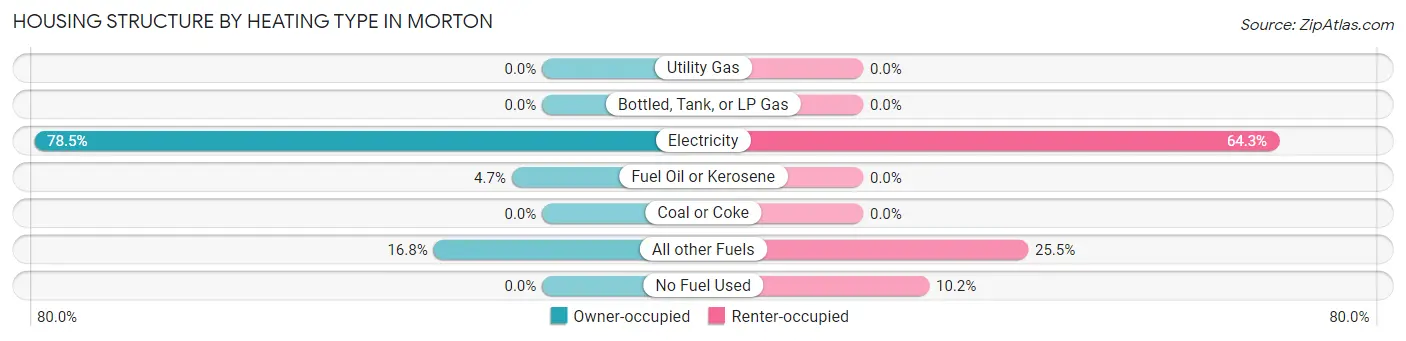
| Heating Type | Owner-occupied | Renter-occupied |
| Utility Gas | 0 (0.0%) | 0 (0.0%) |
| Bottled, Tank, or LP Gas | 0 (0.0%) | 0 (0.0%) |
| Electricity | 318 (78.5%) | 63 (64.3%) |
| Fuel Oil or Kerosene | 19 (4.7%) | 0 (0.0%) |
| Coal or Coke | 0 (0.0%) | 0 (0.0%) |
| All other Fuels | 68 (16.8%) | 25 (25.5%) |
| No Fuel Used | 0 (0.0%) | 10 (10.2%) |
| Total | 405 (100.0%) | 98 (100.0%) |
Household Vehicle Usage in Morton
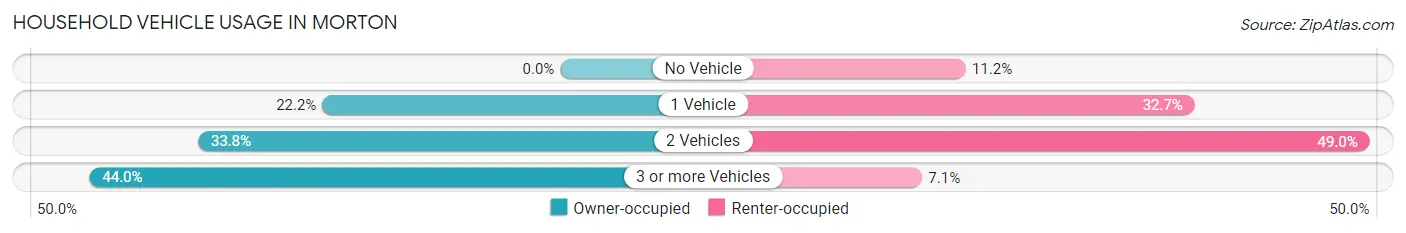
| Vehicles per Household | Owner-occupied | Renter-occupied |
| No Vehicle | 0 (0.0%) | 11 (11.2%) |
| 1 Vehicle | 90 (22.2%) | 32 (32.7%) |
| 2 Vehicles | 137 (33.8%) | 48 (49.0%) |
| 3 or more Vehicles | 178 (44.0%) | 7 (7.1%) |
| Total | 405 (100.0%) | 98 (100.0%) |
Real Estate & Mortgages in Morton
Real Estate and Mortgage Overview in Morton
| Characteristic | Without Mortgage | With Mortgage |
| Housing Units | 159 | 246 |
| Median Property Value | $237,100 | $241,300 |
| Median Household Income | $36,875 | $15 |
| Monthly Housing Costs | $419 | $0 |
| Real Estate Taxes | $2,097 | $0 |
Property Value by Mortgage Status in Morton
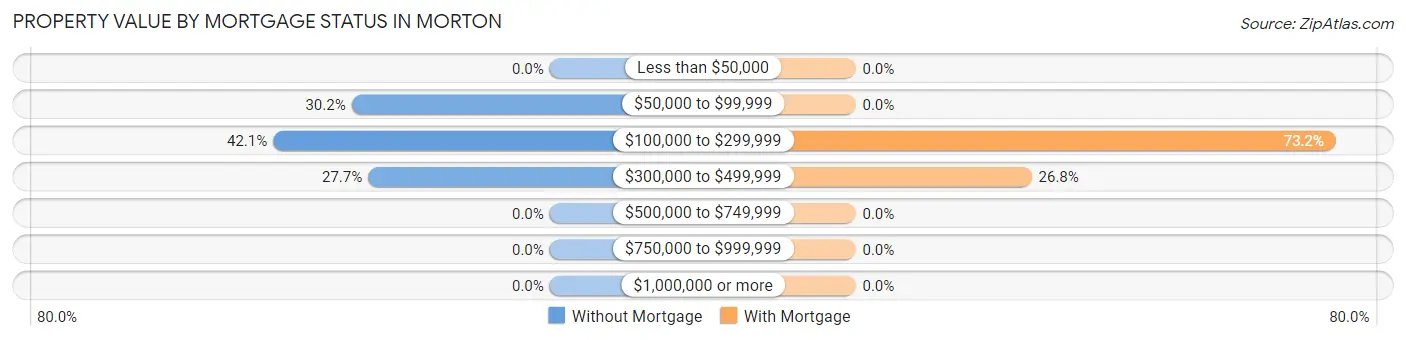
| Property Value | Without Mortgage | With Mortgage |
| Less than $50,000 | 0 (0.0%) | 0 (0.0%) |
| $50,000 to $99,999 | 48 (30.2%) | 0 (0.0%) |
| $100,000 to $299,999 | 67 (42.1%) | 180 (73.2%) |
| $300,000 to $499,999 | 44 (27.7%) | 66 (26.8%) |
| $500,000 to $749,999 | 0 (0.0%) | 0 (0.0%) |
| $750,000 to $999,999 | 0 (0.0%) | 0 (0.0%) |
| $1,000,000 or more | 0 (0.0%) | 0 (0.0%) |
| Total | 159 (100.0%) | 246 (100.0%) |
Household Income by Mortgage Status in Morton
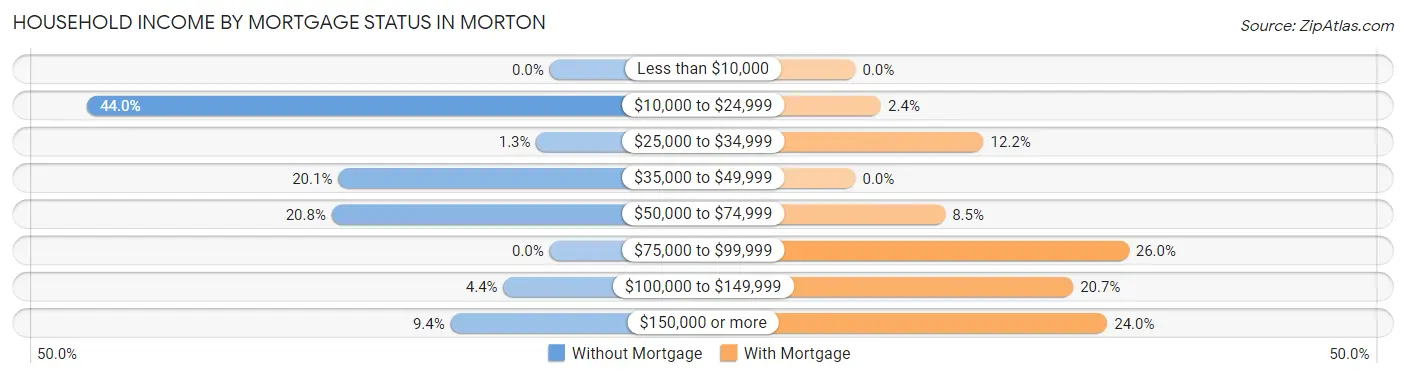
| Household Income | Without Mortgage | With Mortgage |
| Less than $10,000 | 0 (0.0%) | 0 (0.0%) |
| $10,000 to $24,999 | 70 (44.0%) | 6 (2.4%) |
| $25,000 to $34,999 | 2 (1.3%) | 30 (12.2%) |
| $35,000 to $49,999 | 32 (20.1%) | 0 (0.0%) |
| $50,000 to $74,999 | 33 (20.7%) | 21 (8.5%) |
| $75,000 to $99,999 | 0 (0.0%) | 64 (26.0%) |
| $100,000 to $149,999 | 7 (4.4%) | 51 (20.7%) |
| $150,000 or more | 15 (9.4%) | 59 (24.0%) |
| Total | 159 (100.0%) | 246 (100.0%) |
Property Value to Household Income Ratio in Morton

| Value-to-Income Ratio | Without Mortgage | With Mortgage |
| Less than 2.0x | 32 (20.1%) | 75,135 (30,542.7%) |
| 2.0x to 2.9x | 10 (6.3%) | 52 (21.1%) |
| 3.0x to 3.9x | 9 (5.7%) | 76 (30.9%) |
| 4.0x or more | 108 (67.9%) | 34 (13.8%) |
| Total | 159 (100.0%) | 246 (100.0%) |
Real Estate Taxes by Mortgage Status in Morton
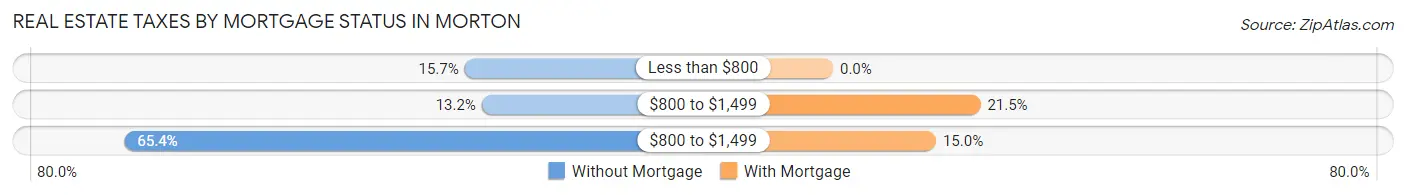
| Property Taxes | Without Mortgage | With Mortgage |
| Less than $800 | 25 (15.7%) | 0 (0.0%) |
| $800 to $1,499 | 21 (13.2%) | 53 (21.5%) |
| $800 to $1,499 | 104 (65.4%) | 37 (15.0%) |
| Total | 159 (100.0%) | 246 (100.0%) |
Health & Disability in Morton
Health Insurance Coverage by Age in Morton
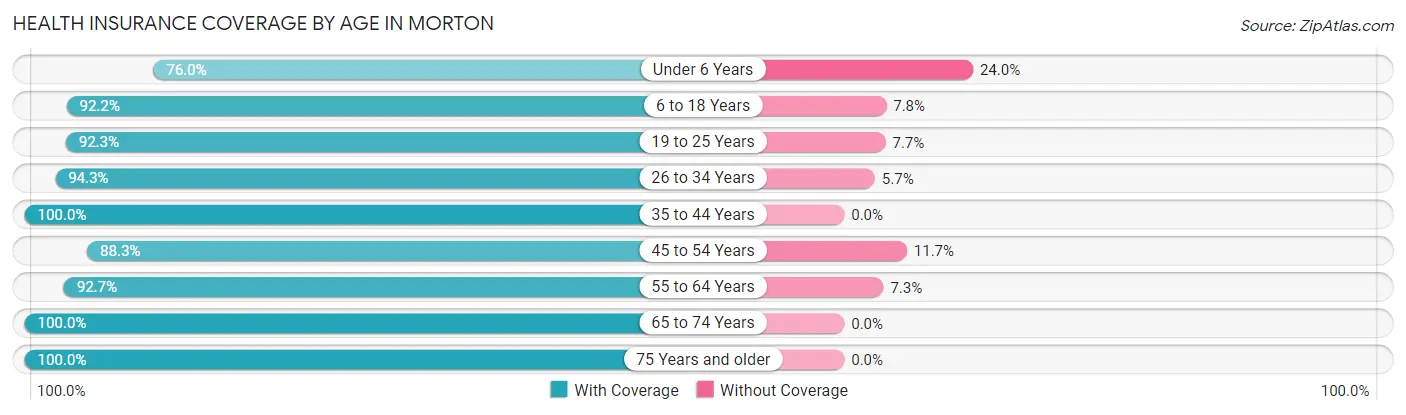
| Age Bracket | With Coverage | Without Coverage |
| Under 6 Years | 19 (76.0%) | 6 (24.0%) |
| 6 to 18 Years | 212 (92.2%) | 18 (7.8%) |
| 19 to 25 Years | 60 (92.3%) | 5 (7.7%) |
| 26 to 34 Years | 66 (94.3%) | 4 (5.7%) |
| 35 to 44 Years | 238 (100.0%) | 0 (0.0%) |
| 45 to 54 Years | 106 (88.3%) | 14 (11.7%) |
| 55 to 64 Years | 241 (92.7%) | 19 (7.3%) |
| 65 to 74 Years | 178 (100.0%) | 0 (0.0%) |
| 75 Years and older | 88 (100.0%) | 0 (0.0%) |
| Total | 1,208 (94.8%) | 66 (5.2%) |
Health Insurance Coverage by Citizenship Status in Morton
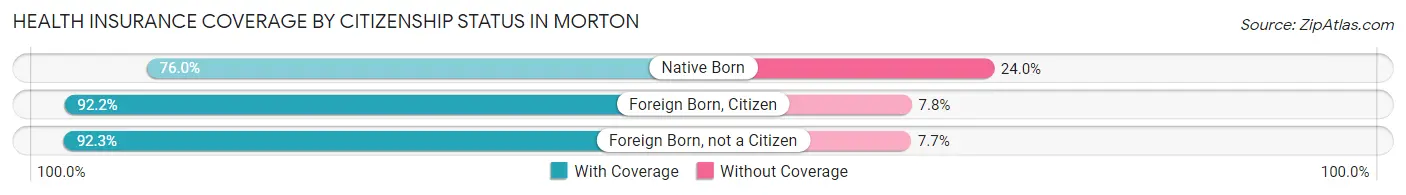
| Citizenship Status | With Coverage | Without Coverage |
| Native Born | 19 (76.0%) | 6 (24.0%) |
| Foreign Born, Citizen | 212 (92.2%) | 18 (7.8%) |
| Foreign Born, not a Citizen | 60 (92.3%) | 5 (7.7%) |
Health Insurance Coverage by Household Income in Morton
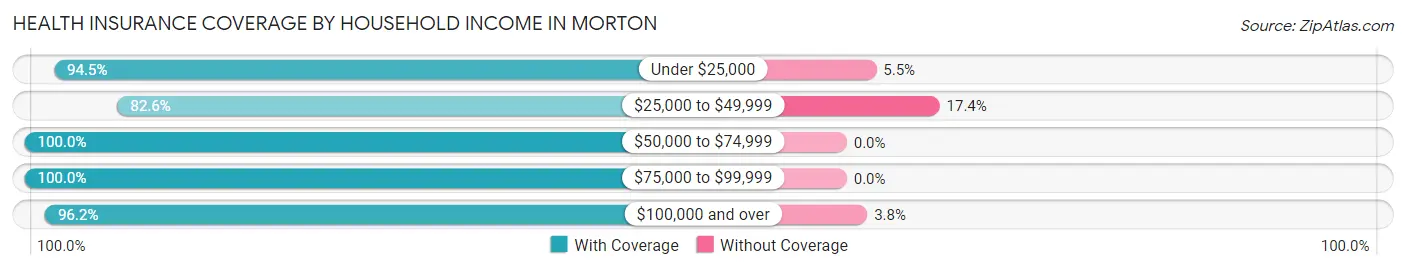
| Household Income | With Coverage | Without Coverage |
| Under $25,000 | 188 (94.5%) | 11 (5.5%) |
| $25,000 to $49,999 | 190 (82.6%) | 40 (17.4%) |
| $50,000 to $74,999 | 217 (100.0%) | 0 (0.0%) |
| $75,000 to $99,999 | 229 (100.0%) | 0 (0.0%) |
| $100,000 and over | 377 (96.2%) | 15 (3.8%) |
Public vs Private Health Insurance Coverage by Age in Morton
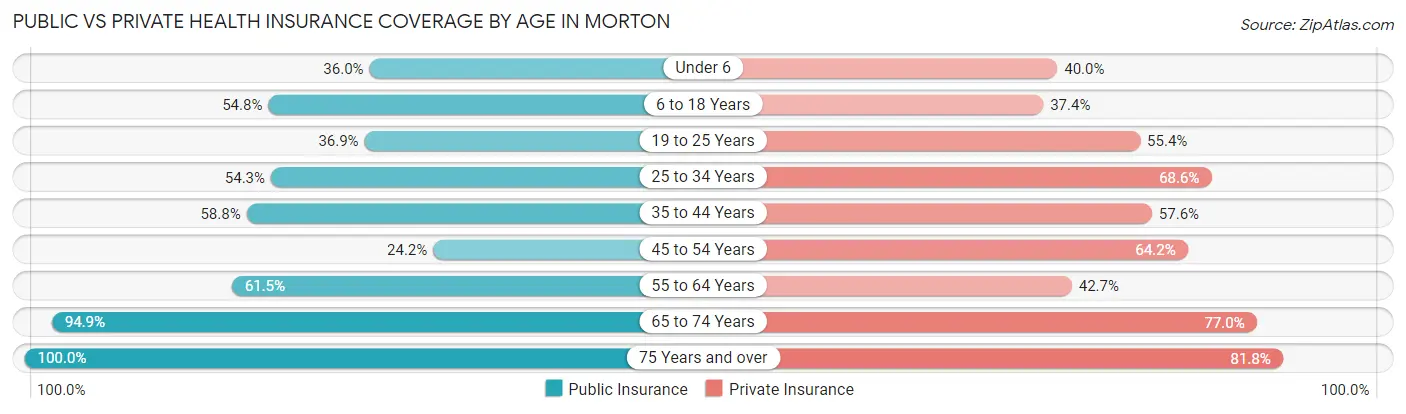
| Age Bracket | Public Insurance | Private Insurance |
| Under 6 | 9 (36.0%) | 10 (40.0%) |
| 6 to 18 Years | 126 (54.8%) | 86 (37.4%) |
| 19 to 25 Years | 24 (36.9%) | 36 (55.4%) |
| 25 to 34 Years | 38 (54.3%) | 48 (68.6%) |
| 35 to 44 Years | 140 (58.8%) | 137 (57.6%) |
| 45 to 54 Years | 29 (24.2%) | 77 (64.2%) |
| 55 to 64 Years | 160 (61.5%) | 111 (42.7%) |
| 65 to 74 Years | 169 (94.9%) | 137 (77.0%) |
| 75 Years and over | 88 (100.0%) | 72 (81.8%) |
| Total | 783 (61.5%) | 714 (56.0%) |
Disability Status by Sex by Age in Morton
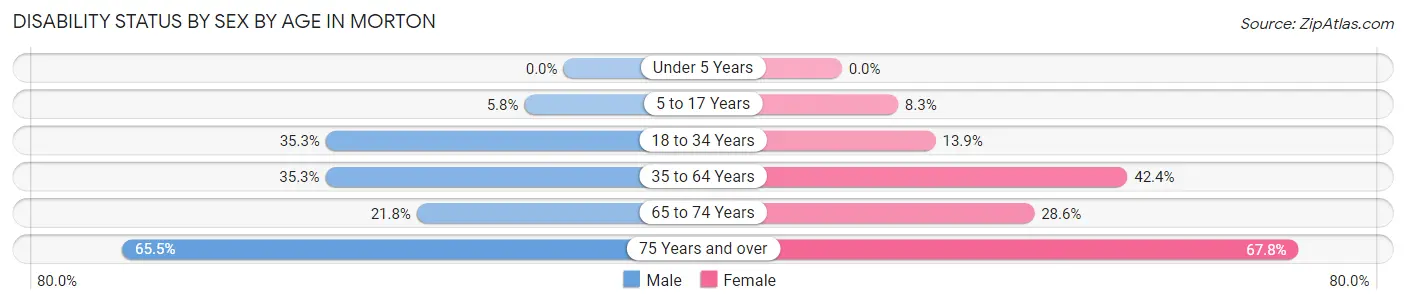
| Age Bracket | Male | Female |
| Under 5 Years | 0 (0.0%) | 0 (0.0%) |
| 5 to 17 Years | 8 (5.8%) | 7 (8.3%) |
| 18 to 34 Years | 24 (35.3%) | 11 (13.9%) |
| 35 to 64 Years | 100 (35.3%) | 142 (42.4%) |
| 65 to 74 Years | 22 (21.8%) | 22 (28.6%) |
| 75 Years and over | 19 (65.5%) | 40 (67.8%) |
Disability Class by Sex by Age in Morton
Disability Class: Hearing Difficulty
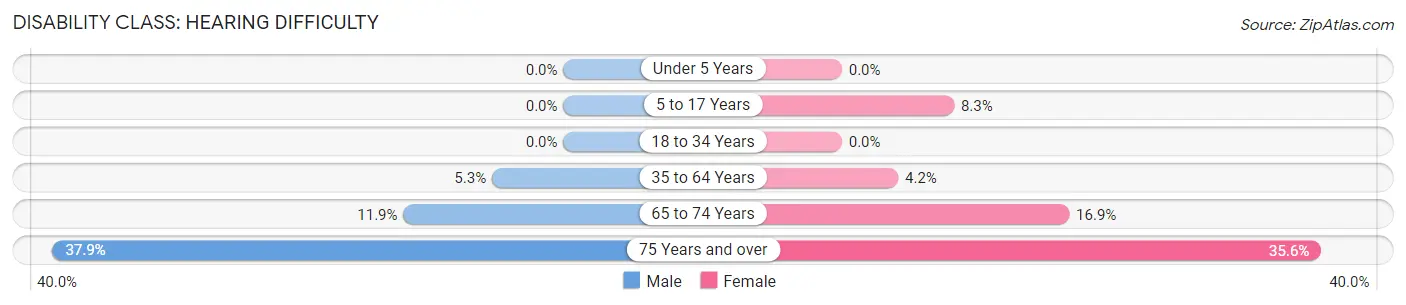
| Age Bracket | Male | Female |
| Under 5 Years | 0 (0.0%) | 0 (0.0%) |
| 5 to 17 Years | 0 (0.0%) | 7 (8.3%) |
| 18 to 34 Years | 0 (0.0%) | 0 (0.0%) |
| 35 to 64 Years | 15 (5.3%) | 14 (4.2%) |
| 65 to 74 Years | 12 (11.9%) | 13 (16.9%) |
| 75 Years and over | 11 (37.9%) | 21 (35.6%) |
Disability Class: Vision Difficulty
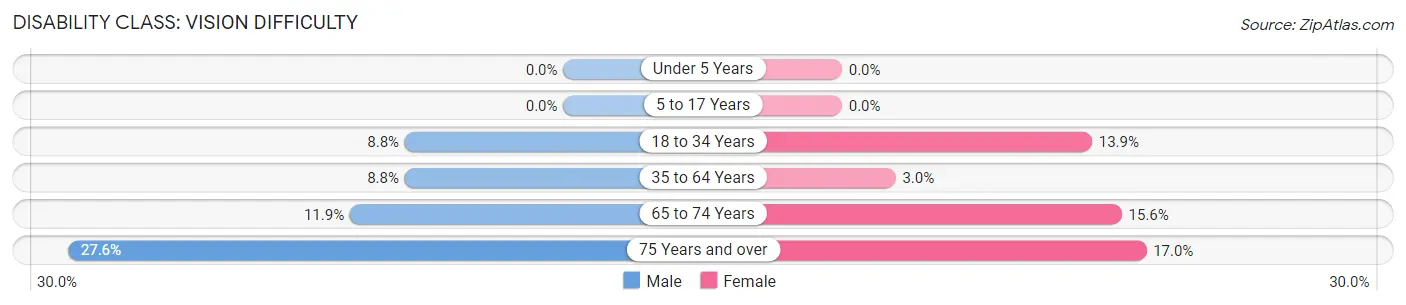
| Age Bracket | Male | Female |
| Under 5 Years | 0 (0.0%) | 0 (0.0%) |
| 5 to 17 Years | 0 (0.0%) | 0 (0.0%) |
| 18 to 34 Years | 6 (8.8%) | 11 (13.9%) |
| 35 to 64 Years | 25 (8.8%) | 10 (3.0%) |
| 65 to 74 Years | 12 (11.9%) | 12 (15.6%) |
| 75 Years and over | 8 (27.6%) | 10 (17.0%) |
Disability Class: Cognitive Difficulty
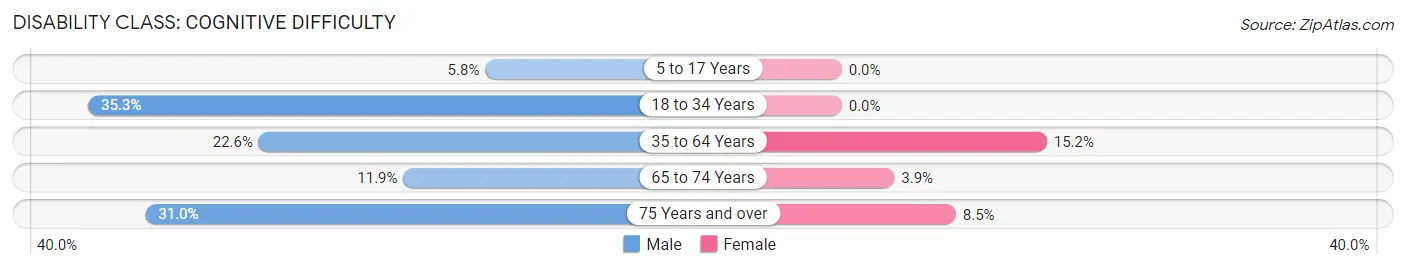
| Age Bracket | Male | Female |
| 5 to 17 Years | 8 (5.8%) | 0 (0.0%) |
| 18 to 34 Years | 24 (35.3%) | 0 (0.0%) |
| 35 to 64 Years | 64 (22.6%) | 51 (15.2%) |
| 65 to 74 Years | 12 (11.9%) | 3 (3.9%) |
| 75 Years and over | 9 (31.0%) | 5 (8.5%) |
Disability Class: Ambulatory Difficulty
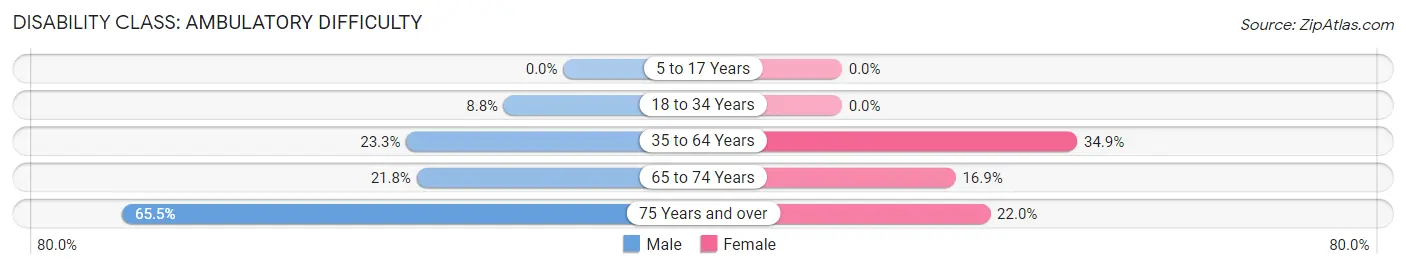
| Age Bracket | Male | Female |
| 5 to 17 Years | 0 (0.0%) | 0 (0.0%) |
| 18 to 34 Years | 6 (8.8%) | 0 (0.0%) |
| 35 to 64 Years | 66 (23.3%) | 117 (34.9%) |
| 65 to 74 Years | 22 (21.8%) | 13 (16.9%) |
| 75 Years and over | 19 (65.5%) | 13 (22.0%) |
Disability Class: Self-Care Difficulty
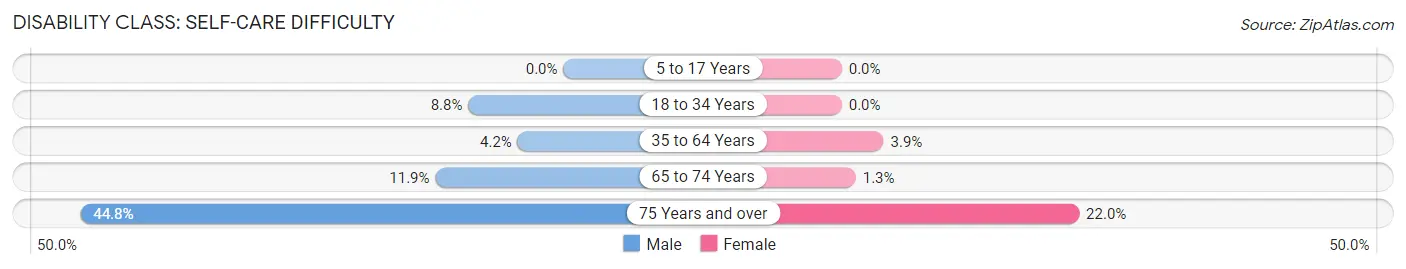
| Age Bracket | Male | Female |
| 5 to 17 Years | 0 (0.0%) | 0 (0.0%) |
| 18 to 34 Years | 6 (8.8%) | 0 (0.0%) |
| 35 to 64 Years | 12 (4.2%) | 13 (3.9%) |
| 65 to 74 Years | 12 (11.9%) | 1 (1.3%) |
| 75 Years and over | 13 (44.8%) | 13 (22.0%) |
Technology Access in Morton
Computing Device Access in Morton
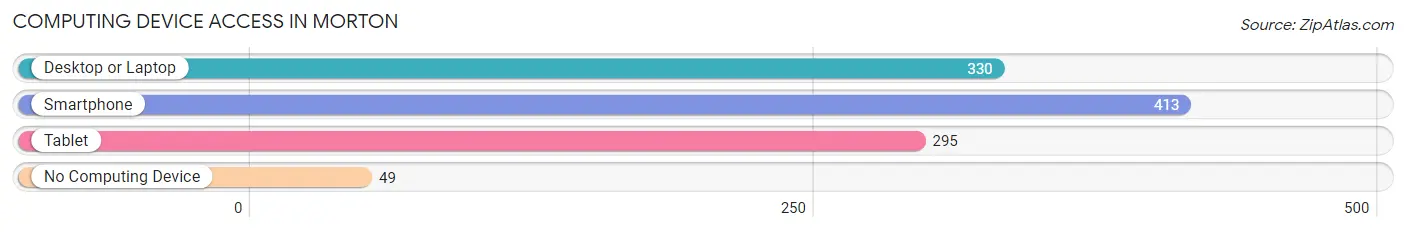
| Device Type | # Households | % Households |
| Desktop or Laptop | 330 | 65.6% |
| Smartphone | 413 | 82.1% |
| Tablet | 295 | 58.7% |
| No Computing Device | 49 | 9.7% |
| Total | 503 | 100.0% |
Internet Access in Morton
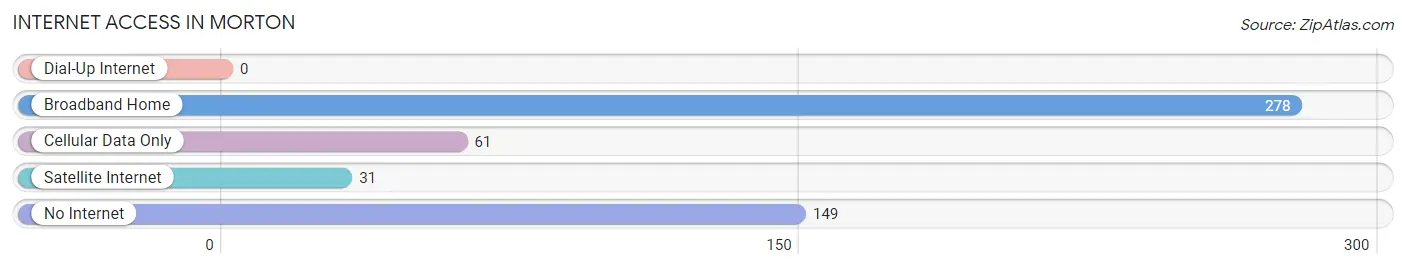
| Internet Type | # Households | % Households |
| Dial-Up Internet | 0 | 0.0% |
| Broadband Home | 278 | 55.3% |
| Cellular Data Only | 61 | 12.1% |
| Satellite Internet | 31 | 6.2% |
| No Internet | 149 | 29.6% |
| Total | 503 | 100.0% |
Morton Summary
Morton is a small town located in Lewis County, Washington, United States. It is situated in the foothills of the Cascade Mountains, approximately 25 miles east of the city of Tacoma. The population of Morton was 1,717 at the 2010 census.
History
Morton was founded in 1883 by William Morton, a logger from Maine. He purchased a large tract of land in the area and began to log the surrounding forests. In 1884, he built a sawmill and a store, and the town of Morton was born. The town was named after William Morton, and the first post office was established in 1885.
In the early 1900s, Morton was a thriving logging town. The town had a population of over 1,000 people and was home to several businesses, including a hotel, a bank, a blacksmith shop, and a livery stable. The town also had a school, a church, and a library.
In the 1920s, the logging industry began to decline, and the population of Morton began to decline as well. By the 1950s, the population had dropped to just over 500 people.
Geography
Morton is located in the foothills of the Cascade Mountains, approximately 25 miles east of the city of Tacoma. The town is situated at an elevation of 1,000 feet above sea level. The town is surrounded by forests and is located near several rivers, including the Cowlitz River, the Tilton River, and the Nisqually River.
The climate in Morton is mild and temperate. Summers are warm and dry, while winters are cool and wet. The average annual temperature is around 50 degrees Fahrenheit.
Economy
Morton’s economy is largely based on logging and timber production. The town is home to several sawmills and lumber companies, and the surrounding forests provide a steady supply of timber for the local economy.
In addition to logging, Morton is also home to several small businesses, including restaurants, retail stores, and service providers. The town also has a small airport, which serves as a hub for private and commercial flights.
Demographics
As of the 2010 census, the population of Morton was 1,717. The racial makeup of the town was 94.3% White, 0.7% African American, 0.7% Native American, 0.7% Asian, 0.2% Pacific Islander, and 2.6% from other races. The median household income was $37,917, and the median family income was $45,938.
Morton is a small town with a rich history and a strong sense of community. The town is home to a diverse population and is surrounded by beautiful forests and rivers. The town’s economy is largely based on logging and timber production, and the town is home to several small businesses.
Common Questions
What is Per Capita Income in Morton?
Per Capita income in Morton is $26,056.
What is the Median Family Income in Morton?
Median Family Income in Morton is $60,417.
What is the Median Household income in Morton?
Median Household Income in Morton is $55,156.
What is Income or Wage Gap in Morton?
Income or Wage Gap in Morton is 41.4%.
Women in Morton earn 58.6 cents for every dollar earned by a man.
What is Inequality or Gini Index in Morton?
Inequality or Gini Index in Morton is 0.41.
What is the Total Population of Morton?
Total Population of Morton is 1,333.
What is the Total Male Population of Morton?
Total Male Population of Morton is 640.
What is the Total Female Population of Morton?
Total Female Population of Morton is 693.
What is the Ratio of Males per 100 Females in Morton?
There are 92.35 Males per 100 Females in Morton.
What is the Ratio of Females per 100 Males in Morton?
There are 108.28 Females per 100 Males in Morton.
What is the Median Population Age in Morton?
Median Population Age in Morton is 49.5 Years.
What is the Average Family Size in Morton
Average Family Size in Morton is 2.9 People.
What is the Average Household Size in Morton
Average Household Size in Morton is 2.5 People.
How Large is the Labor Force in Morton?
There are 507 People in the Labor Forcein in Morton.
What is the Percentage of People in the Labor Force in Morton?
45.9% of People are in the Labor Force in Morton.
What is the Unemployment Rate in Morton?
Unemployment Rate in Morton is 11.0%.