Cities with the Highest Percentage of Local Government Employees in Washington
RELATED REPORTS & OPTIONS
Local Government Employees
Washington
Compare Cities
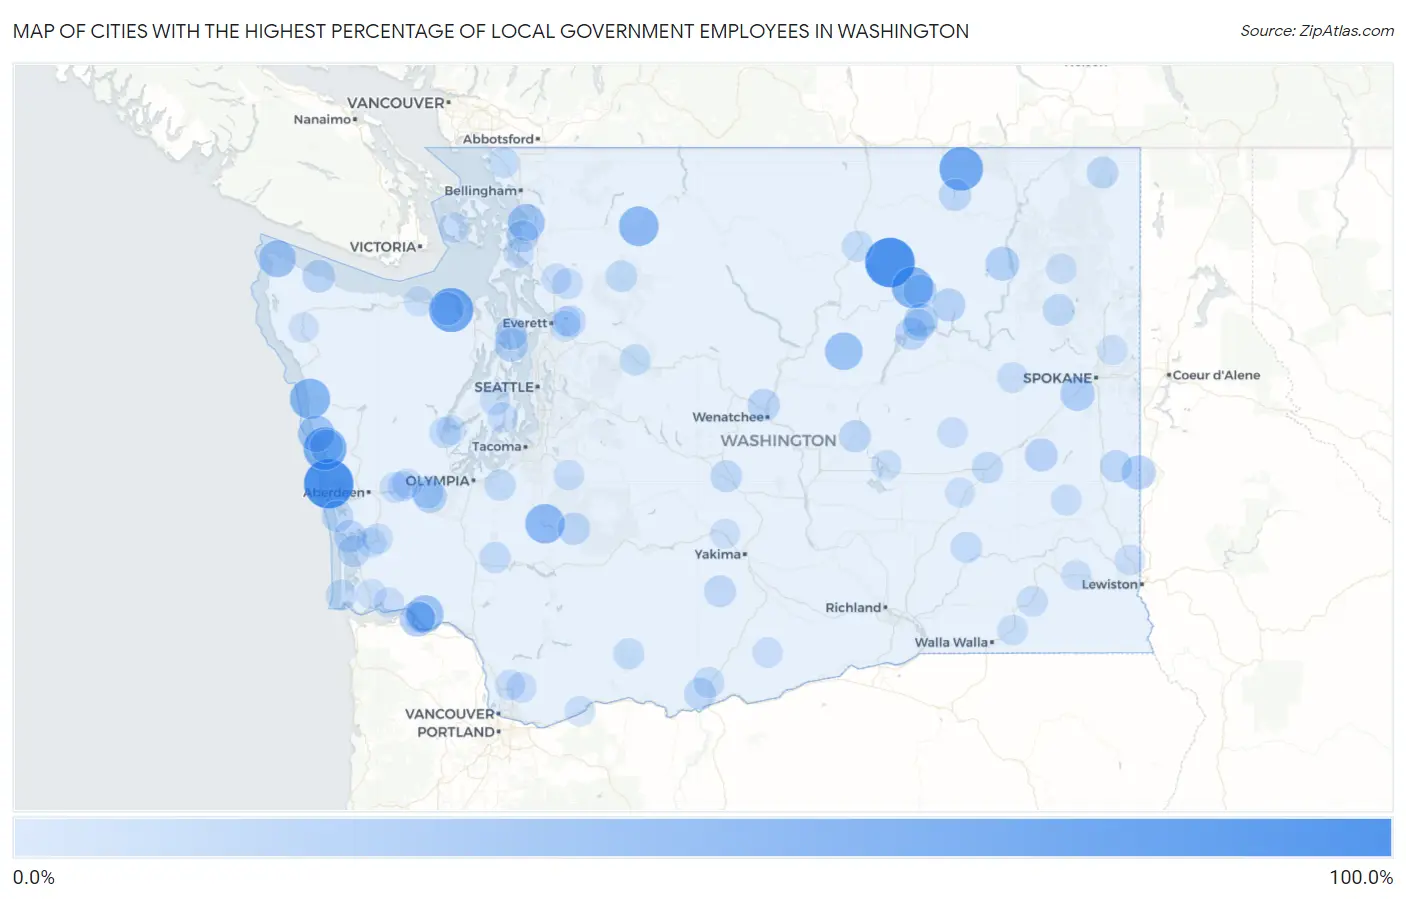
Map of Cities with the Highest Percentage of Local Government Employees in Washington
0.0%
100.0%
Cities with the Highest Percentage of Local Government Employees in Washington
| City | % Local Government Employees | vs State | vs National | |
| 1. | Wheeler | 100.0% | 7.1%(+92.9)#1 | 7.2%(+92.8)#5 |
| 2. | Oyehut | 100.0% | 7.1%(+92.9)#2 | 7.2%(+92.8)#30 |
| 3. | Disautel | 100.0% | 7.1%(+92.9)#3 | 7.2%(+92.8)#49 |
| 4. | Bell Hill | 76.0% | 7.1%(+68.9)#4 | 7.2%(+68.8)#92 |
| 5. | Curlew | 73.5% | 7.1%(+66.4)#5 | 7.2%(+66.3)#98 |
| 6. | Moclips | 70.5% | 7.1%(+63.4)#6 | 7.2%(+63.3)#110 |
| 7. | Nespelem Community | 62.7% | 7.1%(+55.6)#7 | 7.2%(+55.5)#149 |
| 8. | Queets | 58.3% | 7.1%(+51.2)#8 | 7.2%(+51.1)#179 |
| 9. | Marblemount | 55.3% | 7.1%(+48.2)#9 | 7.2%(+48.1)#206 |
| 10. | Alder | 54.5% | 7.1%(+47.5)#10 | 7.2%(+47.3)#215 |
| 11. | Sunland Estates | 50.0% | 7.1%(+42.9)#11 | 7.2%(+42.8)#278 |
| 12. | Mansfield | 46.3% | 7.1%(+39.2)#12 | 7.2%(+39.1)#353 |
| 13. | Upper Elochoman | 44.4% | 7.1%(+37.4)#13 | 7.2%(+37.2)#380 |
| 14. | Edison | 43.5% | 7.1%(+36.4)#14 | 7.2%(+36.3)#407 |
| 15. | Neah Bay | 43.4% | 7.1%(+36.3)#15 | 7.2%(+36.2)#409 |
| 16. | Taholah | 41.9% | 7.1%(+34.8)#16 | 7.2%(+34.7)#436 |
| 17. | Cathlamet | 37.9% | 7.1%(+30.8)#17 | 7.2%(+30.7)#534 |
| 18. | Bow | 37.0% | 7.1%(+29.9)#18 | 7.2%(+29.7)#565 |
| 19. | Four Lakes | 31.9% | 7.1%(+24.8)#19 | 7.2%(+24.7)#788 |
| 20. | Schwana | 31.4% | 7.1%(+24.3)#20 | 7.2%(+24.2)#815 |
| 21. | Farmington | 30.9% | 7.1%(+23.8)#21 | 7.2%(+23.7)#845 |
| 22. | Inchelium | 30.8% | 7.1%(+23.7)#22 | 7.2%(+23.5)#851 |
| 23. | Port Gamble Tribal Community | 28.9% | 7.1%(+21.8)#23 | 7.2%(+21.7)#962 |
| 24. | Nespelem | 28.9% | 7.1%(+21.8)#24 | 7.2%(+21.7)#963 |
| 25. | Qui Nai Elt Village | 28.6% | 7.1%(+21.5)#25 | 7.2%(+21.3)#987 |
| 26. | Elmer City | 28.4% | 7.1%(+21.3)#26 | 7.2%(+21.2)#998 |
| 27. | Porter | 28.0% | 7.1%(+20.9)#27 | 7.2%(+20.8)#1,022 |
| 28. | Keller | 27.0% | 7.1%(+19.9)#28 | 7.2%(+19.8)#1,107 |
| 29. | River Road | 27.0% | 7.1%(+19.9)#29 | 7.2%(+19.7)#1,114 |
| 30. | Lamont | 26.4% | 7.1%(+19.3)#30 | 7.2%(+19.2)#1,163 |
| 31. | Clallam Bay | 25.7% | 7.1%(+18.6)#31 | 7.2%(+18.4)#1,222 |
| 32. | Electric City | 24.9% | 7.1%(+17.8)#32 | 7.2%(+17.7)#1,317 |
| 33. | Sunnyslope | 24.0% | 7.1%(+16.9)#33 | 7.2%(+16.7)#1,405 |
| 34. | Ashford | 23.8% | 7.1%(+16.7)#34 | 7.2%(+16.6)#1,430 |
| 35. | Tokeland | 23.7% | 7.1%(+16.6)#35 | 7.2%(+16.5)#1,438 |
| 36. | Oakesdale | 23.6% | 7.1%(+16.5)#36 | 7.2%(+16.3)#1,448 |
| 37. | Hansville | 23.5% | 7.1%(+16.4)#37 | 7.2%(+16.3)#1,457 |
| 38. | Curlew Lake | 23.1% | 7.1%(+16.0)#38 | 7.2%(+15.8)#1,509 |
| 39. | Ephrata | 22.9% | 7.1%(+15.8)#39 | 7.2%(+15.7)#1,536 |
| 40. | Malone | 22.5% | 7.1%(+15.4)#40 | 7.2%(+15.3)#1,594 |
| 41. | Bay View | 22.5% | 7.1%(+15.4)#41 | 7.2%(+15.3)#1,600 |
| 42. | Coulee Dam | 22.4% | 7.1%(+15.3)#42 | 7.2%(+15.2)#1,614 |
| 43. | Centerville | 22.2% | 7.1%(+15.1)#43 | 7.2%(+15.0)#1,658 |
| 44. | White Swan | 22.0% | 7.1%(+14.9)#44 | 7.2%(+14.7)#1,693 |
| 45. | Thorp | 22.0% | 7.1%(+14.9)#45 | 7.2%(+14.7)#1,698 |
| 46. | Metaline Falls | 21.7% | 7.1%(+14.6)#46 | 7.2%(+14.5)#1,724 |
| 47. | Bay Center | 21.7% | 7.1%(+14.6)#47 | 7.2%(+14.5)#1,725 |
| 48. | Machias | 21.5% | 7.1%(+14.4)#48 | 7.2%(+14.3)#1,765 |
| 49. | Erlands Point | 21.5% | 7.1%(+14.4)#49 | 7.2%(+14.2)#1,769 |
| 50. | Grayland | 21.4% | 7.1%(+14.3)#50 | 7.2%(+14.2)#1,787 |
| 51. | Springdale | 21.2% | 7.1%(+14.1)#51 | 7.2%(+14.0)#1,805 |
| 52. | Darrington | 20.7% | 7.1%(+13.6)#52 | 7.2%(+13.4)#1,922 |
| 53. | Ritzville | 20.4% | 7.1%(+13.4)#53 | 7.2%(+13.2)#1,968 |
| 54. | Nisqually Indian Community | 19.8% | 7.1%(+12.7)#54 | 7.2%(+12.5)#2,105 |
| 55. | Onalaska | 19.5% | 7.1%(+12.4)#55 | 7.2%(+12.3)#2,155 |
| 56. | Skokomish | 19.1% | 7.1%(+12.0)#56 | 7.2%(+11.9)#2,253 |
| 57. | Omak | 18.9% | 7.1%(+11.8)#57 | 7.2%(+11.6)#2,324 |
| 58. | Kahlotus | 18.6% | 7.1%(+11.6)#58 | 7.2%(+11.4)#2,391 |
| 59. | Long Beach | 18.5% | 7.1%(+11.4)#59 | 7.2%(+11.2)#2,433 |
| 60. | Trout Lake | 18.4% | 7.1%(+11.3)#60 | 7.2%(+11.2)#2,453 |
| 61. | Baring | 18.2% | 7.1%(+11.1)#61 | 7.2%(+11.0)#2,518 |
| 62. | Goldendale | 18.2% | 7.1%(+11.1)#62 | 7.2%(+10.9)#2,536 |
| 63. | Custer | 18.0% | 7.1%(+10.9)#63 | 7.2%(+10.8)#2,561 |
| 64. | Endicott | 17.7% | 7.1%(+10.6)#64 | 7.2%(+10.5)#2,643 |
| 65. | Dayton | 17.5% | 7.1%(+10.4)#65 | 7.2%(+10.2)#2,730 |
| 66. | Arlington Heights | 17.4% | 7.1%(+10.4)#66 | 7.2%(+10.2)#2,744 |
| 67. | Montesano | 17.4% | 7.1%(+10.3)#67 | 7.2%(+10.2)#2,754 |
| 68. | Bunk Foss | 17.0% | 7.1%(+9.93)#68 | 7.2%(+9.80)#2,876 |
| 69. | Lower Elochoman | 17.0% | 7.1%(+9.92)#69 | 7.2%(+9.78)#2,880 |
| 70. | Davenport | 16.7% | 7.1%(+9.57)#70 | 7.2%(+9.44)#2,991 |
| 71. | Raymond | 16.6% | 7.1%(+9.51)#71 | 7.2%(+9.37)#3,066 |
| 72. | Gorst | 16.6% | 7.1%(+9.50)#72 | 7.2%(+9.37)#3,071 |
| 73. | Venersborg | 16.6% | 7.1%(+9.46)#73 | 7.2%(+9.33)#3,089 |
| 74. | Dixie | 16.4% | 7.1%(+9.33)#74 | 7.2%(+9.19)#3,149 |
| 75. | Odessa | 16.3% | 7.1%(+9.25)#75 | 7.2%(+9.11)#3,178 |
| 76. | Colton | 16.3% | 7.1%(+9.25)#76 | 7.2%(+9.11)#3,179 |
| 77. | La Conner | 16.3% | 7.1%(+9.24)#77 | 7.2%(+9.10)#3,182 |
| 78. | Cherry Grove | 16.3% | 7.1%(+9.18)#78 | 7.2%(+9.04)#3,216 |
| 79. | Clear Lake Cdp Skagit County | 16.2% | 7.1%(+9.15)#79 | 7.2%(+9.01)#3,225 |
| 80. | Burley | 15.9% | 7.1%(+8.85)#80 | 7.2%(+8.72)#3,351 |
| 81. | Satsop | 15.9% | 7.1%(+8.85)#81 | 7.2%(+8.71)#3,352 |
| 82. | Friday Harbor | 15.9% | 7.1%(+8.81)#82 | 7.2%(+8.68)#3,375 |
| 83. | Bryant | 15.8% | 7.1%(+8.70)#83 | 7.2%(+8.57)#3,432 |
| 84. | Carbonado | 15.6% | 7.1%(+8.54)#84 | 7.2%(+8.41)#3,537 |
| 85. | North Bonneville | 15.6% | 7.1%(+8.53)#85 | 7.2%(+8.40)#3,539 |
| 86. | Bickleton | 15.6% | 7.1%(+8.53)#86 | 7.2%(+8.40)#3,548 |
| 87. | Chewelah | 15.6% | 7.1%(+8.47)#87 | 7.2%(+8.34)#3,572 |
| 88. | Rosburg | 15.4% | 7.1%(+8.34)#88 | 7.2%(+8.20)#3,632 |
| 89. | Brady | 15.4% | 7.1%(+8.32)#89 | 7.2%(+8.19)#3,639 |
| 90. | Moses Lake | 15.4% | 7.1%(+8.29)#90 | 7.2%(+8.15)#3,671 |
| 91. | Pomeroy | 15.1% | 7.1%(+8.01)#91 | 7.2%(+7.87)#3,824 |
| 92. | Naselle | 15.0% | 7.1%(+7.89)#92 | 7.2%(+7.76)#3,900 |
| 93. | Union | 14.9% | 7.1%(+7.82)#93 | 7.2%(+7.68)#3,943 |
| 94. | South Bend | 14.8% | 7.1%(+7.70)#94 | 7.2%(+7.57)#4,006 |
| 95. | Forks | 14.7% | 7.1%(+7.61)#95 | 7.2%(+7.47)#4,059 |
| 96. | Green Bluff | 14.6% | 7.1%(+7.47)#96 | 7.2%(+7.34)#4,156 |
| 97. | Lind | 14.6% | 7.1%(+7.46)#97 | 7.2%(+7.32)#4,163 |
| 98. | Cavalero | 14.5% | 7.1%(+7.43)#98 | 7.2%(+7.30)#4,180 |
| 99. | Port Angeles East | 14.5% | 7.1%(+7.36)#99 | 7.2%(+7.22)#4,234 |
| 100. | Naches | 14.4% | 7.1%(+7.30)#100 | 7.2%(+7.17)#4,267 |
Common Questions
What are the Top 10 Cities with the Highest Percentage of Local Government Employees in Washington?
Top 10 Cities with the Highest Percentage of Local Government Employees in Washington are:
#1
100.0%
#2
100.0%
#3
76.0%
#4
73.5%
#5
70.5%
#6
62.7%
#7
58.3%
#8
55.3%
#9
54.5%
#10
46.3%
What city has the Highest Percentage of Local Government Employees in Washington?
Oyehut has the Highest Percentage of Local Government Employees in Washington with 100.0%.
What is the Percentage of Local Government Employees in the State of Washington?
Percentage of Local Government Employees in Washington is 7.1%.
What is the Percentage of Local Government Employees in the United States?
Percentage of Local Government Employees in the United States is 7.2%.