Cities with the Lowest Poverty Level Among Married Couples in Washington
RELATED REPORTS & OPTIONS
Lowest Poverty | Married Couple
Washington
Compare Cities
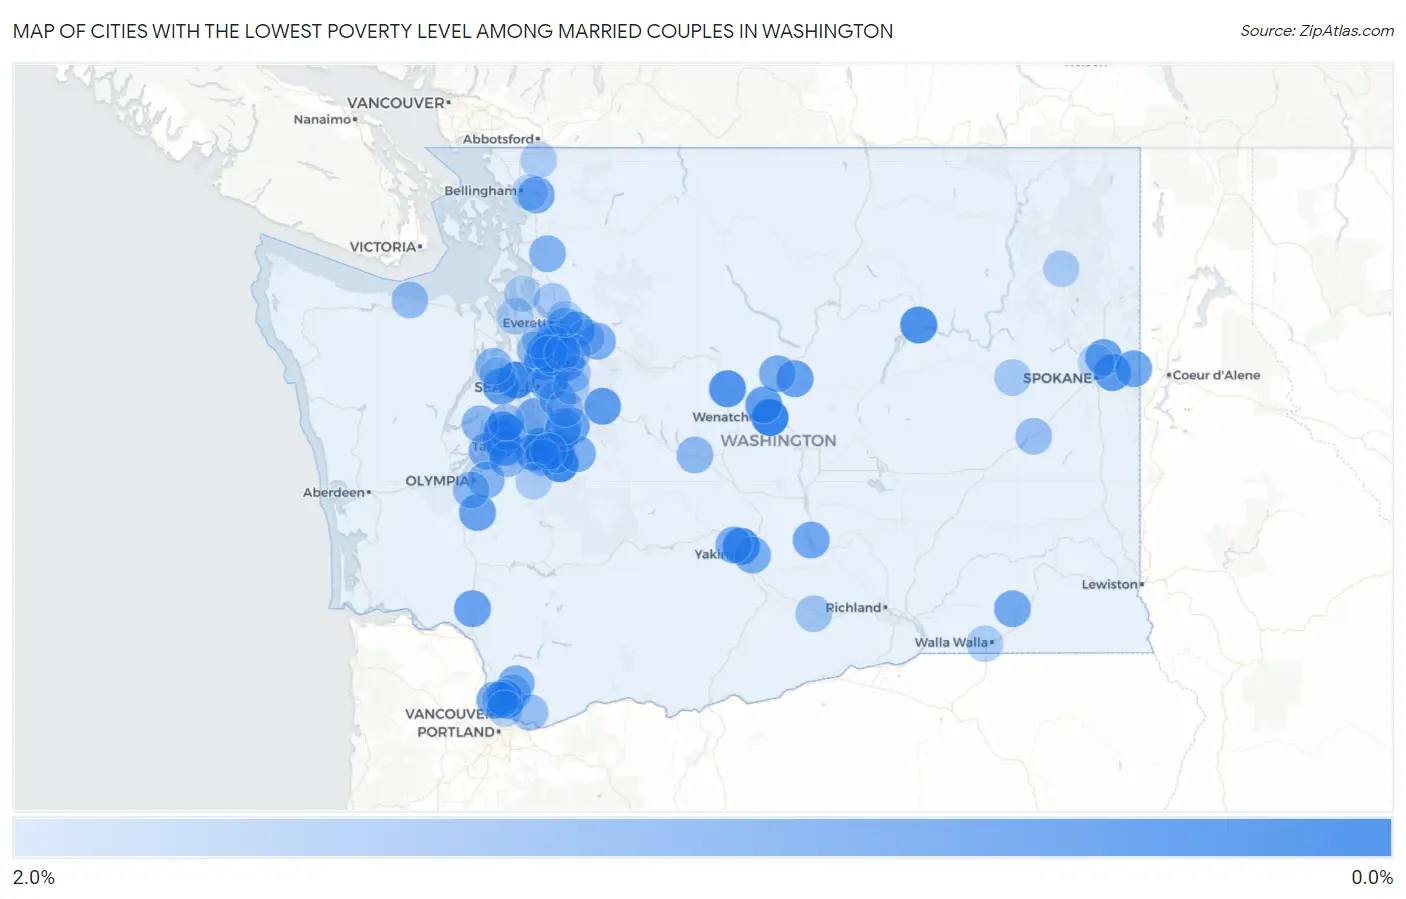
Map of Cities with the Lowest Poverty Level Among Married Couples in Washington
2.0%
0.0%
Cities with the Lowest Poverty Level Among Married Couples in Washington
| City | Married Couples Poverty | vs State | vs National | |
| 1. | East Wenatchee | 0.20% | 3.3%(-3.08)#1 | 4.5%(-4.26)#30 |
| 2. | Artondale | 0.24% | 3.3%(-3.05)#2 | 4.5%(-4.22)#44 |
| 3. | Bainbridge Island | 0.34% | 3.3%(-2.94)#3 | 4.5%(-4.12)#95 |
| 4. | Prairie Ridge | 0.35% | 3.3%(-2.93)#4 | 4.5%(-4.11)#105 |
| 5. | Selah | 0.44% | 3.3%(-2.84)#5 | 4.5%(-4.02)#186 |
| 6. | Barberton | 0.46% | 3.3%(-2.82)#6 | 4.5%(-4.00)#206 |
| 7. | Edgewood | 0.49% | 3.3%(-2.79)#7 | 4.5%(-3.97)#235 |
| 8. | Coulee Dam | 0.50% | 3.3%(-2.79)#8 | 4.5%(-3.97)#236 |
| 9. | Lake Tapps | 0.52% | 3.3%(-2.76)#9 | 4.5%(-3.94)#269 |
| 10. | Bonney Lake | 0.53% | 3.3%(-2.75)#10 | 4.5%(-3.93)#283 |
| 11. | Rosedale | 0.55% | 3.3%(-2.74)#11 | 4.5%(-3.91)#307 |
| 12. | Leavenworth | 0.55% | 3.3%(-2.73)#12 | 4.5%(-3.91)#312 |
| 13. | Lake Forest Park | 0.56% | 3.3%(-2.73)#13 | 4.5%(-3.90)#320 |
| 14. | Waller | 0.56% | 3.3%(-2.72)#14 | 4.5%(-3.90)#327 |
| 15. | Millwood | 0.66% | 3.3%(-2.62)#15 | 4.5%(-3.80)#470 |
| 16. | North Bend | 0.71% | 3.3%(-2.58)#16 | 4.5%(-3.75)#539 |
| 17. | Three Lakes | 0.72% | 3.3%(-2.56)#17 | 4.5%(-3.74)#565 |
| 18. | Fox Island | 0.75% | 3.3%(-2.54)#18 | 4.5%(-3.71)#614 |
| 19. | Sunnyslope | 0.78% | 3.3%(-2.50)#19 | 4.5%(-3.68)#694 |
| 20. | Tracyton | 0.79% | 3.3%(-2.49)#20 | 4.5%(-3.67)#731 |
| 21. | Clearview | 0.81% | 3.3%(-2.47)#21 | 4.5%(-3.65)#774 |
| 22. | Tehaleh | 0.83% | 3.3%(-2.46)#22 | 4.5%(-3.63)#819 |
| 23. | Waterville | 0.83% | 3.3%(-2.46)#23 | 4.5%(-3.63)#820 |
| 24. | Mead | 0.86% | 3.3%(-2.42)#24 | 4.5%(-3.60)#885 |
| 25. | Milton | 0.86% | 3.3%(-2.42)#25 | 4.5%(-3.60)#886 |
| 26. | Tenino | 0.87% | 3.3%(-2.41)#26 | 4.5%(-3.59)#906 |
| 27. | Castle Rock | 0.89% | 3.3%(-2.39)#27 | 4.5%(-3.57)#934 |
| 28. | Maple Valley | 0.90% | 3.3%(-2.38)#28 | 4.5%(-3.56)#964 |
| 29. | Bothell East | 0.93% | 3.3%(-2.36)#29 | 4.5%(-3.53)#1,028 |
| 30. | Suncrest | 0.93% | 3.3%(-2.35)#30 | 4.5%(-3.53)#1,040 |
| 31. | Felida | 0.95% | 3.3%(-2.33)#31 | 4.5%(-3.51)#1,080 |
| 32. | Otis Orchards East Farms | 0.96% | 3.3%(-2.32)#32 | 4.5%(-3.50)#1,112 |
| 33. | Desert Aire | 0.99% | 3.3%(-2.29)#33 | 4.5%(-3.47)#1,193 |
| 34. | Sudden Valley | 1.0% | 3.3%(-2.28)#34 | 4.5%(-3.46)#1,211 |
| 35. | Woodinville | 1.0% | 3.3%(-2.27)#35 | 4.5%(-3.45)#1,240 |
| 36. | Normandy Park | 1.0% | 3.3%(-2.27)#36 | 4.5%(-3.45)#1,244 |
| 37. | Waitsburg | 1.0% | 3.3%(-2.26)#37 | 4.5%(-3.44)#1,257 |
| 38. | Entiat | 1.1% | 3.3%(-2.23)#38 | 4.5%(-3.41)#1,327 |
| 39. | Cottage Lake | 1.1% | 3.3%(-2.21)#39 | 4.5%(-3.39)#1,376 |
| 40. | Alderwood Manor | 1.1% | 3.3%(-2.17)#40 | 4.5%(-3.35)#1,458 |
| 41. | Terrace Heights | 1.1% | 3.3%(-2.17)#41 | 4.5%(-3.35)#1,459 |
| 42. | Lewisville | 1.1% | 3.3%(-2.17)#42 | 4.5%(-3.35)#1,463 |
| 43. | Gleed | 1.1% | 3.3%(-2.16)#43 | 4.5%(-3.33)#1,495 |
| 44. | Medina | 1.1% | 3.3%(-2.15)#44 | 4.5%(-3.33)#1,510 |
| 45. | Enumclaw | 1.1% | 3.3%(-2.14)#45 | 4.5%(-3.31)#1,554 |
| 46. | Sultan | 1.2% | 3.3%(-2.11)#46 | 4.5%(-3.29)#1,609 |
| 47. | Eastmont | 1.2% | 3.3%(-2.11)#47 | 4.5%(-3.28)#1,629 |
| 48. | Longbranch | 1.2% | 3.3%(-2.10)#48 | 4.5%(-3.28)#1,643 |
| 49. | Gig Harbor | 1.2% | 3.3%(-2.06)#49 | 4.5%(-3.24)#1,743 |
| 50. | Lexington | 1.2% | 3.3%(-2.05)#50 | 4.5%(-3.23)#1,751 |
| 51. | Bunk Foss | 1.2% | 3.3%(-2.04)#51 | 4.5%(-3.22)#1,773 |
| 52. | Mill Creek East | 1.2% | 3.3%(-2.04)#52 | 4.5%(-3.21)#1,786 |
| 53. | Tanglewilde | 1.3% | 3.3%(-2.02)#53 | 4.5%(-3.20)#1,847 |
| 54. | Lake Morton Berrydale | 1.3% | 3.3%(-2.01)#54 | 4.5%(-3.19)#1,854 |
| 55. | Big Lake | 1.3% | 3.3%(-2.01)#55 | 4.5%(-3.19)#1,864 |
| 56. | Newcastle | 1.3% | 3.3%(-1.99)#56 | 4.5%(-3.16)#1,930 |
| 57. | Brier | 1.3% | 3.3%(-1.98)#57 | 4.5%(-3.15)#1,960 |
| 58. | Clyde Hill | 1.3% | 3.3%(-1.96)#58 | 4.5%(-3.14)#1,988 |
| 59. | Allyn | 1.3% | 3.3%(-1.96)#59 | 4.5%(-3.13)#2,004 |
| 60. | Tumwater | 1.3% | 3.3%(-1.95)#60 | 4.5%(-3.13)#2,009 |
| 61. | Bangor Base | 1.4% | 3.3%(-1.92)#61 | 4.5%(-3.09)#2,112 |
| 62. | Meadow Glade | 1.4% | 3.3%(-1.91)#62 | 4.5%(-3.09)#2,117 |
| 63. | Silver Firs | 1.4% | 3.3%(-1.89)#63 | 4.5%(-3.07)#2,185 |
| 64. | Mill Creek | 1.4% | 3.3%(-1.89)#64 | 4.5%(-3.07)#2,187 |
| 65. | Steilacoom | 1.4% | 3.3%(-1.89)#65 | 4.5%(-3.07)#2,191 |
| 66. | Cle Elum | 1.4% | 3.3%(-1.89)#66 | 4.5%(-3.07)#2,200 |
| 67. | Puyallup | 1.4% | 3.3%(-1.87)#67 | 4.5%(-3.05)#2,244 |
| 68. | Covington | 1.4% | 3.3%(-1.85)#68 | 4.5%(-3.02)#2,304 |
| 69. | Bothell | 1.5% | 3.3%(-1.82)#69 | 4.5%(-3.00)#2,382 |
| 70. | Port Angeles | 1.5% | 3.3%(-1.80)#70 | 4.5%(-2.98)#2,431 |
| 71. | East Renton Highlands | 1.5% | 3.3%(-1.80)#71 | 4.5%(-2.98)#2,432 |
| 72. | Fern Prairie | 1.5% | 3.3%(-1.77)#72 | 4.5%(-2.94)#2,538 |
| 73. | Sprague | 1.5% | 3.3%(-1.76)#73 | 4.5%(-2.94)#2,553 |
| 74. | Woods Creek | 1.5% | 3.3%(-1.75)#74 | 4.5%(-2.93)#2,562 |
| 75. | Purdy | 1.5% | 3.3%(-1.75)#75 | 4.5%(-2.92)#2,574 |
| 76. | Union Hill Novelty Hill | 1.6% | 3.3%(-1.72)#76 | 4.5%(-2.90)#2,628 |
| 77. | Sumner | 1.6% | 3.3%(-1.72)#77 | 4.5%(-2.90)#2,648 |
| 78. | High Bridge | 1.6% | 3.3%(-1.69)#78 | 4.5%(-2.87)#2,733 |
| 79. | Grandview | 1.6% | 3.3%(-1.67)#79 | 4.5%(-2.85)#2,794 |
| 80. | Edmonds | 1.6% | 3.3%(-1.67)#80 | 4.5%(-2.85)#2,795 |
| 81. | Picnic Point | 1.6% | 3.3%(-1.65)#81 | 4.5%(-2.83)#2,838 |
| 82. | Bothell West | 1.6% | 3.3%(-1.65)#82 | 4.5%(-2.83)#2,841 |
| 83. | Kitsap Lake | 1.6% | 3.3%(-1.65)#83 | 4.5%(-2.83)#2,843 |
| 84. | Marysville | 1.7% | 3.3%(-1.60)#84 | 4.5%(-2.77)#2,978 |
| 85. | Mount Vista | 1.7% | 3.3%(-1.59)#85 | 4.5%(-2.77)#2,994 |
| 86. | Davenport | 1.7% | 3.3%(-1.58)#86 | 4.5%(-2.76)#3,022 |
| 87. | Salmon Creek | 1.7% | 3.3%(-1.57)#87 | 4.5%(-2.75)#3,043 |
| 88. | Maltby | 1.7% | 3.3%(-1.55)#88 | 4.5%(-2.73)#3,097 |
| 89. | Sammamish | 1.8% | 3.3%(-1.51)#89 | 4.5%(-2.69)#3,195 |
| 90. | Elk Plain | 1.8% | 3.3%(-1.51)#90 | 4.5%(-2.69)#3,207 |
| 91. | Minnehaha | 1.8% | 3.3%(-1.50)#91 | 4.5%(-2.68)#3,218 |
| 92. | Garrett | 1.8% | 3.3%(-1.49)#92 | 4.5%(-2.67)#3,265 |
| 93. | Chewelah | 1.8% | 3.3%(-1.49)#93 | 4.5%(-2.66)#3,271 |
| 94. | Nooksack | 1.8% | 3.3%(-1.48)#94 | 4.5%(-2.66)#3,280 |
| 95. | Freeland | 1.8% | 3.3%(-1.48)#95 | 4.5%(-2.65)#3,299 |
| 96. | Camano | 1.8% | 3.3%(-1.47)#96 | 4.5%(-2.65)#3,301 |
| 97. | Lake Stevens | 1.9% | 3.3%(-1.43)#97 | 4.5%(-2.61)#3,409 |
| 98. | Country Homes | 1.9% | 3.3%(-1.41)#98 | 4.5%(-2.59)#3,460 |
| 99. | Geneva | 1.9% | 3.3%(-1.40)#99 | 4.5%(-2.58)#3,476 |
| 100. | Silverdale | 1.9% | 3.3%(-1.35)#100 | 4.5%(-2.53)#3,590 |
Common Questions
What are the Top 10 Cities with the Lowest Poverty Level Among Married Couples in Washington?
Top 10 Cities with the Lowest Poverty Level Among Married Couples in Washington are:
#1
0.20%
#2
0.24%
#3
0.34%
#4
0.35%
#5
0.44%
#6
0.46%
#7
0.49%
#8
0.50%
#9
0.52%
#10
0.53%
What city has the Lowest Poverty Level Among Married Couples in Washington?
East Wenatchee has the Lowest Poverty Level Among Married Couples in Washington with 0.20%.
What is the Poverty Level Among Married Couples in the State of Washington?
Poverty Level Among Married Couples in Washington is 3.3%.
What is the Poverty Level Among Married Couples in the United States?
Poverty Level Among Married Couples in the United States is 4.5%.