Torboy, WA Map & Demographics
Torboy Map
Torboy Overview
$13,147
PER CAPITA INCOME
0.30
INEQUALITY / GINI INDEX
227
TOTAL POPULATION
161
MALE POPULATION
66
FEMALE POPULATION
243.94
MALES / 100 FEMALES
40.99
FEMALES / 100 MALES
19.0
MEDIAN AGE
8.1
AVG FAMILY SIZE
8.1
AVG HOUSEHOLD SIZE
131
LABOR FORCE [ PEOPLE ]
82.4%
PERCENT IN LABOR FORCE
Income in Torboy
Income Overview in Torboy
| Characteristic | Number | Measure |
| Per Capita Income | 227 | $13,147 |
| Median Family Income | 28 | $0 |
| Mean Family Income | 28 | $61,600 |
| Median Household Income | 28 | $0 |
| Mean Household Income | 28 | $61,600 |
| Income Deficit | 28 | $0 |
| Wage / Income Gap (%) | 227 | 0.00% |
| Wage / Income Gap ($) | 227 | 100.00¢ per $1 |
| Gini / Inequality Index | 227 | 0.30 |
Earnings by Sex in Torboy
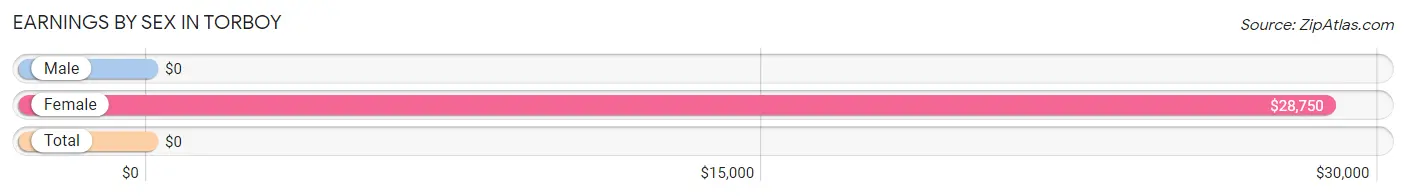
| Sex | Number | Average Earnings |
| Male | 112 (80.0%) | $0 |
| Female | 28 (20.0%) | $28,750 |
| Total | 140 (100.0%) | $0 |
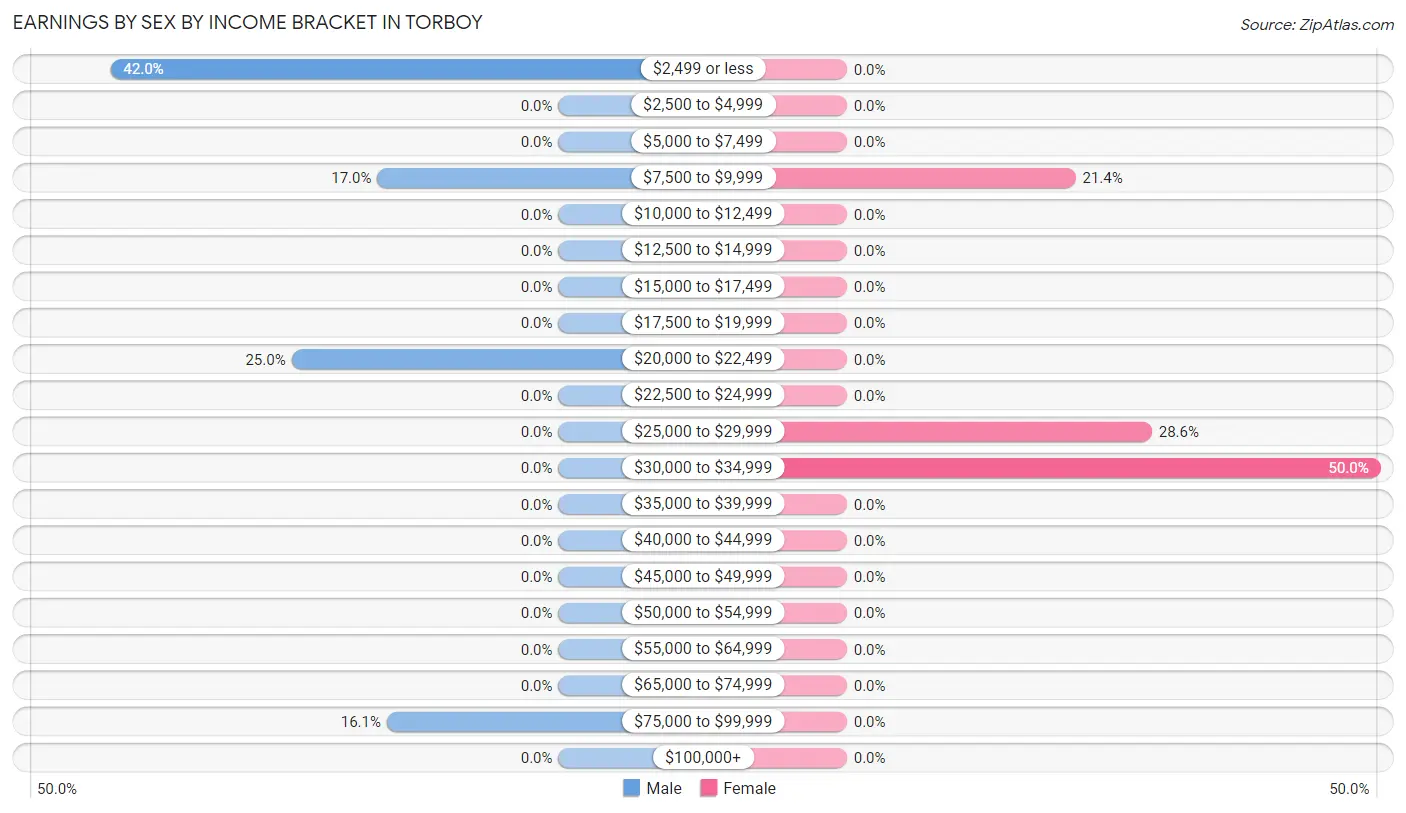
Earnings by Sex by Income Bracket in Torboy
The most common earnings brackets in Torboy are $2,499 or less for men (47 | 42.0%) and $30,000 to $34,999 for women (14 | 50.0%).
| Income | Male | Female |
| $2,499 or less | 47 (42.0%) | 0 (0.0%) |
| $2,500 to $4,999 | 0 (0.0%) | 0 (0.0%) |
| $5,000 to $7,499 | 0 (0.0%) | 0 (0.0%) |
| $7,500 to $9,999 | 19 (17.0%) | 6 (21.4%) |
| $10,000 to $12,499 | 0 (0.0%) | 0 (0.0%) |
| $12,500 to $14,999 | 0 (0.0%) | 0 (0.0%) |
| $15,000 to $17,499 | 0 (0.0%) | 0 (0.0%) |
| $17,500 to $19,999 | 0 (0.0%) | 0 (0.0%) |
| $20,000 to $22,499 | 28 (25.0%) | 0 (0.0%) |
| $22,500 to $24,999 | 0 (0.0%) | 0 (0.0%) |
| $25,000 to $29,999 | 0 (0.0%) | 8 (28.6%) |
| $30,000 to $34,999 | 0 (0.0%) | 14 (50.0%) |
| $35,000 to $39,999 | 0 (0.0%) | 0 (0.0%) |
| $40,000 to $44,999 | 0 (0.0%) | 0 (0.0%) |
| $45,000 to $49,999 | 0 (0.0%) | 0 (0.0%) |
| $50,000 to $54,999 | 0 (0.0%) | 0 (0.0%) |
| $55,000 to $64,999 | 0 (0.0%) | 0 (0.0%) |
| $65,000 to $74,999 | 0 (0.0%) | 0 (0.0%) |
| $75,000 to $99,999 | 18 (16.1%) | 0 (0.0%) |
| $100,000+ | 0 (0.0%) | 0 (0.0%) |
| Total | 112 (100.0%) | 28 (100.0%) |
Earnings by Sex by Educational Attainment in Torboy
| Educational Attainment | Male Income | Female Income |
| Less than High School | - | - |
| High School Diploma | - | - |
| College or Associate's Degree | - | - |
| Bachelor's Degree | - | - |
| Graduate Degree | - | - |
| Total | - | - |
Family Income in Torboy
Family Income Brackets in Torboy
According to the Torboy family income data, there are 14 families falling into the $50,000 to $74,999 income range, which is the most common income bracket and makes up 50.0% of all families.
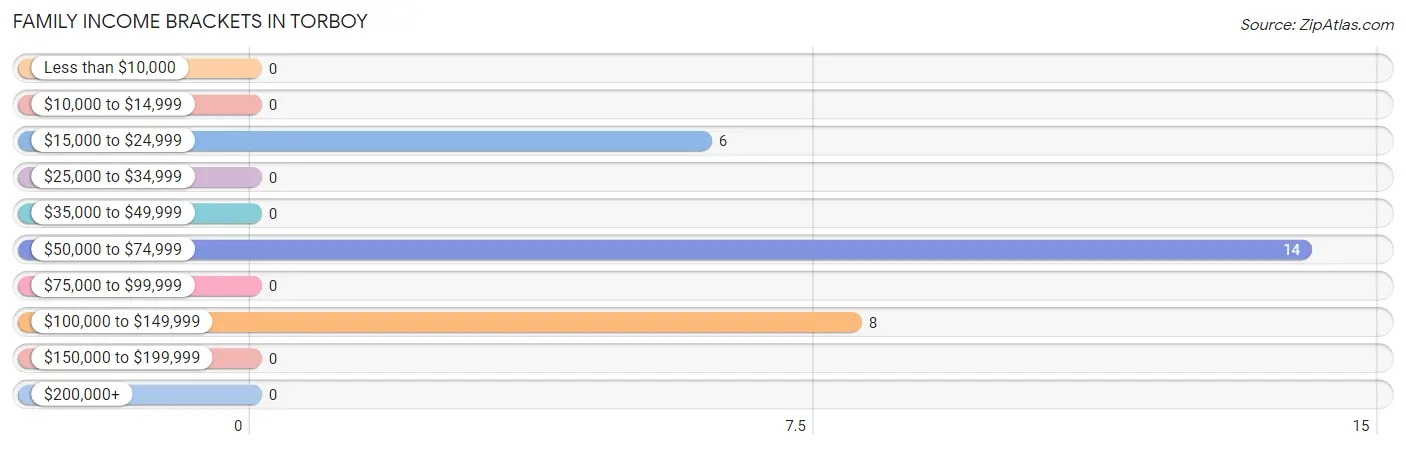
| Income Bracket | # Families | % Families |
| Less than $10,000 | 0 | 0.0% |
| $10,000 to $14,999 | 0 | 0.0% |
| $15,000 to $24,999 | 6 | 21.4% |
| $25,000 to $34,999 | 0 | 0.0% |
| $35,000 to $49,999 | 0 | 0.0% |
| $50,000 to $74,999 | 14 | 50.0% |
| $75,000 to $99,999 | 0 | 0.0% |
| $100,000 to $149,999 | 8 | 28.6% |
| $150,000 to $199,999 | 0 | 0.0% |
| $200,000+ | 0 | 0.0% |
Family Income by Famaliy Size in Torboy
| Income Bracket | # Families | Median Income |
| 2-Person Families | 6 (21.4%) | $0 |
| 3-Person Families | 0 (0.0%) | $0 |
| 4-Person Families | 8 (28.6%) | $0 |
| 5-Person Families | 0 (0.0%) | $0 |
| 6-Person Families | 14 (50.0%) | $0 |
| 7+ Person Families | 0 (0.0%) | $0 |
| Total | 28 (100.0%) | $0 |
Family Income by Number of Earners in Torboy
| Number of Earners | # Families | Median Income |
| No Earners | 0 (0.0%) | $0 |
| 1 Earner | 0 (0.0%) | $0 |
| 2 Earners | 20 (71.4%) | $0 |
| 3+ Earners | 8 (28.6%) | $0 |
| Total | 28 (100.0%) | $0 |
Household Income in Torboy
Household Income Brackets in Torboy
With 14 households falling in the category, the $50,000 to $74,999 income range is the most frequent in Torboy, accounting for 50.0% of all households.
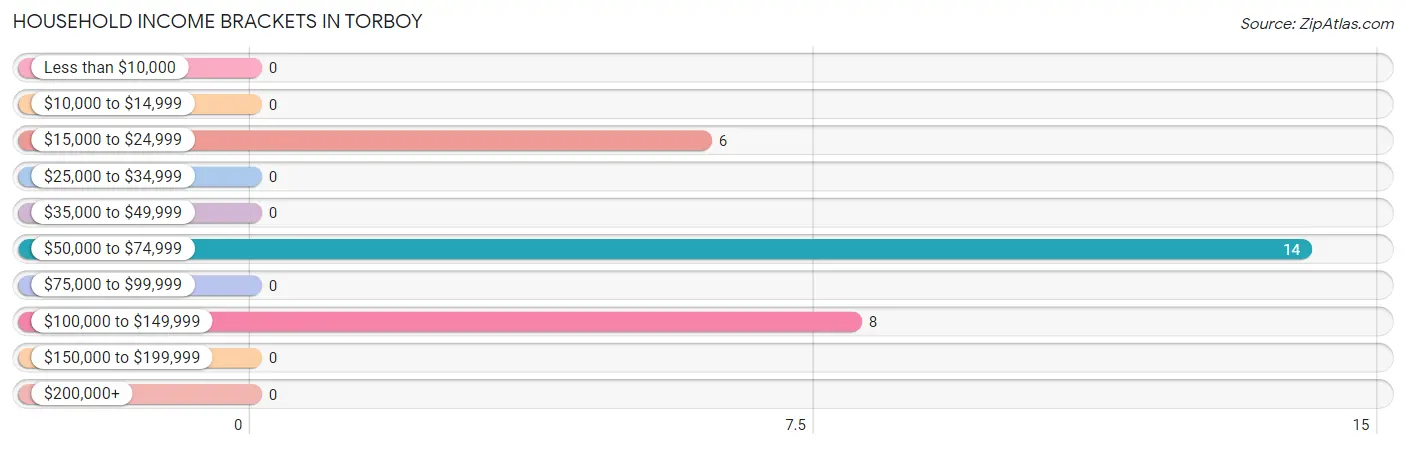
| Income Bracket | # Households | % Households |
| Less than $10,000 | 0 | 0.0% |
| $10,000 to $14,999 | 0 | 0.0% |
| $15,000 to $24,999 | 6 | 21.4% |
| $25,000 to $34,999 | 0 | 0.0% |
| $35,000 to $49,999 | 0 | 0.0% |
| $50,000 to $74,999 | 14 | 50.0% |
| $75,000 to $99,999 | 0 | 0.0% |
| $100,000 to $149,999 | 8 | 28.6% |
| $150,000 to $199,999 | 0 | 0.0% |
| $200,000+ | 0 | 0.0% |
Household Income by Householder Age in Torboy
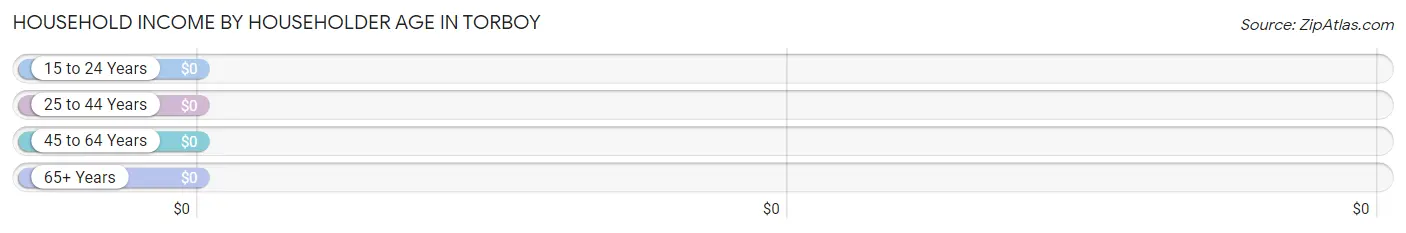
| Income Bracket | # Households | Median Income |
| 15 to 24 Years | 0 (0.0%) | $0 |
| 25 to 44 Years | 8 (28.6%) | $0 |
| 45 to 64 Years | 20 (71.4%) | $0 |
| 65+ Years | 0 (0.0%) | $0 |
| Total | 28 (100.0%) | $0 |
Poverty in Torboy
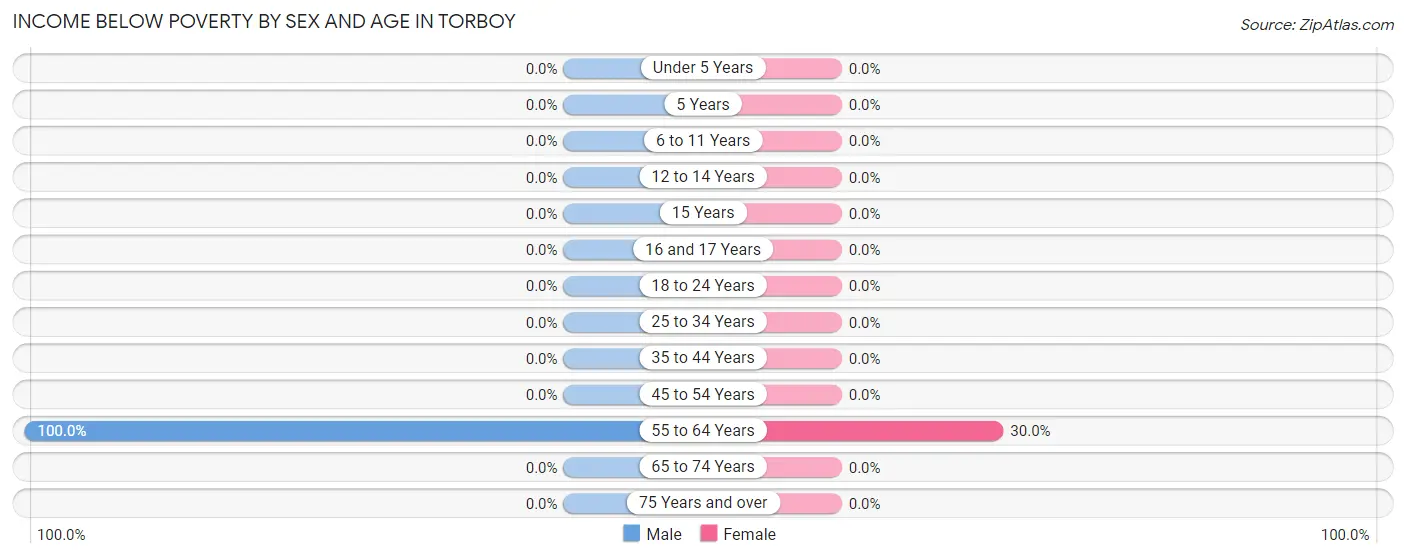
Income Below Poverty by Sex and Age in Torboy
With 11.8% poverty level for males and 9.1% for females among the residents of Torboy, 55 to 64 year old males and 55 to 64 year old females are the most vulnerable to poverty, with 19 males (100.0%) and 6 females (30.0%) in their respective age groups living below the poverty level.
| Age Bracket | Male | Female |
| Under 5 Years | 0 (0.0%) | 0 (0.0%) |
| 5 Years | 0 (0.0%) | 0 (0.0%) |
| 6 to 11 Years | 0 (0.0%) | 0 (0.0%) |
| 12 to 14 Years | 0 (0.0%) | 0 (0.0%) |
| 15 Years | 0 (0.0%) | 0 (0.0%) |
| 16 and 17 Years | 0 (0.0%) | 0 (0.0%) |
| 18 to 24 Years | 0 (0.0%) | 0 (0.0%) |
| 25 to 34 Years | 0 (0.0%) | 0 (0.0%) |
| 35 to 44 Years | 0 (0.0%) | 0 (0.0%) |
| 45 to 54 Years | 0 (0.0%) | 0 (0.0%) |
| 55 to 64 Years | 19 (100.0%) | 6 (30.0%) |
| 65 to 74 Years | 0 (0.0%) | 0 (0.0%) |
| 75 Years and over | 0 (0.0%) | 0 (0.0%) |
| Total | 19 (11.8%) | 6 (9.1%) |
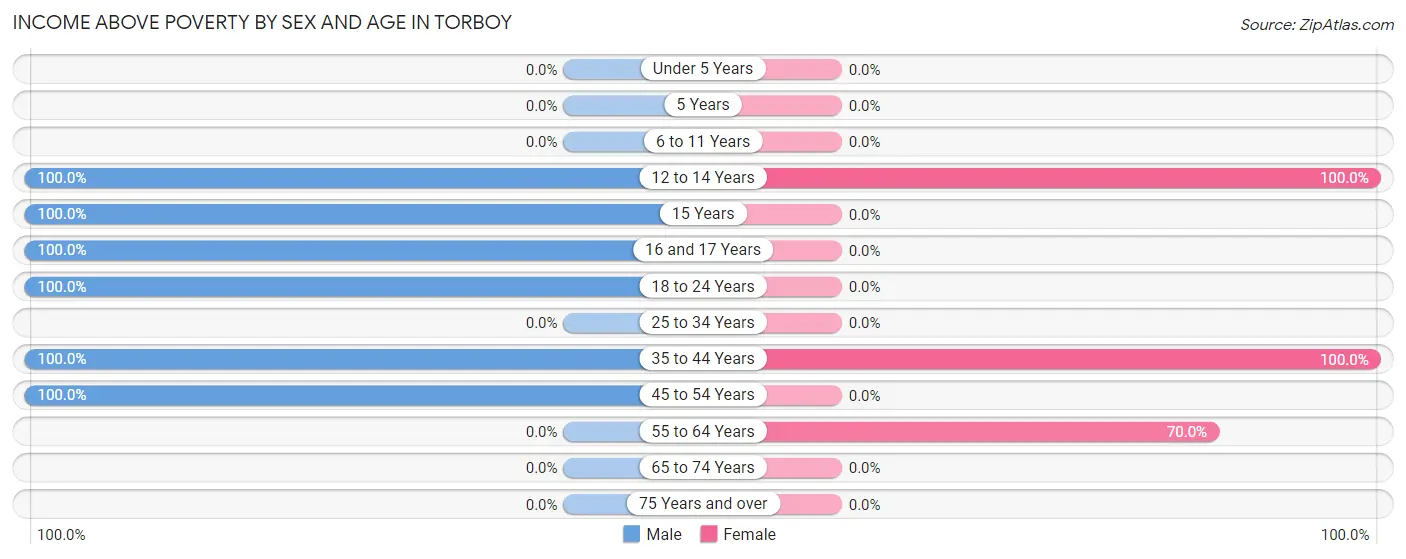
Income Above Poverty by Sex and Age in Torboy
According to the poverty statistics in Torboy, males aged 12 to 14 years and females aged 12 to 14 years are the age groups that are most secure financially, with 100.0% of males and 100.0% of females in these age groups living above the poverty line.
| Age Bracket | Male | Female |
| Under 5 Years | 0 (0.0%) | 0 (0.0%) |
| 5 Years | 0 (0.0%) | 0 (0.0%) |
| 6 to 11 Years | 0 (0.0%) | 0 (0.0%) |
| 12 to 14 Years | 19 (100.0%) | 19 (100.0%) |
| 15 Years | 30 (100.0%) | 0 (0.0%) |
| 16 and 17 Years | 9 (100.0%) | 0 (0.0%) |
| 18 to 24 Years | 38 (100.0%) | 0 (0.0%) |
| 25 to 34 Years | 0 (0.0%) | 0 (0.0%) |
| 35 to 44 Years | 28 (100.0%) | 27 (100.0%) |
| 45 to 54 Years | 18 (100.0%) | 0 (0.0%) |
| 55 to 64 Years | 0 (0.0%) | 14 (70.0%) |
| 65 to 74 Years | 0 (0.0%) | 0 (0.0%) |
| 75 Years and over | 0 (0.0%) | 0 (0.0%) |
| Total | 142 (88.2%) | 60 (90.9%) |
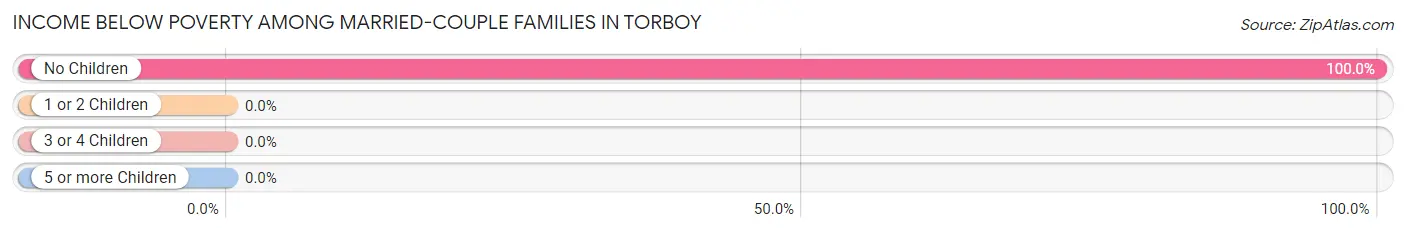
Income Below Poverty Among Married-Couple Families in Torboy
The poverty statistics for married-couple families in Torboy show that 42.9% or 6 of the total 14 families live below the poverty line. Families with no children have the highest poverty rate of 100.0%, comprising of 6 families. On the other hand, families with 1 or 2 children have the lowest poverty rate of 0.0%, which includes 0 families.
| Children | Above Poverty | Below Poverty |
| No Children | 0 (0.0%) | 6 (100.0%) |
| 1 or 2 Children | 8 (100.0%) | 0 (0.0%) |
| 3 or 4 Children | 0 (0.0%) | 0 (0.0%) |
| 5 or more Children | 0 (0.0%) | 0 (0.0%) |
| Total | 8 (57.1%) | 6 (42.9%) |
Income Below Poverty Among Single-Parent Households in Torboy
| Children | Single Father | Single Mother |
| No Children | 0 (0.0%) | 0 (0.0%) |
| 1 or 2 Children | 0 (0.0%) | 0 (0.0%) |
| 3 or 4 Children | 0 (0.0%) | 0 (0.0%) |
| 5 or more Children | 0 (0.0%) | 0 (0.0%) |
| Total | 0 (0.0%) | 0 (0.0%) |
Income Below Poverty Among Married-Couple vs Single-Parent Households in Torboy
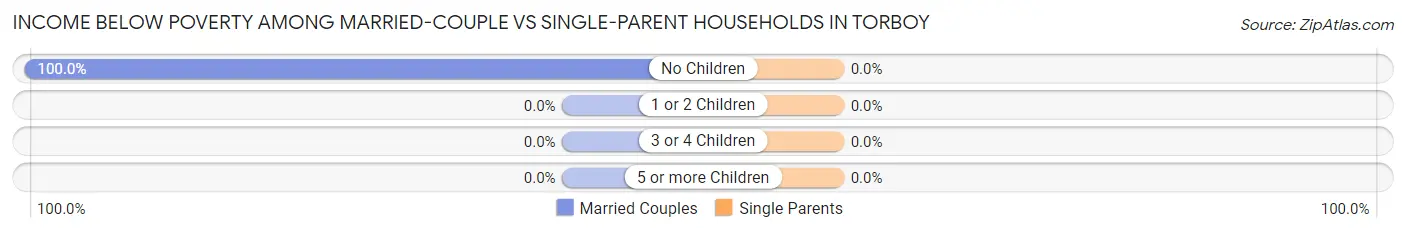
| Children | Married-Couple Families | Single-Parent Households |
| No Children | 6 (100.0%) | 0 (0.0%) |
| 1 or 2 Children | 0 (0.0%) | 0 (0.0%) |
| 3 or 4 Children | 0 (0.0%) | 0 (0.0%) |
| 5 or more Children | 0 (0.0%) | 0 (0.0%) |
| Total | 6 (42.9%) | 0 (0.0%) |
Race in Torboy
The most populous races in Torboy are Two or more Races (109 | 48.0%), White / Caucasian (91 | 40.1%), and Native / Alaskan (27 | 11.9%).
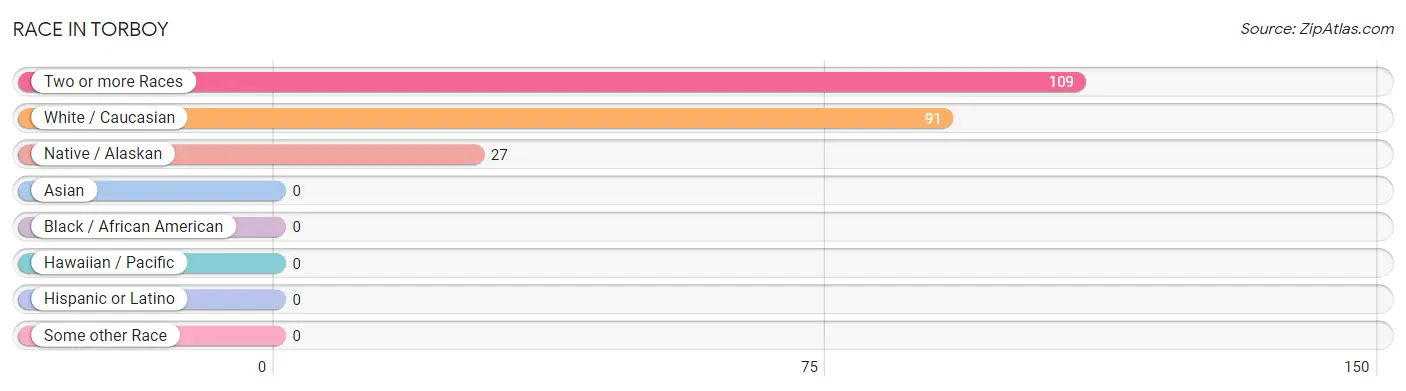
| Race | # Population | % Population |
| Asian | 0 | 0.0% |
| Black / African American | 0 | 0.0% |
| Hawaiian / Pacific | 0 | 0.0% |
| Hispanic or Latino | 0 | 0.0% |
| Native / Alaskan | 27 | 11.9% |
| White / Caucasian | 91 | 40.1% |
| Two or more Races | 109 | 48.0% |
| Some other Race | 0 | 0.0% |
| Total | 227 | 100.0% |
Ancestry in Torboy
The most populous ancestries reported in Torboy are Bhutanese (71 | 31.3%), Blackfeet (38 | 16.7%), and Colville (27 | 11.9%), together accounting for 59.9% of all Torboy residents.
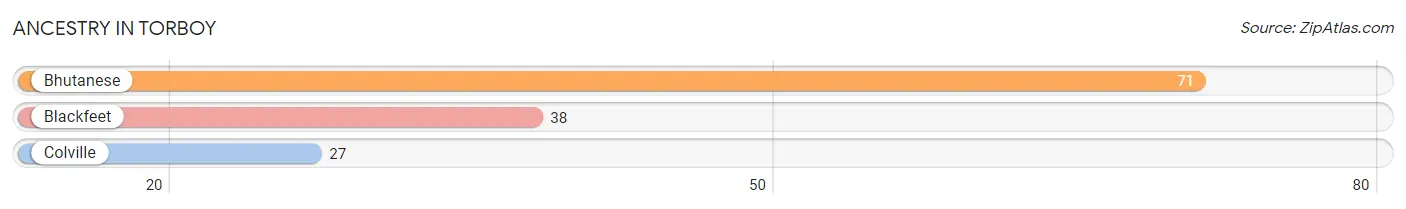
| Ancestry | # Population | % Population |
| Bhutanese | 71 | 31.3% |
| Blackfeet | 38 | 16.7% |
| Colville | 27 | 11.9% | View All 3 Rows |
Immigrants in Torboy

| Immigration Origin | # Population | % Population | View All 0 Rows |
Sex and Age in Torboy
Sex and Age in Torboy
The most populous age groups in Torboy are 15 to 19 Years (77 | 47.8%) for men and 55 to 59 Years (20 | 30.3%) for women.
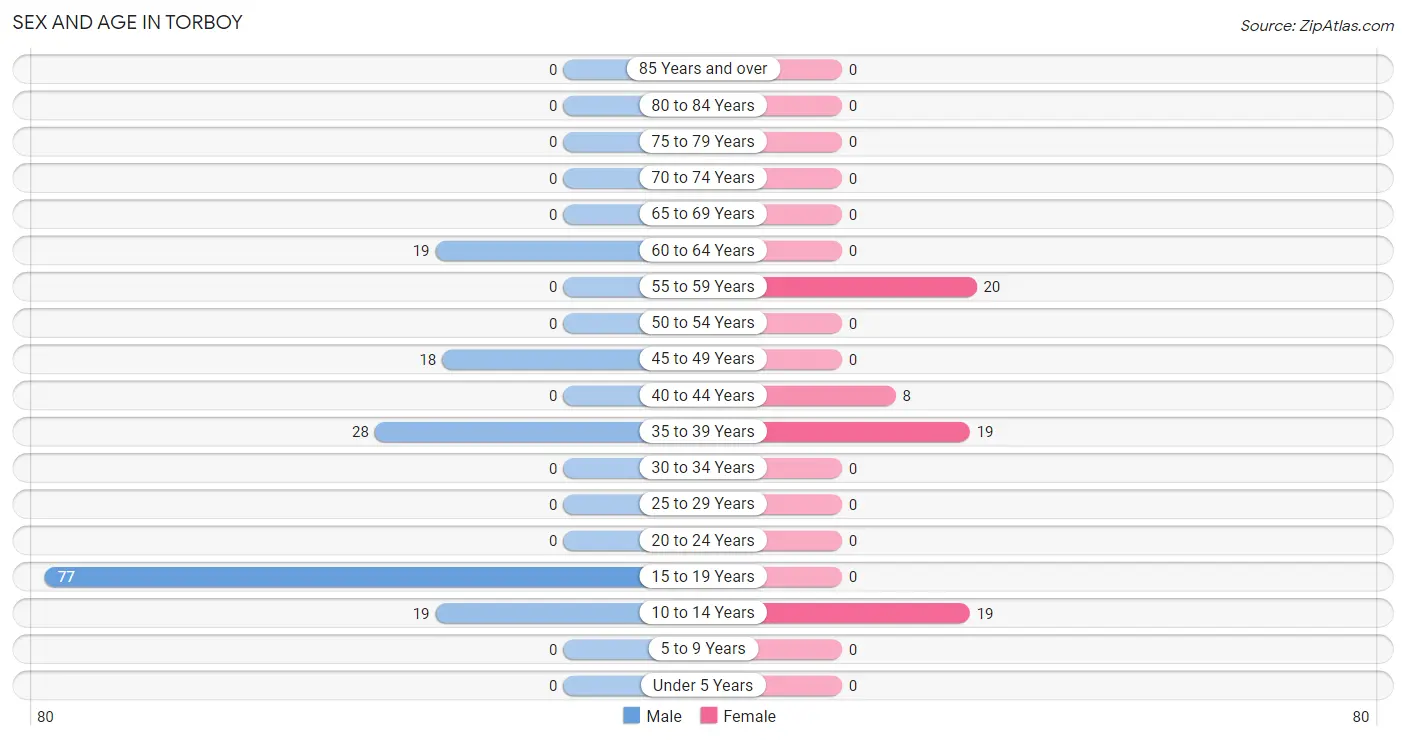
| Age Bracket | Male | Female |
| Under 5 Years | 0 (0.0%) | 0 (0.0%) |
| 5 to 9 Years | 0 (0.0%) | 0 (0.0%) |
| 10 to 14 Years | 19 (11.8%) | 19 (28.8%) |
| 15 to 19 Years | 77 (47.8%) | 0 (0.0%) |
| 20 to 24 Years | 0 (0.0%) | 0 (0.0%) |
| 25 to 29 Years | 0 (0.0%) | 0 (0.0%) |
| 30 to 34 Years | 0 (0.0%) | 0 (0.0%) |
| 35 to 39 Years | 28 (17.4%) | 19 (28.8%) |
| 40 to 44 Years | 0 (0.0%) | 8 (12.1%) |
| 45 to 49 Years | 18 (11.2%) | 0 (0.0%) |
| 50 to 54 Years | 0 (0.0%) | 0 (0.0%) |
| 55 to 59 Years | 0 (0.0%) | 20 (30.3%) |
| 60 to 64 Years | 19 (11.8%) | 0 (0.0%) |
| 65 to 69 Years | 0 (0.0%) | 0 (0.0%) |
| 70 to 74 Years | 0 (0.0%) | 0 (0.0%) |
| 75 to 79 Years | 0 (0.0%) | 0 (0.0%) |
| 80 to 84 Years | 0 (0.0%) | 0 (0.0%) |
| 85 Years and over | 0 (0.0%) | 0 (0.0%) |
| Total | 161 (100.0%) | 66 (100.0%) |
Families and Households in Torboy
Median Family Size in Torboy
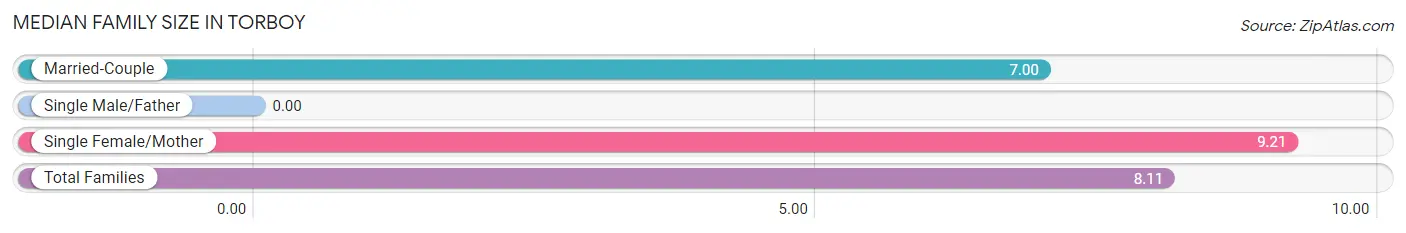
| Family Type | # Families | Family Size |
| Married-Couple | 14 (50.0%) | 7.00 |
| Single Male/Father | 0 (0.0%) | - |
| Single Female/Mother | 14 (50.0%) | 9.21 |
| Total Families | 28 (100.0%) | 8.11 |
Median Household Size in Torboy
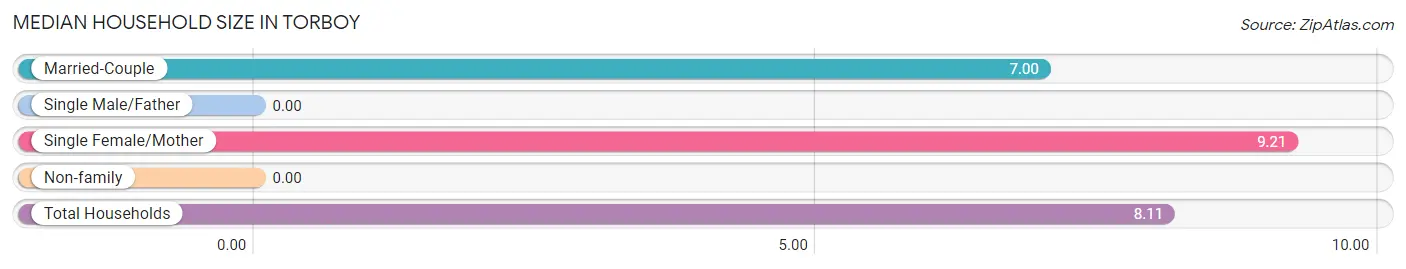
| Household Type | # Households | Household Size |
| Married-Couple | 14 (50.0%) | 7.00 |
| Single Male/Father | 0 (0.0%) | - |
| Single Female/Mother | 14 (50.0%) | 9.21 |
| Non-family | 0 (0.0%) | - |
| Total Households | 28 (100.0%) | 8.11 |
Household Size by Marriage Status in Torboy
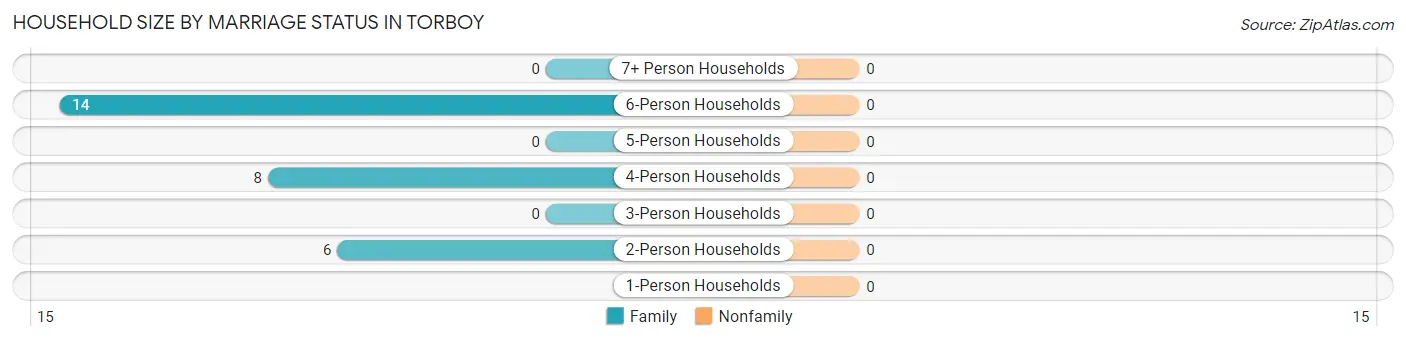
| Household Size | Family Households | Nonfamily Households |
| 1-Person Households | - | 0 (0.0%) |
| 2-Person Households | 6 (21.4%) | 0 (0.0%) |
| 3-Person Households | 0 (0.0%) | 0 (0.0%) |
| 4-Person Households | 8 (28.6%) | 0 (0.0%) |
| 5-Person Households | 0 (0.0%) | 0 (0.0%) |
| 6-Person Households | 14 (50.0%) | 0 (0.0%) |
| 7+ Person Households | 0 (0.0%) | 0 (0.0%) |
| Total | 28 (100.0%) | 0 (0.0%) |
Female Fertility in Torboy
Fertility by Age in Torboy
| Age Bracket | Women with Births | Births / 1,000 Women |
| 15 to 19 years | 0 (0.0%) | 0.0 |
| 20 to 34 years | 0 (0.0%) | 0.0 |
| 35 to 50 years | 0 (0.0%) | 0.0 |
| Total | 0 (0.0%) | 0.0 |
Fertility by Age by Marriage Status in Torboy
| Age Bracket | Married | Unmarried |
| 15 to 19 years | 0 (0.0%) | 0 (0.0%) |
| 20 to 34 years | 0 (0.0%) | 0 (0.0%) |
| 35 to 50 years | 0 (0.0%) | 0 (0.0%) |
| Total | 0 (0.0%) | 0 (0.0%) |
Fertility by Education in Torboy
| Educational Attainment | Women with Births | Births / 1,000 Women |
| Less than High School | 0 (0.0%) | 0.0 |
| High School Diploma | 0 (0.0%) | 0.0 |
| College or Associate's Degree | 0 (0.0%) | 0.0 |
| Bachelor's Degree | 0 (0.0%) | 0.0 |
| Graduate Degree | 0 (0.0%) | 0.0 |
| Total | 0 (0.0%) | 0.0 |
Fertility by Education by Marriage Status in Torboy
| Educational Attainment | Married | Unmarried |
| Less than High School | 0 (0.0%) | 0 (0.0%) |
| High School Diploma | 0 (0.0%) | 0 (0.0%) |
| College or Associate's Degree | 0 (0.0%) | 0 (0.0%) |
| Bachelor's Degree | 0 (0.0%) | 0 (0.0%) |
| Graduate Degree | 0 (0.0%) | 0 (0.0%) |
| Total | 0 (0.0%) | 0 (0.0%) |
Employment Characteristics in Torboy
Employment by Class of Employer in Torboy
Among the 131 employed individuals in Torboy, private company employees (42 | 32.1%), self-employed (not incorporated) (38 | 29.0%), and self-employed (incorporated) (25 | 19.1%) make up the most common classes of employment.
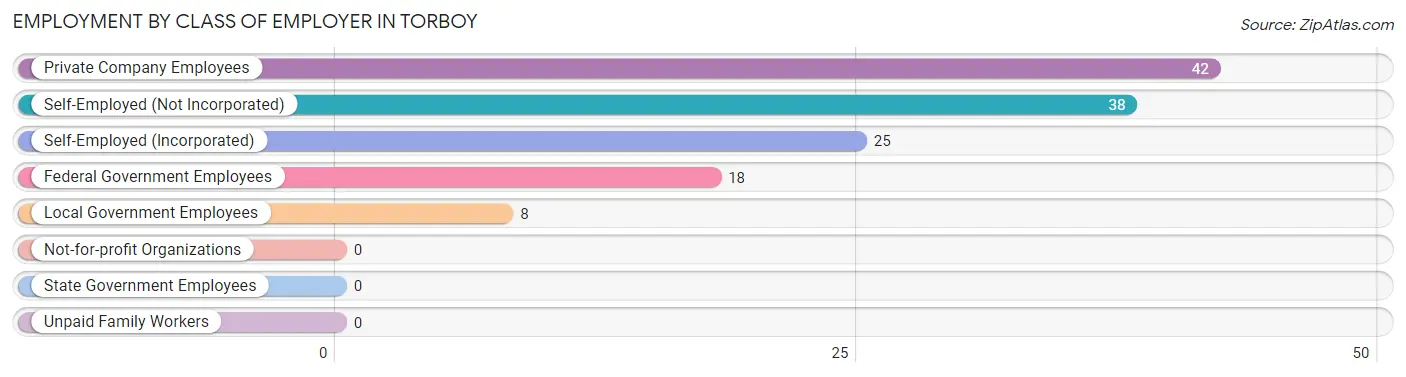
| Employer Class | # Employees | % Employees |
| Private Company Employees | 42 | 32.1% |
| Self-Employed (Incorporated) | 25 | 19.1% |
| Self-Employed (Not Incorporated) | 38 | 29.0% |
| Not-for-profit Organizations | 0 | 0.0% |
| Local Government Employees | 8 | 6.1% |
| State Government Employees | 0 | 0.0% |
| Federal Government Employees | 18 | 13.7% |
| Unpaid Family Workers | 0 | 0.0% |
| Total | 131 | 100.0% |
Employment Status by Age in Torboy
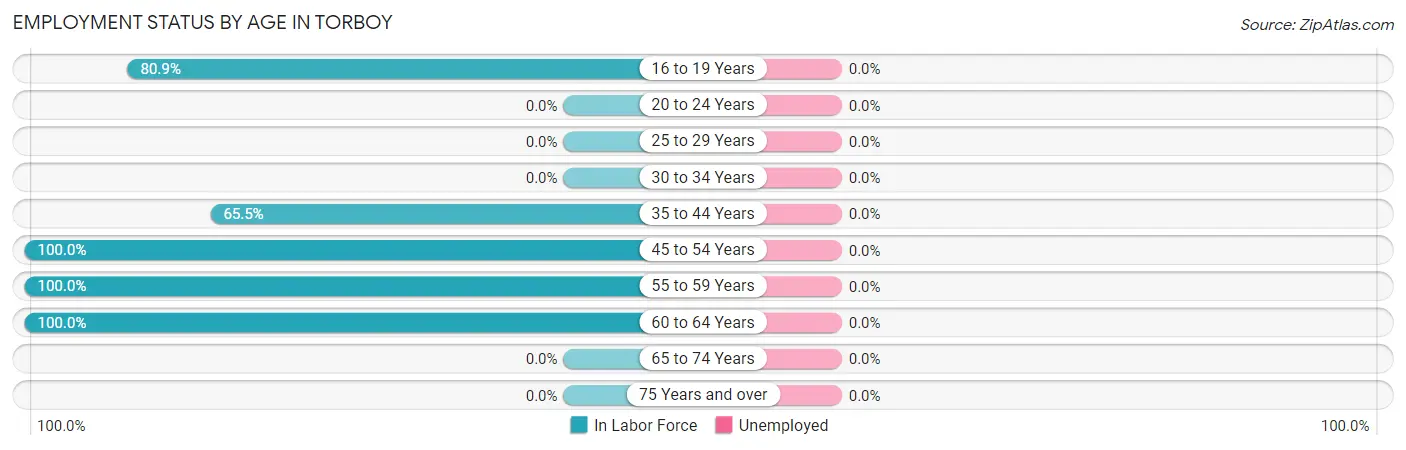
| Age Bracket | In Labor Force | Unemployed |
| 16 to 19 Years | 38 (80.9%) | 0 (0.0%) |
| 20 to 24 Years | 0 (0.0%) | 0 (0.0%) |
| 25 to 29 Years | 0 (0.0%) | 0 (0.0%) |
| 30 to 34 Years | 0 (0.0%) | 0 (0.0%) |
| 35 to 44 Years | 36 (65.5%) | 0 (0.0%) |
| 45 to 54 Years | 18 (100.0%) | 0 (0.0%) |
| 55 to 59 Years | 20 (100.0%) | 0 (0.0%) |
| 60 to 64 Years | 19 (100.0%) | 0 (0.0%) |
| 65 to 74 Years | 0 (0.0%) | 0 (0.0%) |
| 75 Years and over | 0 (0.0%) | 0 (0.0%) |
| Total | 131 (82.4%) | 0 (0.0%) |
Employment Status by Educational Attainment in Torboy
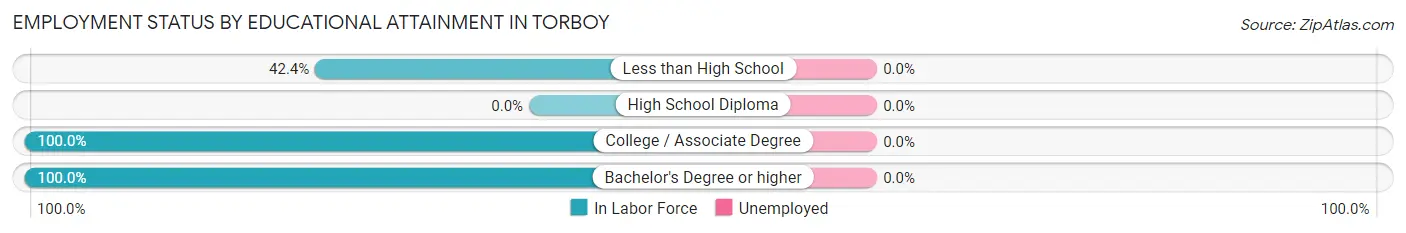
| Educational Attainment | In Labor Force | Unemployed |
| Less than High School | 14 (42.4%) | 0 (0.0%) |
| High School Diploma | 0 (0.0%) | 0 (0.0%) |
| College / Associate Degree | 55 (100.0%) | 0 (0.0%) |
| Bachelor's Degree or higher | 24 (100.0%) | 0 (0.0%) |
| Total | 93 (83.0%) | 0 (0.0%) |
Employment Occupations by Sex in Torboy
Management, Business, Science and Arts Occupations
The most common Management, Business, Science and Arts occupations in Torboy are , and Management (25 | 19.1%).
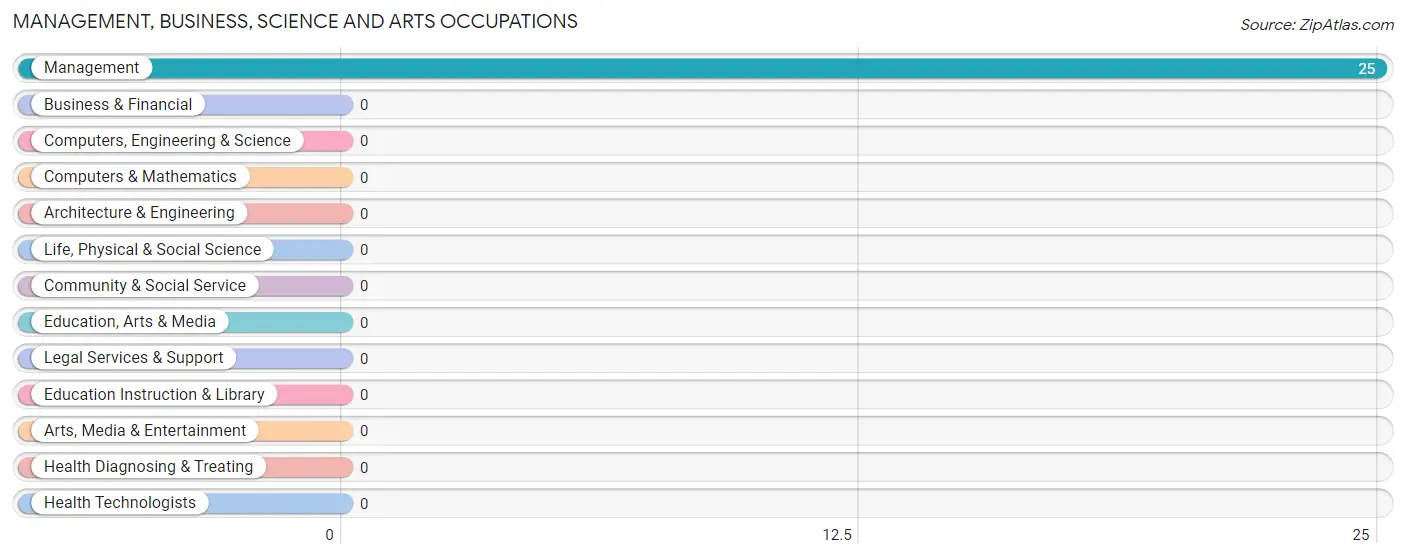
Management, Business, Science and Arts Occupations by Sex
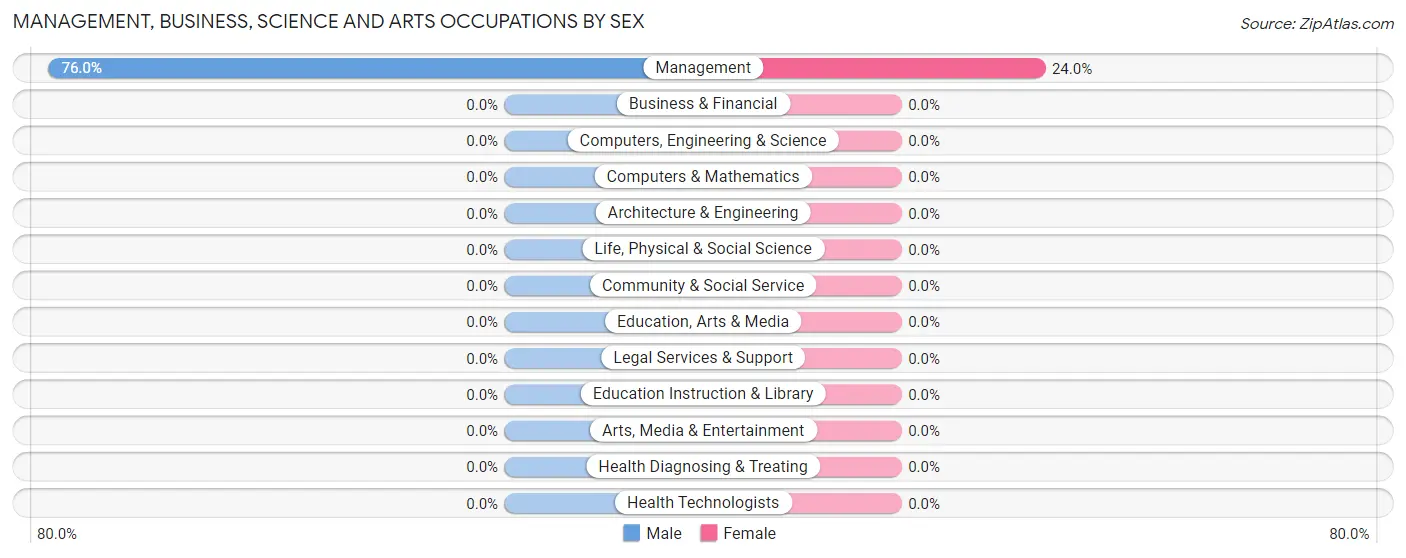
| Occupation | Male | Female |
| Management | 19 (76.0%) | 6 (24.0%) |
| Business & Financial | 0 (0.0%) | 0 (0.0%) |
| Computers, Engineering & Science | 0 (0.0%) | 0 (0.0%) |
| Computers & Mathematics | 0 (0.0%) | 0 (0.0%) |
| Architecture & Engineering | 0 (0.0%) | 0 (0.0%) |
| Life, Physical & Social Science | 0 (0.0%) | 0 (0.0%) |
| Community & Social Service | 0 (0.0%) | 0 (0.0%) |
| Education, Arts & Media | 0 (0.0%) | 0 (0.0%) |
| Legal Services & Support | 0 (0.0%) | 0 (0.0%) |
| Education Instruction & Library | 0 (0.0%) | 0 (0.0%) |
| Arts, Media & Entertainment | 0 (0.0%) | 0 (0.0%) |
| Health Diagnosing & Treating | 0 (0.0%) | 0 (0.0%) |
| Health Technologists | 0 (0.0%) | 0 (0.0%) |
| Total (Category) | 19 (76.0%) | 6 (24.0%) |
| Total (Overall) | 103 (78.6%) | 28 (21.4%) |
Services Occupations
The most common Services occupations in Torboy are Security & Protection (18 | 13.7%), Firefighting & Prevention (18 | 13.7%), and Food Preparation & Serving (14 | 10.7%).
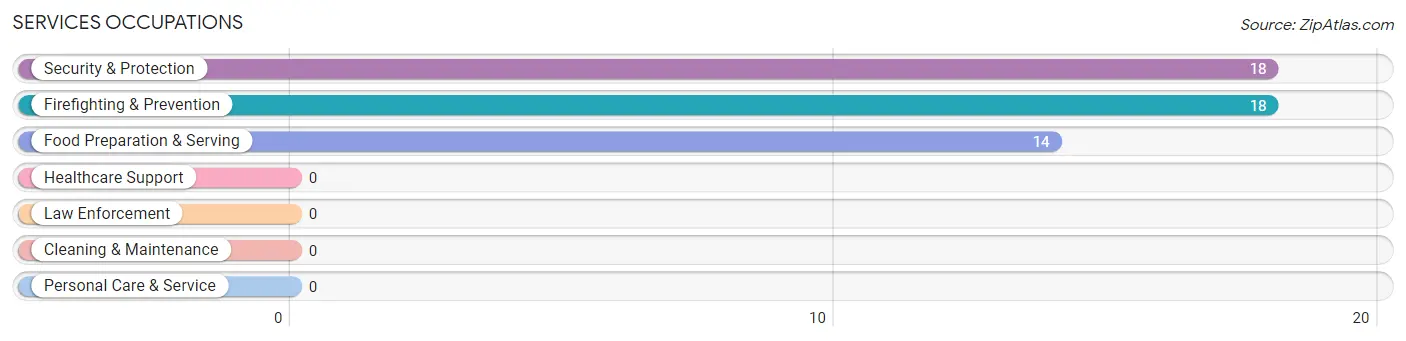
Services Occupations by Sex
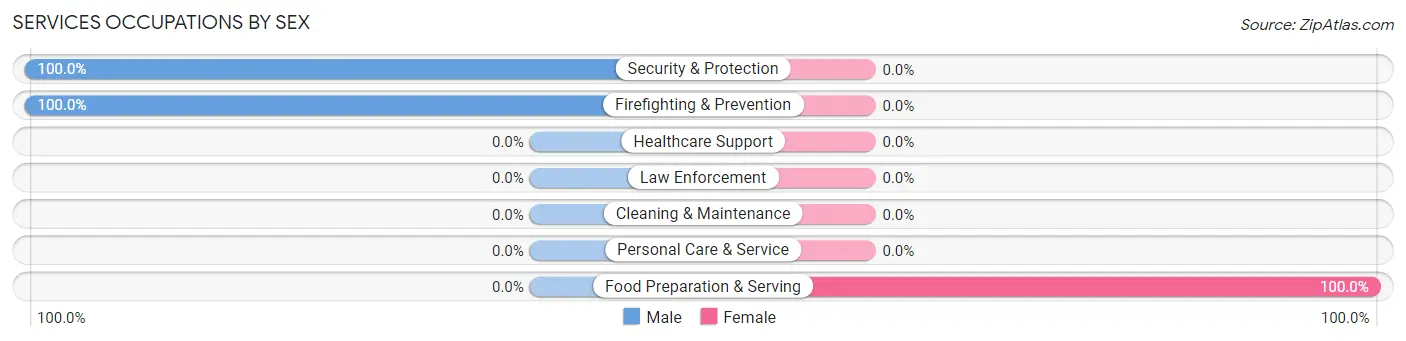
| Occupation | Male | Female |
| Healthcare Support | 0 (0.0%) | 0 (0.0%) |
| Security & Protection | 18 (100.0%) | 0 (0.0%) |
| Firefighting & Prevention | 18 (100.0%) | 0 (0.0%) |
| Law Enforcement | 0 (0.0%) | 0 (0.0%) |
| Food Preparation & Serving | 0 (0.0%) | 14 (100.0%) |
| Cleaning & Maintenance | 0 (0.0%) | 0 (0.0%) |
| Personal Care & Service | 0 (0.0%) | 0 (0.0%) |
| Total (Category) | 18 (56.2%) | 14 (43.8%) |
| Total (Overall) | 103 (78.6%) | 28 (21.4%) |
Sales and Office Occupations
The most common Sales and Office occupations in Torboy are , and Office & Administration (8 | 6.1%).
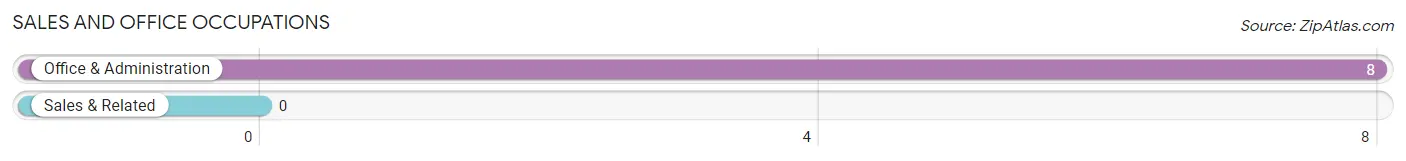
Sales and Office Occupations by Sex
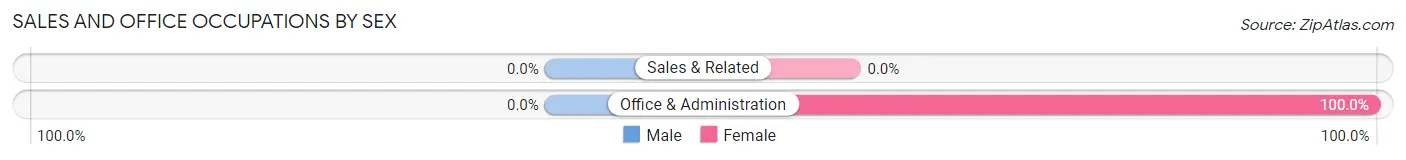
| Occupation | Male | Female |
| Sales & Related | 0 (0.0%) | 0 (0.0%) |
| Office & Administration | 0 (0.0%) | 8 (100.0%) |
| Total (Category) | 0 (0.0%) | 8 (100.0%) |
| Total (Overall) | 103 (78.6%) | 28 (21.4%) |
Natural Resources, Construction and Maintenance Occupations
The most common Natural Resources, Construction and Maintenance occupations in Torboy are , and Farming, Fishing & Forestry (38 | 29.0%).
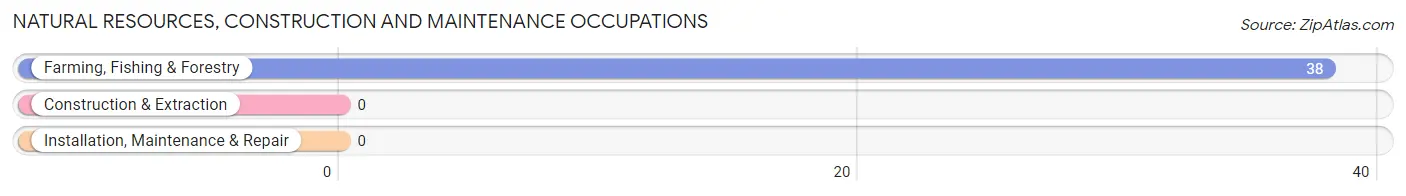
Natural Resources, Construction and Maintenance Occupations by Sex
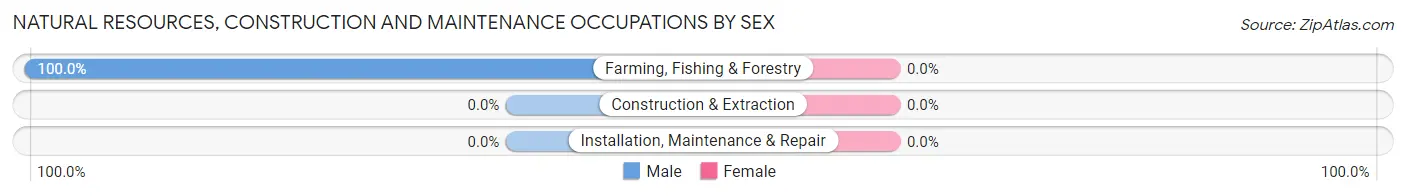
| Occupation | Male | Female |
| Farming, Fishing & Forestry | 38 (100.0%) | 0 (0.0%) |
| Construction & Extraction | 0 (0.0%) | 0 (0.0%) |
| Installation, Maintenance & Repair | 0 (0.0%) | 0 (0.0%) |
| Total (Category) | 38 (100.0%) | 0 (0.0%) |
| Total (Overall) | 103 (78.6%) | 28 (21.4%) |
Production, Transportation and Moving Occupations
The most common Production, Transportation and Moving occupations in Torboy are , and Transportation (28 | 21.4%).
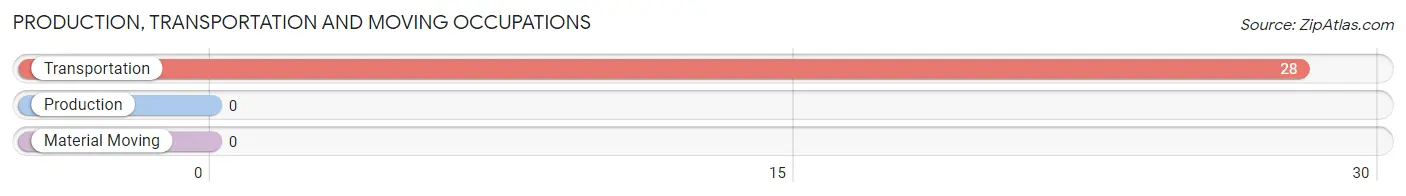
Production, Transportation and Moving Occupations by Sex
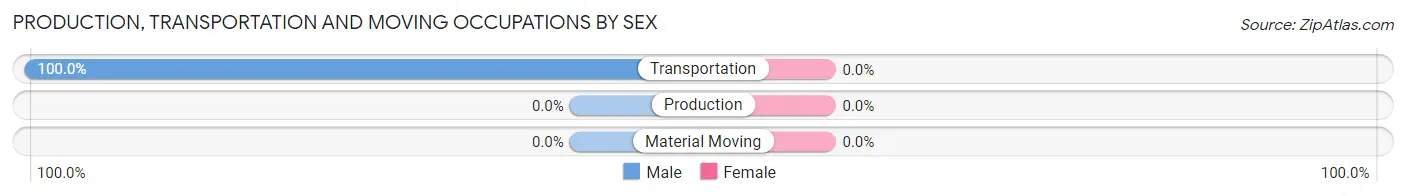
| Occupation | Male | Female |
| Production | 0 (0.0%) | 0 (0.0%) |
| Transportation | 28 (100.0%) | 0 (0.0%) |
| Material Moving | 0 (0.0%) | 0 (0.0%) |
| Total (Category) | 28 (100.0%) | 0 (0.0%) |
| Total (Overall) | 103 (78.6%) | 28 (21.4%) |
Employment Industries by Sex in Torboy
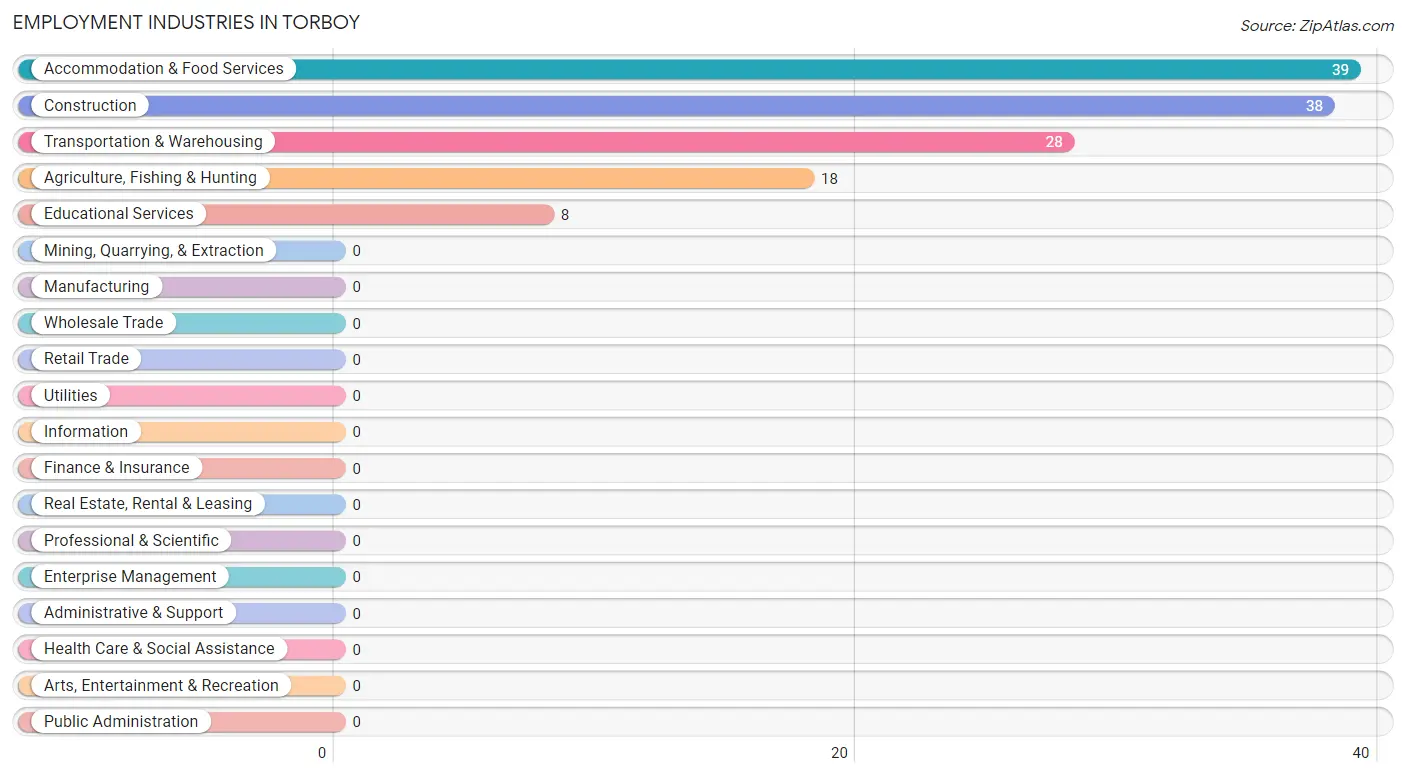
Employment Industries in Torboy
The major employment industries in Torboy include Accommodation & Food Services (39 | 29.8%), Construction (38 | 29.0%), Transportation & Warehousing (28 | 21.4%), Agriculture, Fishing & Hunting (18 | 13.7%), and Educational Services (8 | 6.1%).
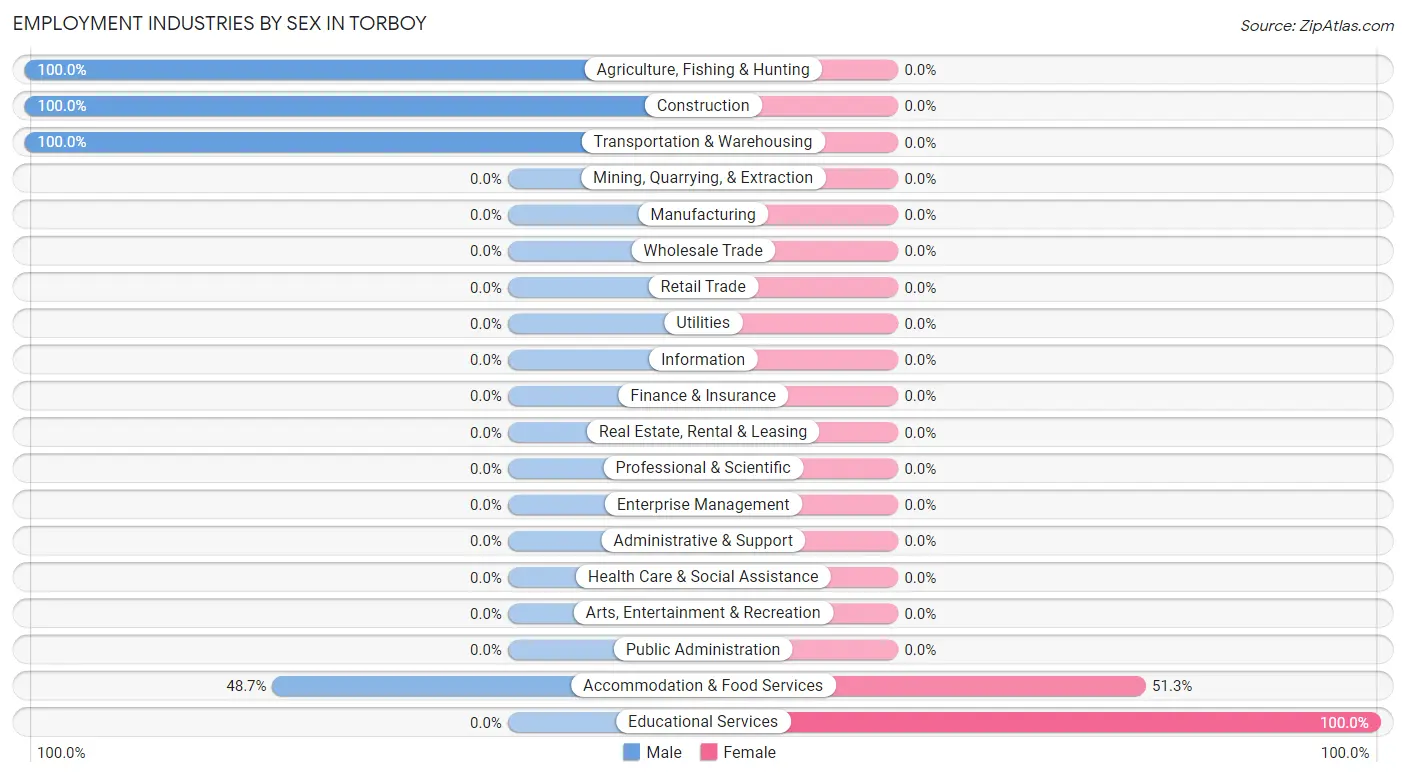
Employment Industries by Sex in Torboy
The Torboy industries that see more men than women are Agriculture, Fishing & Hunting (100.0%), Construction (100.0%), and Transportation & Warehousing (100.0%), whereas the industries that tend to have a higher number of women are Educational Services (100.0%), and Accommodation & Food Services (51.3%).
| Industry | Male | Female |
| Agriculture, Fishing & Hunting | 18 (100.0%) | 0 (0.0%) |
| Mining, Quarrying, & Extraction | 0 (0.0%) | 0 (0.0%) |
| Construction | 38 (100.0%) | 0 (0.0%) |
| Manufacturing | 0 (0.0%) | 0 (0.0%) |
| Wholesale Trade | 0 (0.0%) | 0 (0.0%) |
| Retail Trade | 0 (0.0%) | 0 (0.0%) |
| Transportation & Warehousing | 28 (100.0%) | 0 (0.0%) |
| Utilities | 0 (0.0%) | 0 (0.0%) |
| Information | 0 (0.0%) | 0 (0.0%) |
| Finance & Insurance | 0 (0.0%) | 0 (0.0%) |
| Real Estate, Rental & Leasing | 0 (0.0%) | 0 (0.0%) |
| Professional & Scientific | 0 (0.0%) | 0 (0.0%) |
| Enterprise Management | 0 (0.0%) | 0 (0.0%) |
| Administrative & Support | 0 (0.0%) | 0 (0.0%) |
| Educational Services | 0 (0.0%) | 8 (100.0%) |
| Health Care & Social Assistance | 0 (0.0%) | 0 (0.0%) |
| Arts, Entertainment & Recreation | 0 (0.0%) | 0 (0.0%) |
| Accommodation & Food Services | 19 (48.7%) | 20 (51.3%) |
| Public Administration | 0 (0.0%) | 0 (0.0%) |
| Total | 103 (78.6%) | 28 (21.4%) |
Education in Torboy
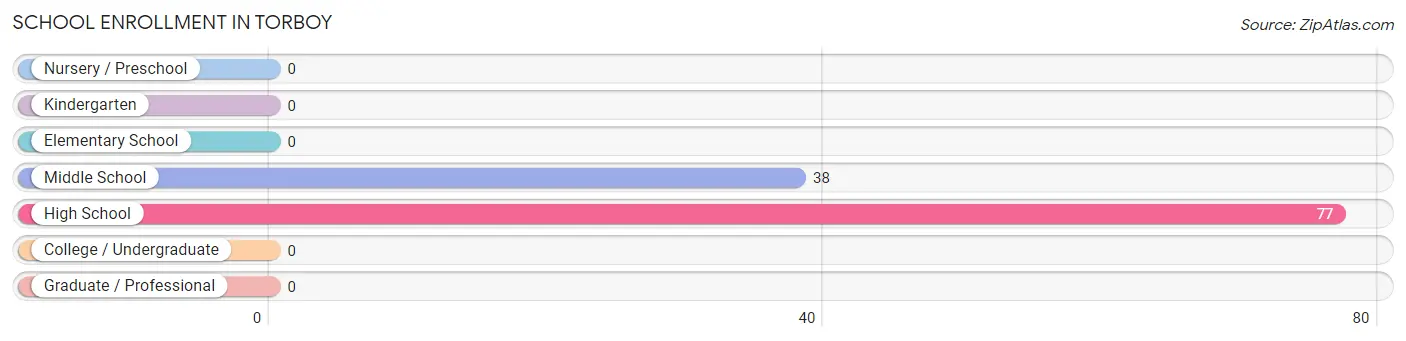
School Enrollment in Torboy
The most common levels of schooling among the 115 students in Torboy are high school (77 | 67.0%), and middle school (38 | 33.0%).
| School Level | # Students | % Students |
| Nursery / Preschool | 0 | 0.0% |
| Kindergarten | 0 | 0.0% |
| Elementary School | 0 | 0.0% |
| Middle School | 38 | 33.0% |
| High School | 77 | 67.0% |
| College / Undergraduate | 0 | 0.0% |
| Graduate / Professional | 0 | 0.0% |
| Total | 115 | 100.0% |
School Enrollment by Age by Funding Source in Torboy
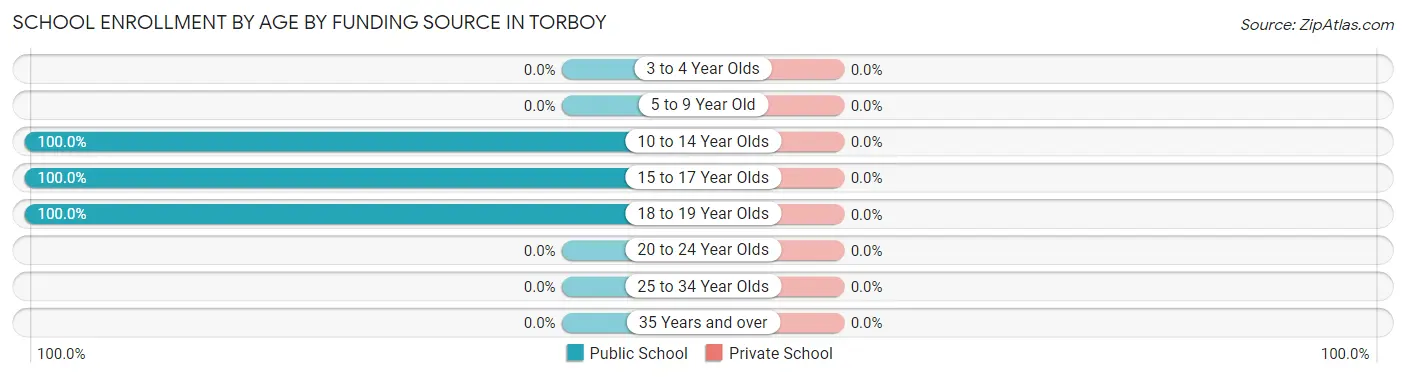
| Age Bracket | Public School | Private School |
| 3 to 4 Year Olds | 0 (0.0%) | 0 (0.0%) |
| 5 to 9 Year Old | 0 (0.0%) | 0 (0.0%) |
| 10 to 14 Year Olds | 38 (100.0%) | 0 (0.0%) |
| 15 to 17 Year Olds | 39 (100.0%) | 0 (0.0%) |
| 18 to 19 Year Olds | 38 (100.0%) | 0 (0.0%) |
| 20 to 24 Year Olds | 0 (0.0%) | 0 (0.0%) |
| 25 to 34 Year Olds | 0 (0.0%) | 0 (0.0%) |
| 35 Years and over | 0 (0.0%) | 0 (0.0%) |
| Total | 115 (100.0%) | 0 (0.0%) |
Educational Attainment by Field of Study in Torboy
Bio, nature & agricultural (18 | 75.0%), and science & technology (6 | 25.0%) are the most common fields of study among 24 individuals in Torboy who have obtained a bachelor's degree or higher.
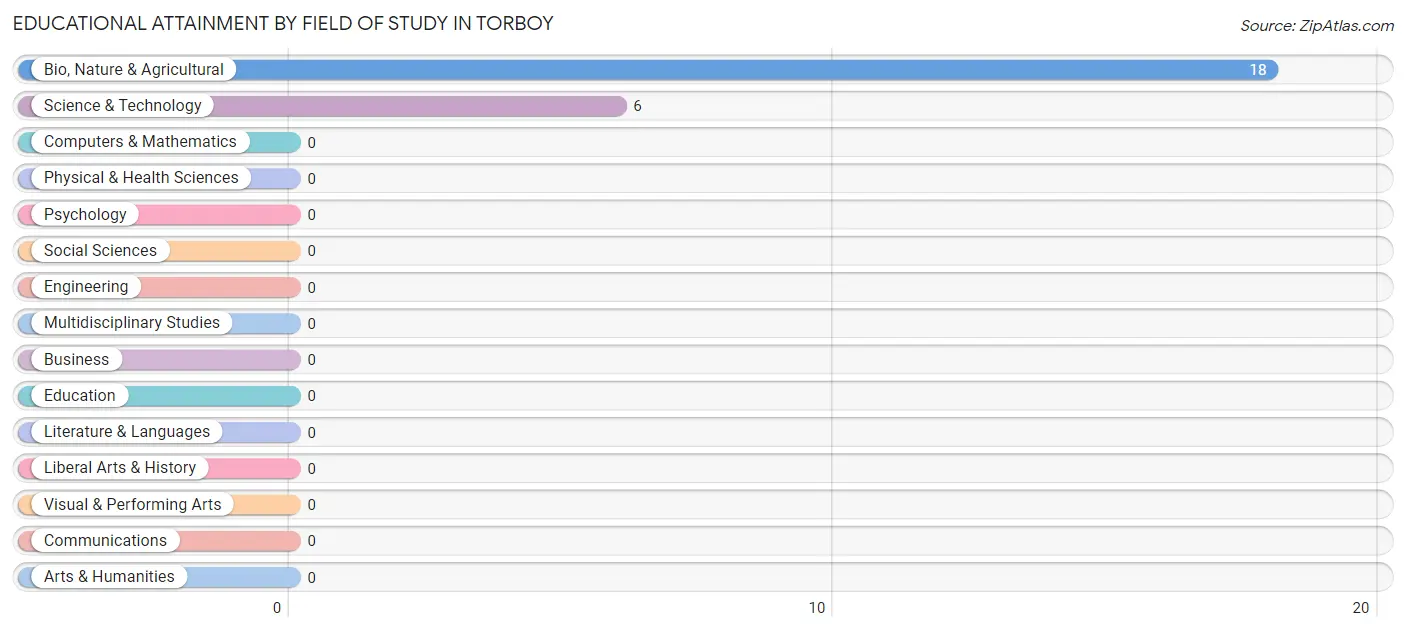
| Field of Study | # Graduates | % Graduates |
| Computers & Mathematics | 0 | 0.0% |
| Bio, Nature & Agricultural | 18 | 75.0% |
| Physical & Health Sciences | 0 | 0.0% |
| Psychology | 0 | 0.0% |
| Social Sciences | 0 | 0.0% |
| Engineering | 0 | 0.0% |
| Multidisciplinary Studies | 0 | 0.0% |
| Science & Technology | 6 | 25.0% |
| Business | 0 | 0.0% |
| Education | 0 | 0.0% |
| Literature & Languages | 0 | 0.0% |
| Liberal Arts & History | 0 | 0.0% |
| Visual & Performing Arts | 0 | 0.0% |
| Communications | 0 | 0.0% |
| Arts & Humanities | 0 | 0.0% |
| Total | 24 | 100.0% |
Transportation & Commute in Torboy
Vehicle Availability by Sex in Torboy
The most prevalent vehicle ownership categories in Torboy are males with 5 or more vehicles (56, accounting for 54.4%) and females with 5 or more vehicles (8, making up 200.0%).
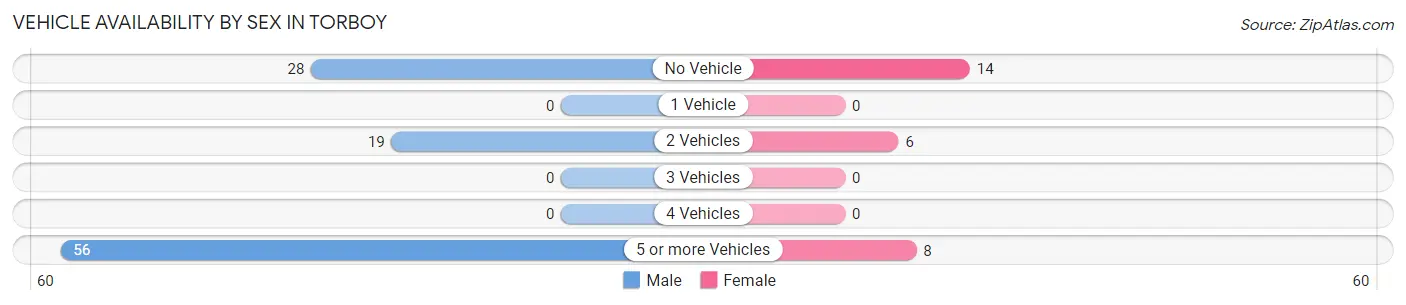
| Vehicles Available | Male | Female |
| No Vehicle | 28 (27.2%) | 14 (50.0%) |
| 1 Vehicle | 0 (0.0%) | 0 (0.0%) |
| 2 Vehicles | 19 (18.4%) | 6 (21.4%) |
| 3 Vehicles | 0 (0.0%) | 0 (0.0%) |
| 4 Vehicles | 0 (0.0%) | 0 (0.0%) |
| 5 or more Vehicles | 56 (54.4%) | 8 (28.6%) |
| Total | 103 (100.0%) | 28 (100.0%) |
Commute Time in Torboy
The most frequently occuring commute durations in Torboy are 15 to 19 minutes (92 commuters, 70.2%), 45 to 59 minutes (19 commuters, 14.5%), and 25 to 29 minutes (14 commuters, 10.7%).
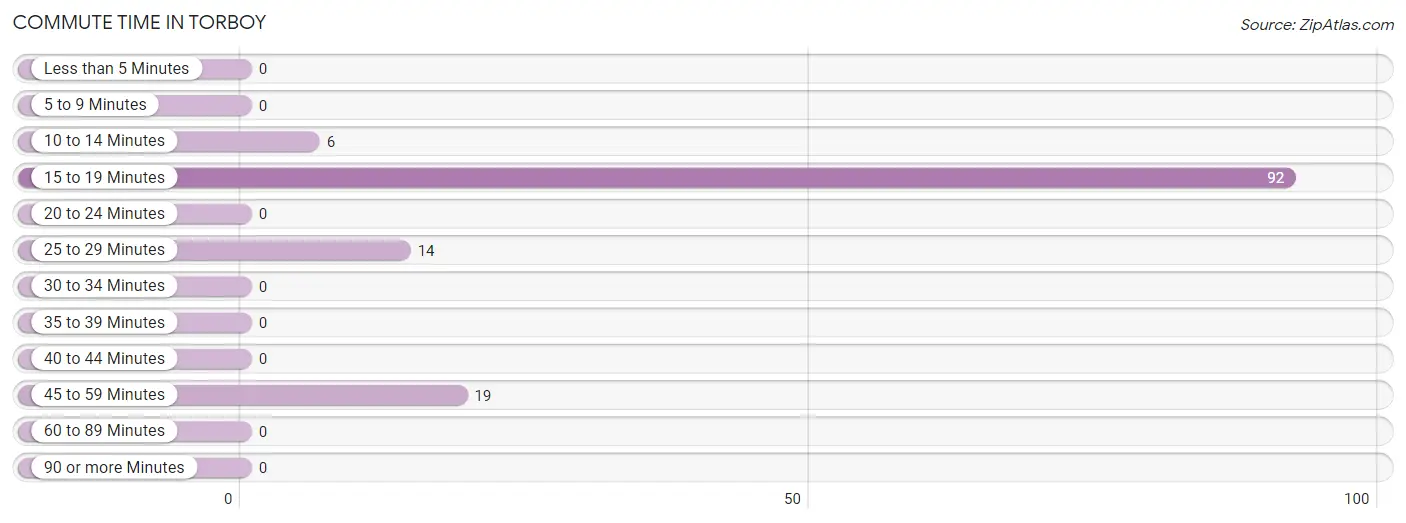
| Commute Time | # Commuters | % Commuters |
| Less than 5 Minutes | 0 | 0.0% |
| 5 to 9 Minutes | 0 | 0.0% |
| 10 to 14 Minutes | 6 | 4.6% |
| 15 to 19 Minutes | 92 | 70.2% |
| 20 to 24 Minutes | 0 | 0.0% |
| 25 to 29 Minutes | 14 | 10.7% |
| 30 to 34 Minutes | 0 | 0.0% |
| 35 to 39 Minutes | 0 | 0.0% |
| 40 to 44 Minutes | 0 | 0.0% |
| 45 to 59 Minutes | 19 | 14.5% |
| 60 to 89 Minutes | 0 | 0.0% |
| 90 or more Minutes | 0 | 0.0% |
Commute Time by Sex in Torboy
The most common commute times in Torboy are 15 to 19 minutes (84 commuters, 81.6%) for males and 25 to 29 minutes (14 commuters, 50.0%) for females.
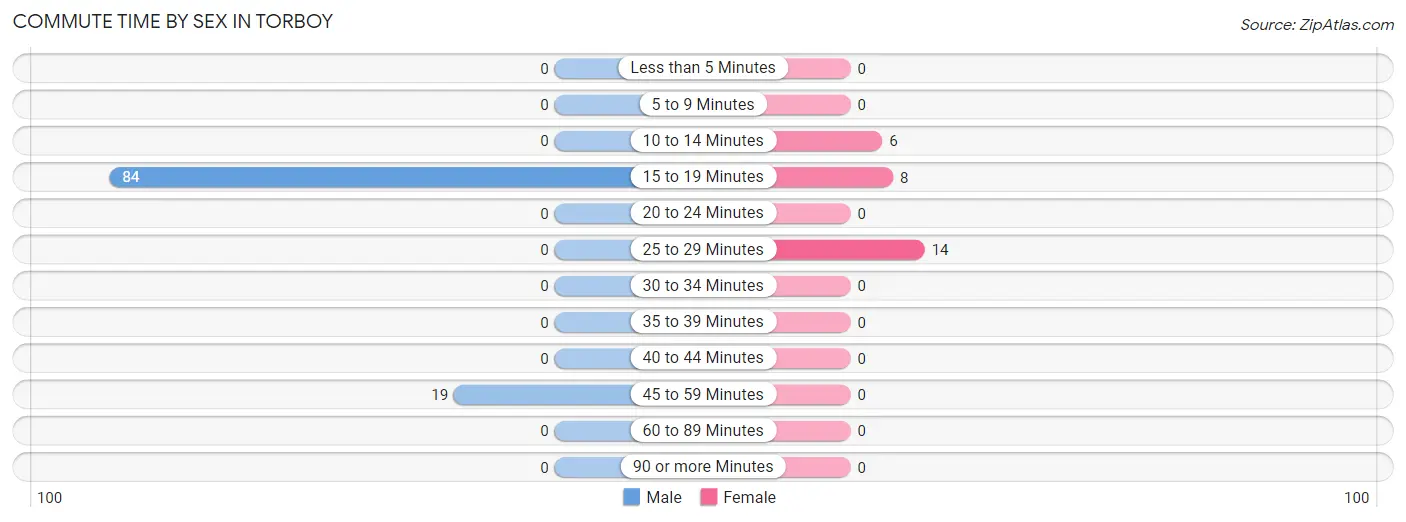
| Commute Time | Male | Female |
| Less than 5 Minutes | 0 (0.0%) | 0 (0.0%) |
| 5 to 9 Minutes | 0 (0.0%) | 0 (0.0%) |
| 10 to 14 Minutes | 0 (0.0%) | 6 (21.4%) |
| 15 to 19 Minutes | 84 (81.6%) | 8 (28.6%) |
| 20 to 24 Minutes | 0 (0.0%) | 0 (0.0%) |
| 25 to 29 Minutes | 0 (0.0%) | 14 (50.0%) |
| 30 to 34 Minutes | 0 (0.0%) | 0 (0.0%) |
| 35 to 39 Minutes | 0 (0.0%) | 0 (0.0%) |
| 40 to 44 Minutes | 0 (0.0%) | 0 (0.0%) |
| 45 to 59 Minutes | 19 (18.4%) | 0 (0.0%) |
| 60 to 89 Minutes | 0 (0.0%) | 0 (0.0%) |
| 90 or more Minutes | 0 (0.0%) | 0 (0.0%) |
Time of Departure to Work by Sex in Torboy
The most frequent times of departure to work in Torboy are 6:00 AM to 6:29 AM (46, 44.7%) for males and 12:00 PM to 3:59 PM (14, 50.0%) for females.
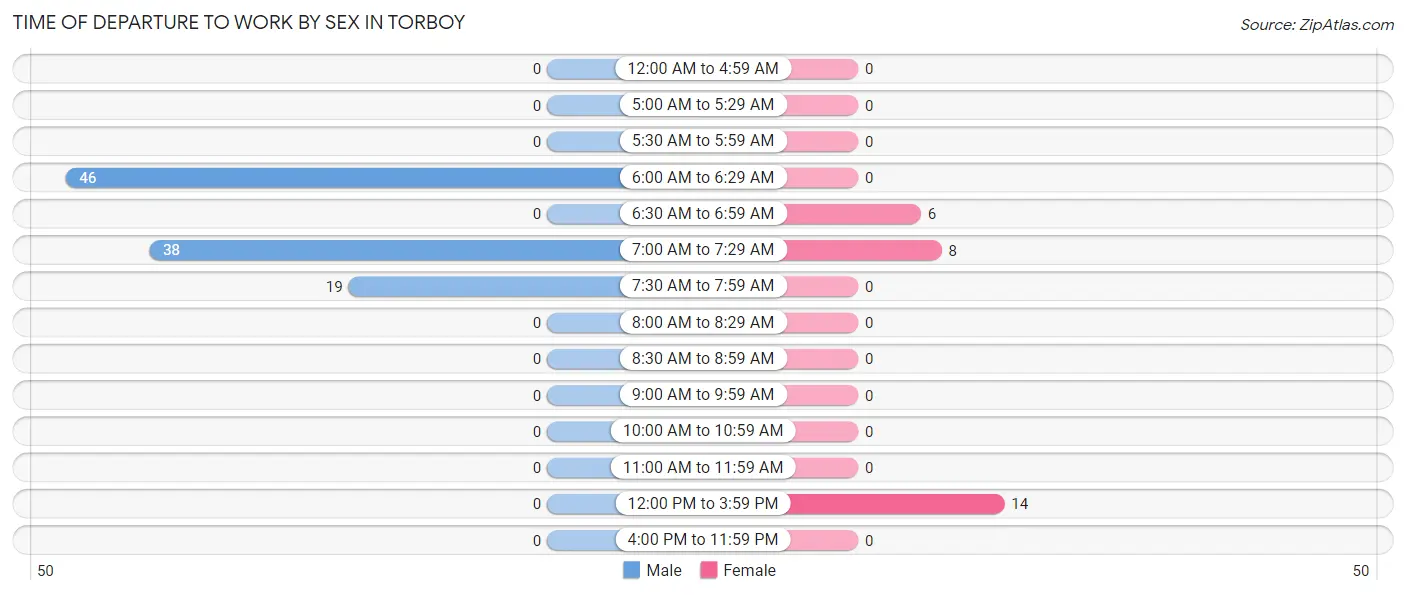
| Time of Departure | Male | Female |
| 12:00 AM to 4:59 AM | 0 (0.0%) | 0 (0.0%) |
| 5:00 AM to 5:29 AM | 0 (0.0%) | 0 (0.0%) |
| 5:30 AM to 5:59 AM | 0 (0.0%) | 0 (0.0%) |
| 6:00 AM to 6:29 AM | 46 (44.7%) | 0 (0.0%) |
| 6:30 AM to 6:59 AM | 0 (0.0%) | 6 (21.4%) |
| 7:00 AM to 7:29 AM | 38 (36.9%) | 8 (28.6%) |
| 7:30 AM to 7:59 AM | 19 (18.4%) | 0 (0.0%) |
| 8:00 AM to 8:29 AM | 0 (0.0%) | 0 (0.0%) |
| 8:30 AM to 8:59 AM | 0 (0.0%) | 0 (0.0%) |
| 9:00 AM to 9:59 AM | 0 (0.0%) | 0 (0.0%) |
| 10:00 AM to 10:59 AM | 0 (0.0%) | 0 (0.0%) |
| 11:00 AM to 11:59 AM | 0 (0.0%) | 0 (0.0%) |
| 12:00 PM to 3:59 PM | 0 (0.0%) | 14 (50.0%) |
| 4:00 PM to 11:59 PM | 0 (0.0%) | 0 (0.0%) |
| Total | 103 (100.0%) | 28 (100.0%) |
Housing Occupancy in Torboy
Occupancy by Ownership in Torboy
Of the total 28 dwellings in Torboy, owner-occupied units account for 14 (50.0%), while renter-occupied units make up 14 (50.0%).
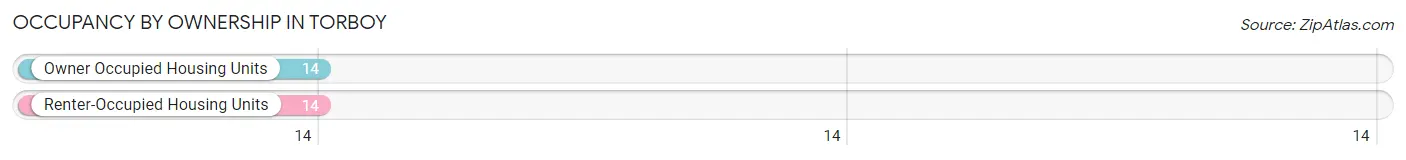
| Occupancy | # Housing Units | % Housing Units |
| Owner Occupied Housing Units | 14 | 50.0% |
| Renter-Occupied Housing Units | 14 | 50.0% |
| Total Occupied Housing Units | 28 | 100.0% |
Occupancy by Household Size in Torboy
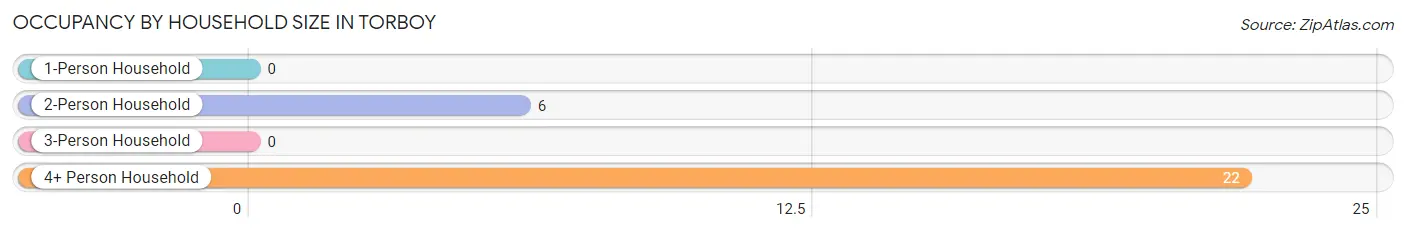
| Household Size | # Housing Units | % Housing Units |
| 1-Person Household | 0 | 0.0% |
| 2-Person Household | 6 | 21.4% |
| 3-Person Household | 0 | 0.0% |
| 4+ Person Household | 22 | 78.6% |
| Total Housing Units | 28 | 100.0% |
Occupancy by Ownership by Household Size in Torboy
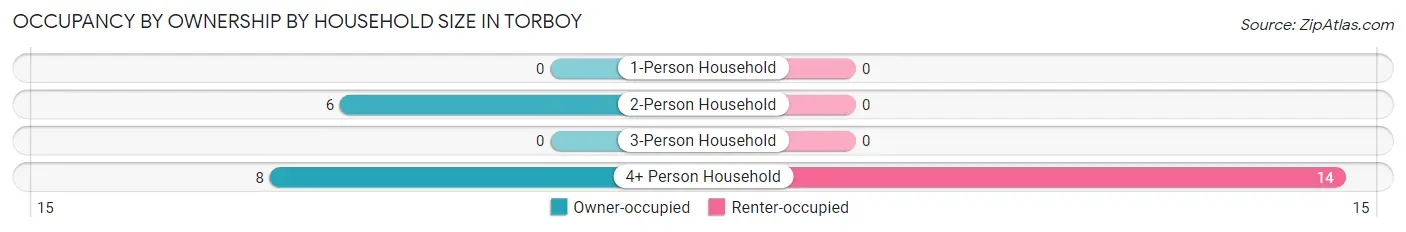
| Household Size | Owner-occupied | Renter-occupied |
| 1-Person Household | 0 (0.0%) | 0 (0.0%) |
| 2-Person Household | 6 (100.0%) | 0 (0.0%) |
| 3-Person Household | 0 (0.0%) | 0 (0.0%) |
| 4+ Person Household | 8 (36.4%) | 14 (63.6%) |
| Total Housing Units | 14 (50.0%) | 14 (50.0%) |
Occupancy by Educational Attainment in Torboy
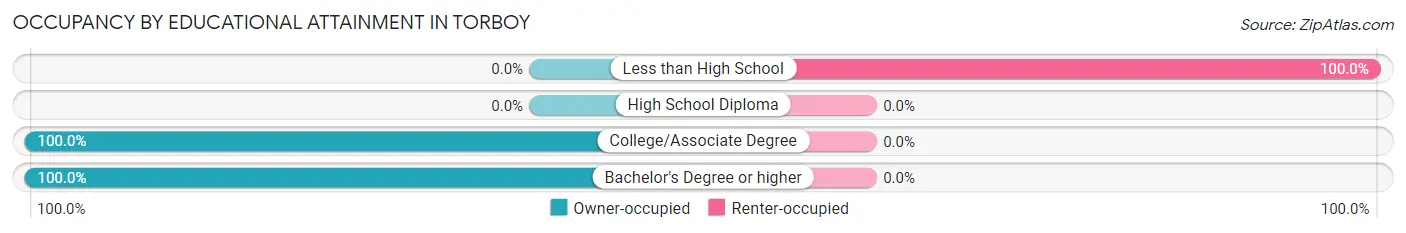
| Household Size | Owner-occupied | Renter-occupied |
| Less than High School | 0 (0.0%) | 14 (100.0%) |
| High School Diploma | 0 (0.0%) | 0 (0.0%) |
| College/Associate Degree | 8 (100.0%) | 0 (0.0%) |
| Bachelor's Degree or higher | 6 (100.0%) | 0 (0.0%) |
Occupancy by Age of Householder in Torboy
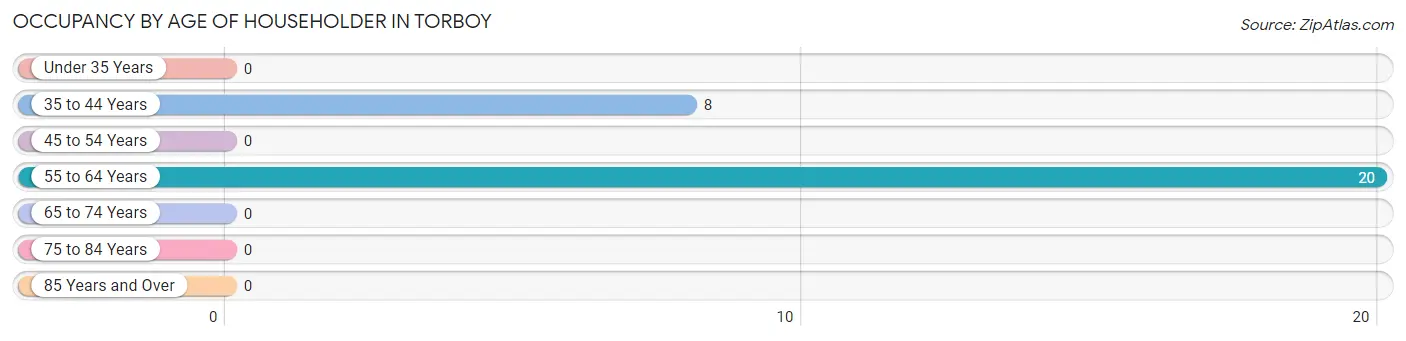
| Age Bracket | # Households | % Households |
| Under 35 Years | 0 | 0.0% |
| 35 to 44 Years | 8 | 28.6% |
| 45 to 54 Years | 0 | 0.0% |
| 55 to 64 Years | 20 | 71.4% |
| 65 to 74 Years | 0 | 0.0% |
| 75 to 84 Years | 0 | 0.0% |
| 85 Years and Over | 0 | 0.0% |
| Total | 28 | 100.0% |
Housing Finances in Torboy
Median Income by Occupancy in Torboy
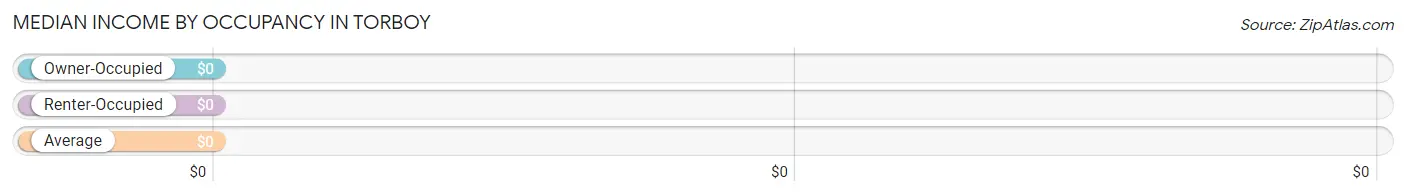
| Occupancy Type | # Households | Median Income |
| Owner-Occupied | 14 (50.0%) | $0 |
| Renter-Occupied | 14 (50.0%) | $0 |
| Average | 28 (100.0%) | $0 |
Occupancy by Householder Income Bracket in Torboy
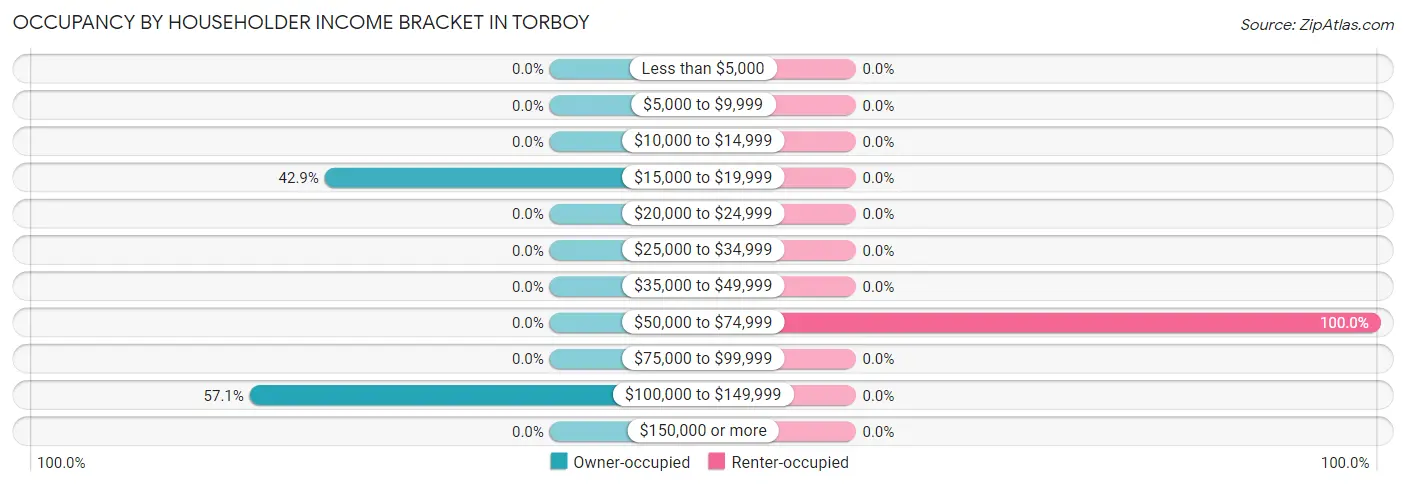
| Income Bracket | Owner-occupied | Renter-occupied |
| Less than $5,000 | 0 (0.0%) | 0 (0.0%) |
| $5,000 to $9,999 | 0 (0.0%) | 0 (0.0%) |
| $10,000 to $14,999 | 0 (0.0%) | 0 (0.0%) |
| $15,000 to $19,999 | 6 (42.9%) | 0 (0.0%) |
| $20,000 to $24,999 | 0 (0.0%) | 0 (0.0%) |
| $25,000 to $34,999 | 0 (0.0%) | 0 (0.0%) |
| $35,000 to $49,999 | 0 (0.0%) | 0 (0.0%) |
| $50,000 to $74,999 | 0 (0.0%) | 14 (100.0%) |
| $75,000 to $99,999 | 0 (0.0%) | 0 (0.0%) |
| $100,000 to $149,999 | 8 (57.1%) | 0 (0.0%) |
| $150,000 or more | 0 (0.0%) | 0 (0.0%) |
| Total | 14 (100.0%) | 14 (100.0%) |
Monthly Housing Cost Tiers in Torboy
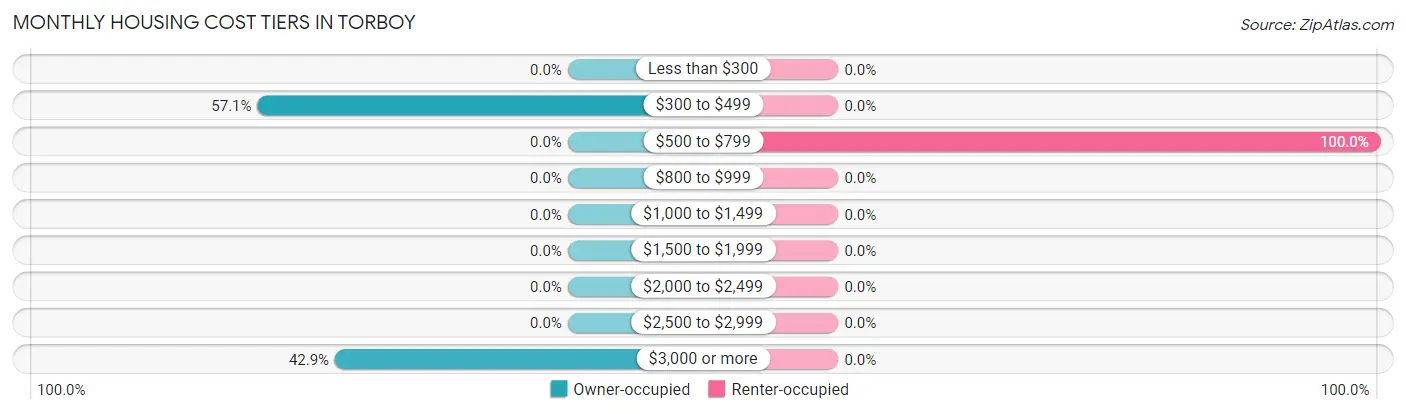
| Monthly Cost | Owner-occupied | Renter-occupied |
| Less than $300 | 0 (0.0%) | 0 (0.0%) |
| $300 to $499 | 8 (57.1%) | 0 (0.0%) |
| $500 to $799 | 0 (0.0%) | 14 (100.0%) |
| $800 to $999 | 0 (0.0%) | 0 (0.0%) |
| $1,000 to $1,499 | 0 (0.0%) | 0 (0.0%) |
| $1,500 to $1,999 | 0 (0.0%) | 0 (0.0%) |
| $2,000 to $2,499 | 0 (0.0%) | 0 (0.0%) |
| $2,500 to $2,999 | 0 (0.0%) | 0 (0.0%) |
| $3,000 or more | 6 (42.9%) | 0 (0.0%) |
| Total | 14 (100.0%) | 14 (100.0%) |
Physical Housing Characteristics in Torboy
Housing Structures in Torboy
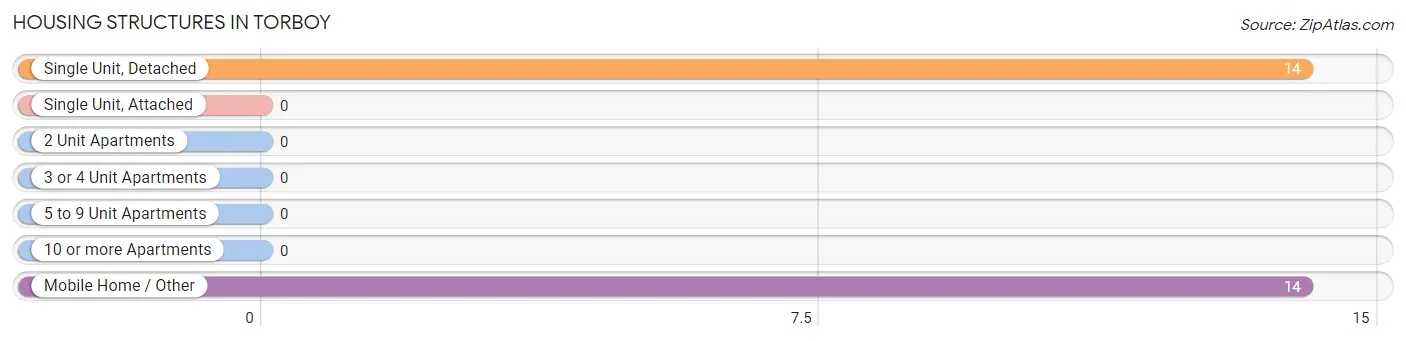
| Structure Type | # Housing Units | % Housing Units |
| Single Unit, Detached | 14 | 50.0% |
| Single Unit, Attached | 0 | 0.0% |
| 2 Unit Apartments | 0 | 0.0% |
| 3 or 4 Unit Apartments | 0 | 0.0% |
| 5 to 9 Unit Apartments | 0 | 0.0% |
| 10 or more Apartments | 0 | 0.0% |
| Mobile Home / Other | 14 | 50.0% |
| Total | 28 | 100.0% |
Housing Structures by Occupancy in Torboy
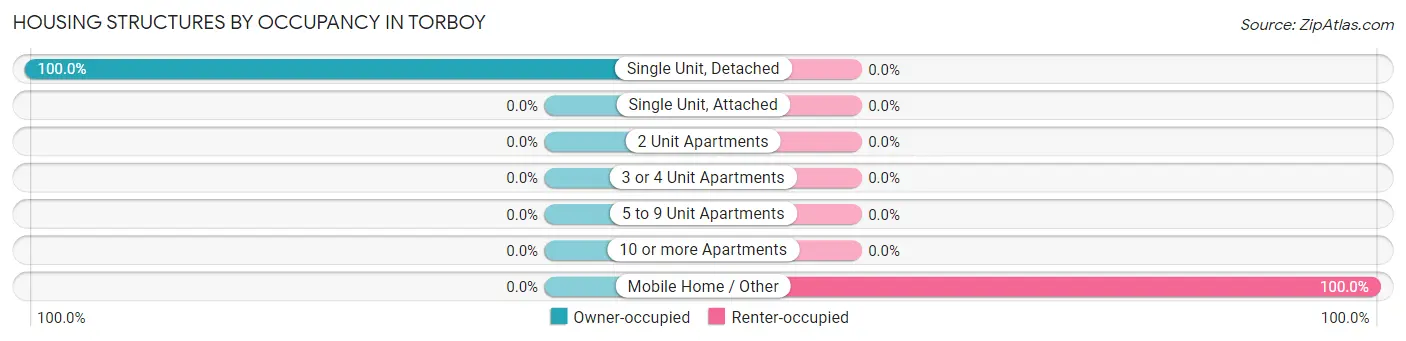
| Structure Type | Owner-occupied | Renter-occupied |
| Single Unit, Detached | 14 (100.0%) | 0 (0.0%) |
| Single Unit, Attached | 0 (0.0%) | 0 (0.0%) |
| 2 Unit Apartments | 0 (0.0%) | 0 (0.0%) |
| 3 or 4 Unit Apartments | 0 (0.0%) | 0 (0.0%) |
| 5 to 9 Unit Apartments | 0 (0.0%) | 0 (0.0%) |
| 10 or more Apartments | 0 (0.0%) | 0 (0.0%) |
| Mobile Home / Other | 0 (0.0%) | 14 (100.0%) |
| Total | 14 (50.0%) | 14 (50.0%) |
Housing Structures by Number of Rooms in Torboy
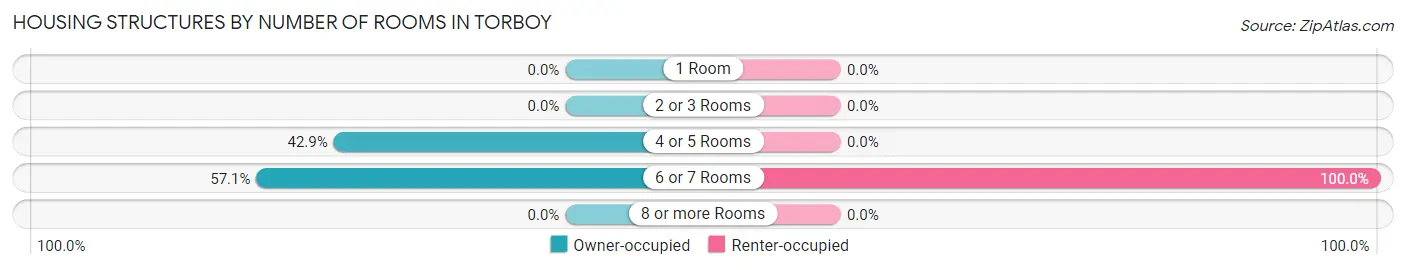
| Number of Rooms | Owner-occupied | Renter-occupied |
| 1 Room | 0 (0.0%) | 0 (0.0%) |
| 2 or 3 Rooms | 0 (0.0%) | 0 (0.0%) |
| 4 or 5 Rooms | 6 (42.9%) | 0 (0.0%) |
| 6 or 7 Rooms | 8 (57.1%) | 14 (100.0%) |
| 8 or more Rooms | 0 (0.0%) | 0 (0.0%) |
| Total | 14 (100.0%) | 14 (100.0%) |
Housing Structure by Heating Type in Torboy
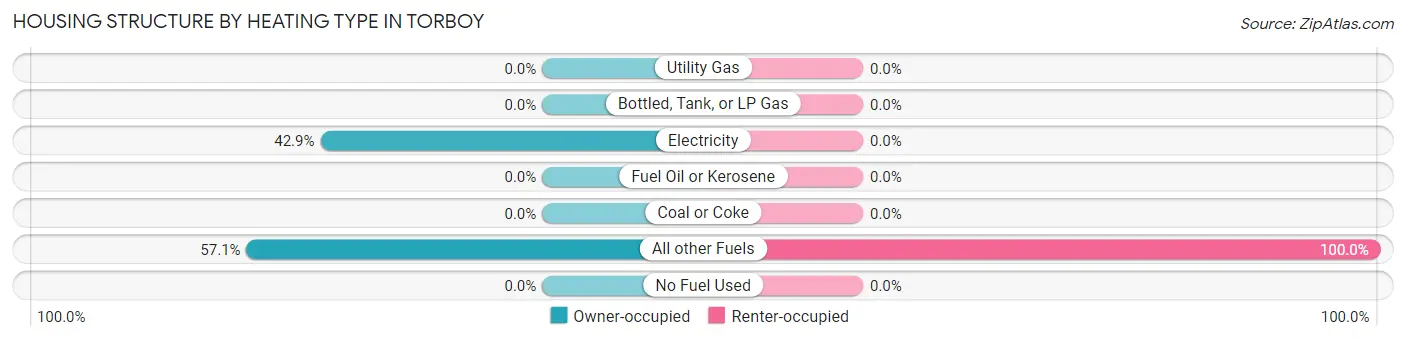
| Heating Type | Owner-occupied | Renter-occupied |
| Utility Gas | 0 (0.0%) | 0 (0.0%) |
| Bottled, Tank, or LP Gas | 0 (0.0%) | 0 (0.0%) |
| Electricity | 6 (42.9%) | 0 (0.0%) |
| Fuel Oil or Kerosene | 0 (0.0%) | 0 (0.0%) |
| Coal or Coke | 0 (0.0%) | 0 (0.0%) |
| All other Fuels | 8 (57.1%) | 14 (100.0%) |
| No Fuel Used | 0 (0.0%) | 0 (0.0%) |
| Total | 14 (100.0%) | 14 (100.0%) |
Household Vehicle Usage in Torboy
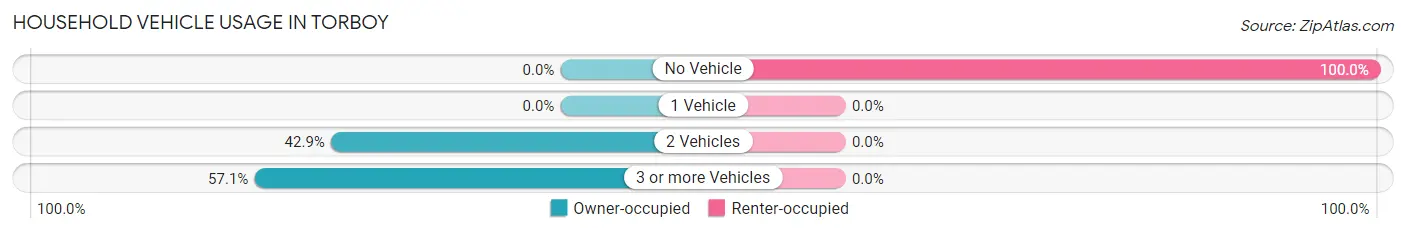
| Vehicles per Household | Owner-occupied | Renter-occupied |
| No Vehicle | 0 (0.0%) | 14 (100.0%) |
| 1 Vehicle | 0 (0.0%) | 0 (0.0%) |
| 2 Vehicles | 6 (42.9%) | 0 (0.0%) |
| 3 or more Vehicles | 8 (57.1%) | 0 (0.0%) |
| Total | 14 (100.0%) | 14 (100.0%) |
Real Estate & Mortgages in Torboy
Real Estate and Mortgage Overview in Torboy
| Characteristic | Without Mortgage | With Mortgage |
| Housing Units | 8 | 6 |
| Median Property Value | - | - |
| Median Household Income | - | - |
| Monthly Housing Costs | - | - |
| Real Estate Taxes | - | - |
Property Value by Mortgage Status in Torboy
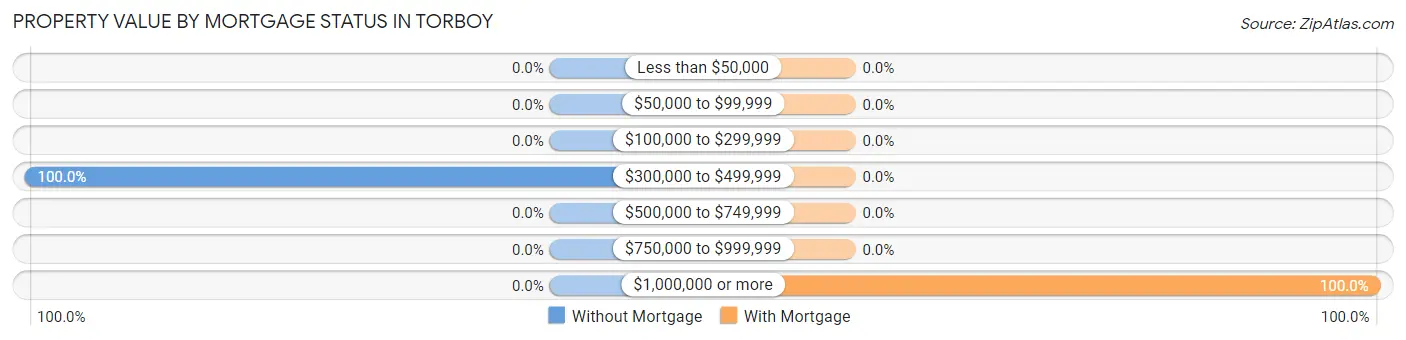
| Property Value | Without Mortgage | With Mortgage |
| Less than $50,000 | 0 (0.0%) | 0 (0.0%) |
| $50,000 to $99,999 | 0 (0.0%) | 0 (0.0%) |
| $100,000 to $299,999 | 0 (0.0%) | 0 (0.0%) |
| $300,000 to $499,999 | 8 (100.0%) | 0 (0.0%) |
| $500,000 to $749,999 | 0 (0.0%) | 0 (0.0%) |
| $750,000 to $999,999 | 0 (0.0%) | 0 (0.0%) |
| $1,000,000 or more | 0 (0.0%) | 6 (100.0%) |
| Total | 8 (100.0%) | 6 (100.0%) |
Household Income by Mortgage Status in Torboy
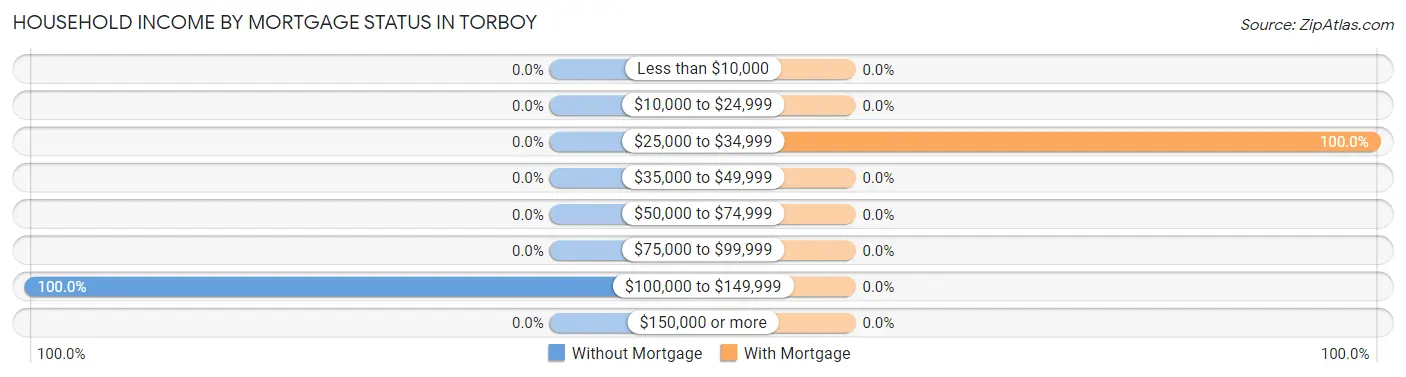
| Household Income | Without Mortgage | With Mortgage |
| Less than $10,000 | 0 (0.0%) | 0 (0.0%) |
| $10,000 to $24,999 | 0 (0.0%) | 0 (0.0%) |
| $25,000 to $34,999 | 0 (0.0%) | 6 (100.0%) |
| $35,000 to $49,999 | 0 (0.0%) | 0 (0.0%) |
| $50,000 to $74,999 | 0 (0.0%) | 0 (0.0%) |
| $75,000 to $99,999 | 0 (0.0%) | 0 (0.0%) |
| $100,000 to $149,999 | 8 (100.0%) | 0 (0.0%) |
| $150,000 or more | 0 (0.0%) | 0 (0.0%) |
| Total | 8 (100.0%) | 6 (100.0%) |
Property Value to Household Income Ratio in Torboy
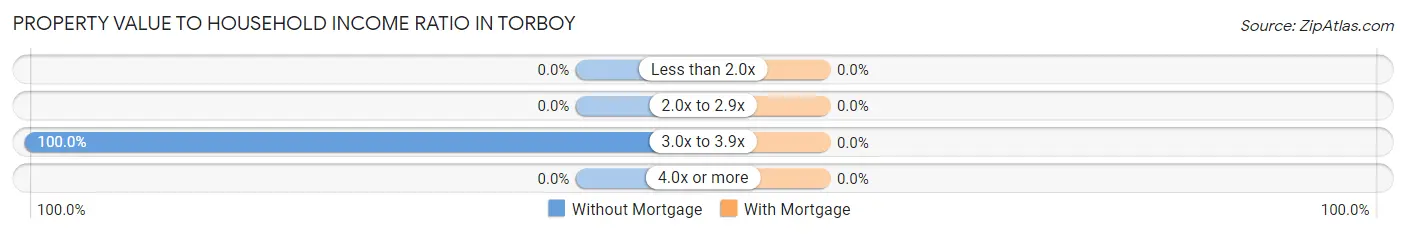
| Value-to-Income Ratio | Without Mortgage | With Mortgage |
| Less than 2.0x | 0 (0.0%) | 0 (0.0%) |
| 2.0x to 2.9x | 0 (0.0%) | 0 (0.0%) |
| 3.0x to 3.9x | 8 (100.0%) | 0 (0.0%) |
| 4.0x or more | 0 (0.0%) | 0 (0.0%) |
| Total | 8 (100.0%) | 6 (100.0%) |
Real Estate Taxes by Mortgage Status in Torboy
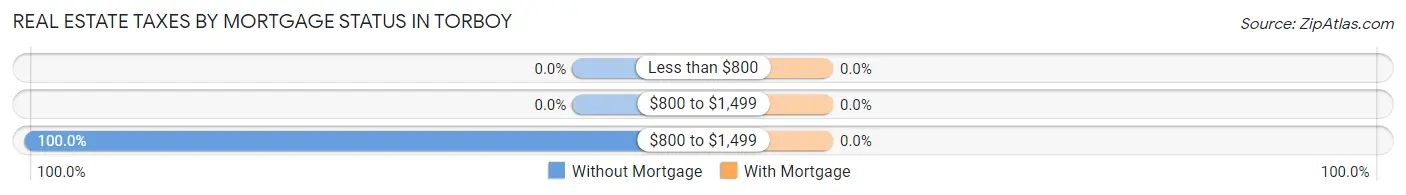
| Property Taxes | Without Mortgage | With Mortgage |
| Less than $800 | 0 (0.0%) | 0 (0.0%) |
| $800 to $1,499 | 0 (0.0%) | 0 (0.0%) |
| $800 to $1,499 | 8 (100.0%) | 0 (0.0%) |
| Total | 8 (100.0%) | 6 (100.0%) |
Health & Disability in Torboy
Health Insurance Coverage by Age in Torboy
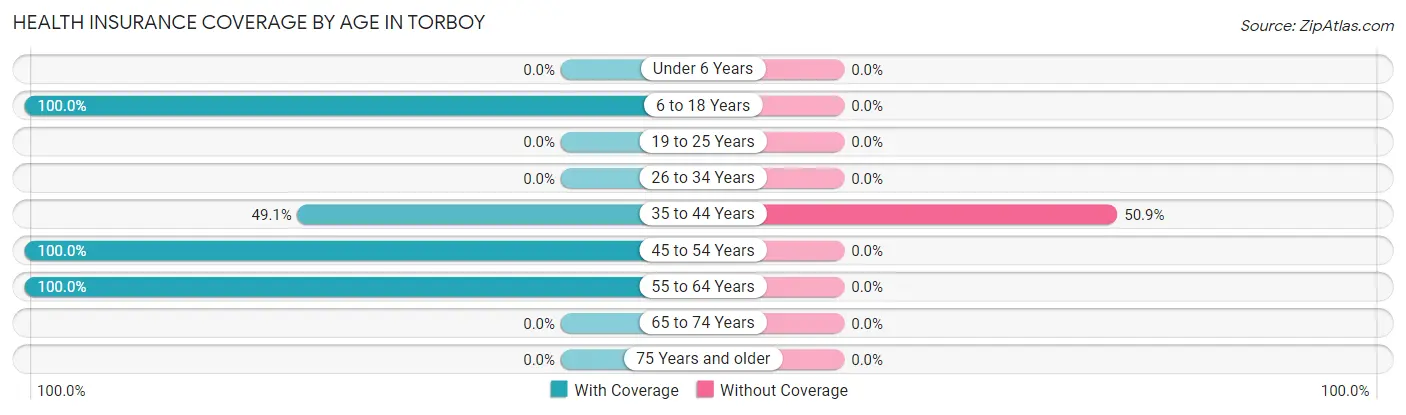
| Age Bracket | With Coverage | Without Coverage |
| Under 6 Years | 0 (0.0%) | 0 (0.0%) |
| 6 to 18 Years | 115 (100.0%) | 0 (0.0%) |
| 19 to 25 Years | 0 (0.0%) | 0 (0.0%) |
| 26 to 34 Years | 0 (0.0%) | 0 (0.0%) |
| 35 to 44 Years | 27 (49.1%) | 28 (50.9%) |
| 45 to 54 Years | 18 (100.0%) | 0 (0.0%) |
| 55 to 64 Years | 39 (100.0%) | 0 (0.0%) |
| 65 to 74 Years | 0 (0.0%) | 0 (0.0%) |
| 75 Years and older | 0 (0.0%) | 0 (0.0%) |
| Total | 199 (87.7%) | 28 (12.3%) |
Health Insurance Coverage by Citizenship Status in Torboy
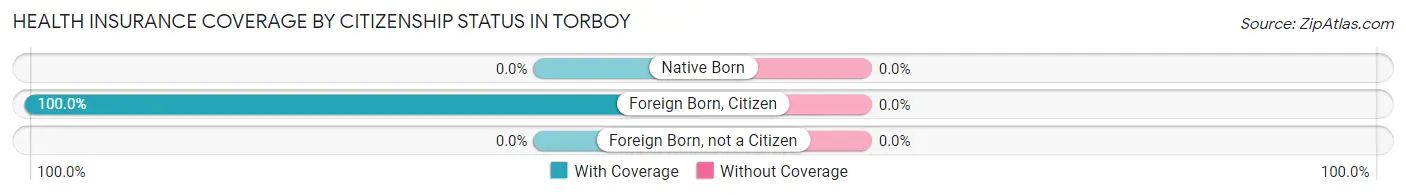
| Citizenship Status | With Coverage | Without Coverage |
| Native Born | 0 (0.0%) | 0 (0.0%) |
| Foreign Born, Citizen | 115 (100.0%) | 0 (0.0%) |
| Foreign Born, not a Citizen | 0 (0.0%) | 0 (0.0%) |
Health Insurance Coverage by Household Income in Torboy
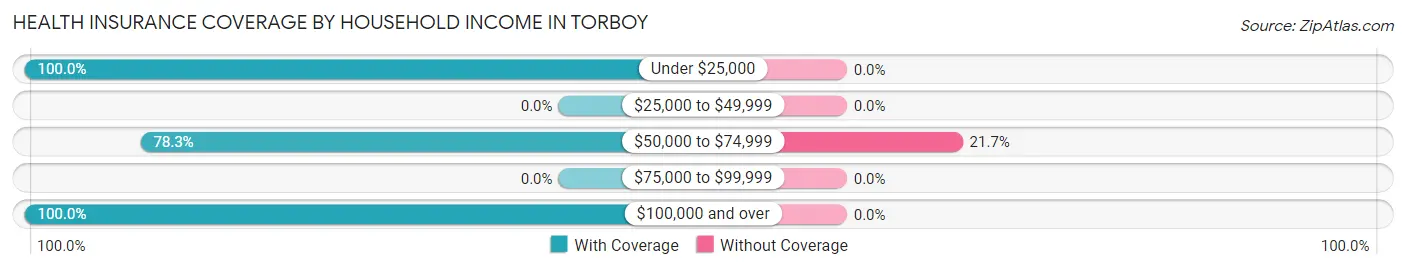
| Household Income | With Coverage | Without Coverage |
| Under $25,000 | 25 (100.0%) | 0 (0.0%) |
| $25,000 to $49,999 | 0 (0.0%) | 0 (0.0%) |
| $50,000 to $74,999 | 101 (78.3%) | 28 (21.7%) |
| $75,000 to $99,999 | 0 (0.0%) | 0 (0.0%) |
| $100,000 and over | 73 (100.0%) | 0 (0.0%) |
Public vs Private Health Insurance Coverage by Age in Torboy
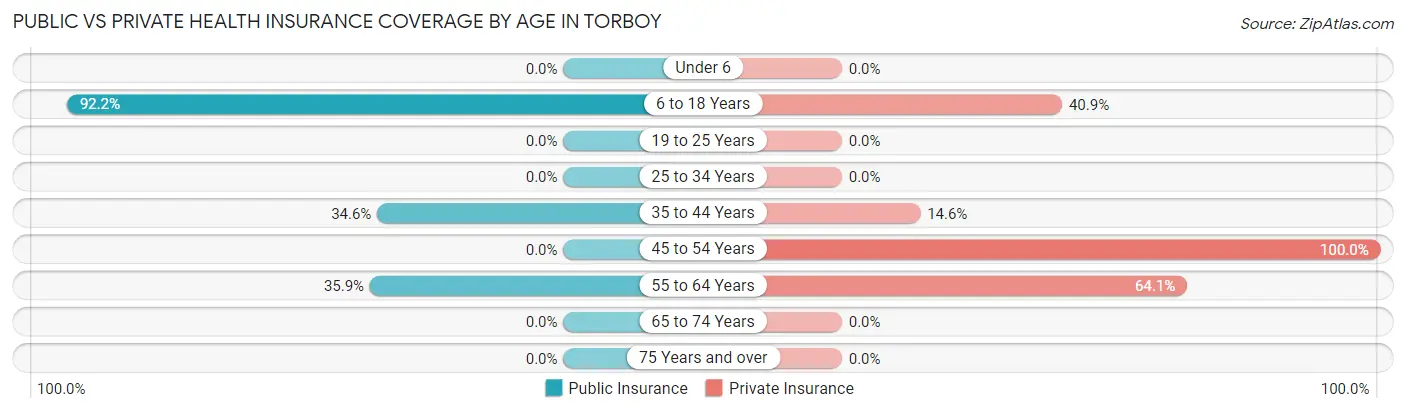
| Age Bracket | Public Insurance | Private Insurance |
| Under 6 | 0 (0.0%) | 0 (0.0%) |
| 6 to 18 Years | 106 (92.2%) | 47 (40.9%) |
| 19 to 25 Years | 0 (0.0%) | 0 (0.0%) |
| 25 to 34 Years | 0 (0.0%) | 0 (0.0%) |
| 35 to 44 Years | 19 (34.5%) | 8 (14.5%) |
| 45 to 54 Years | 0 (0.0%) | 18 (100.0%) |
| 55 to 64 Years | 14 (35.9%) | 25 (64.1%) |
| 65 to 74 Years | 0 (0.0%) | 0 (0.0%) |
| 75 Years and over | 0 (0.0%) | 0 (0.0%) |
| Total | 139 (61.2%) | 98 (43.2%) |
Disability Status by Sex by Age in Torboy
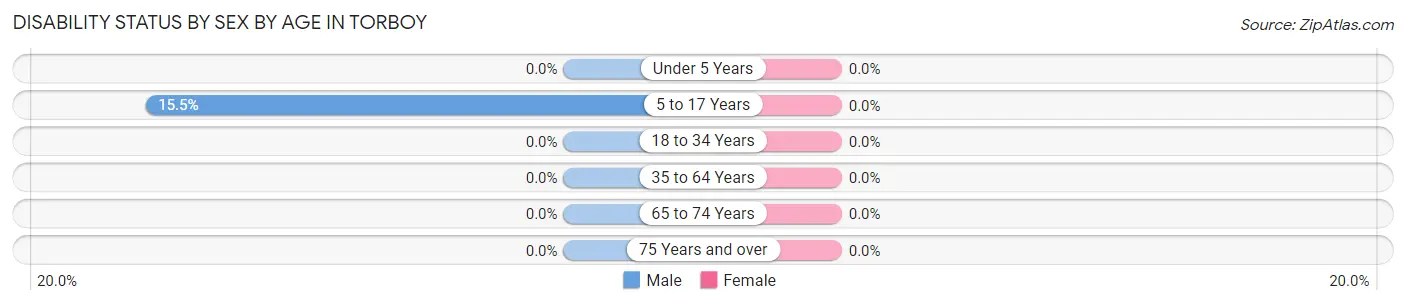
| Age Bracket | Male | Female |
| Under 5 Years | 0 (0.0%) | 0 (0.0%) |
| 5 to 17 Years | 9 (15.5%) | 0 (0.0%) |
| 18 to 34 Years | 0 (0.0%) | 0 (0.0%) |
| 35 to 64 Years | 0 (0.0%) | 0 (0.0%) |
| 65 to 74 Years | 0 (0.0%) | 0 (0.0%) |
| 75 Years and over | 0 (0.0%) | 0 (0.0%) |
Disability Class by Sex by Age in Torboy
Disability Class: Hearing Difficulty
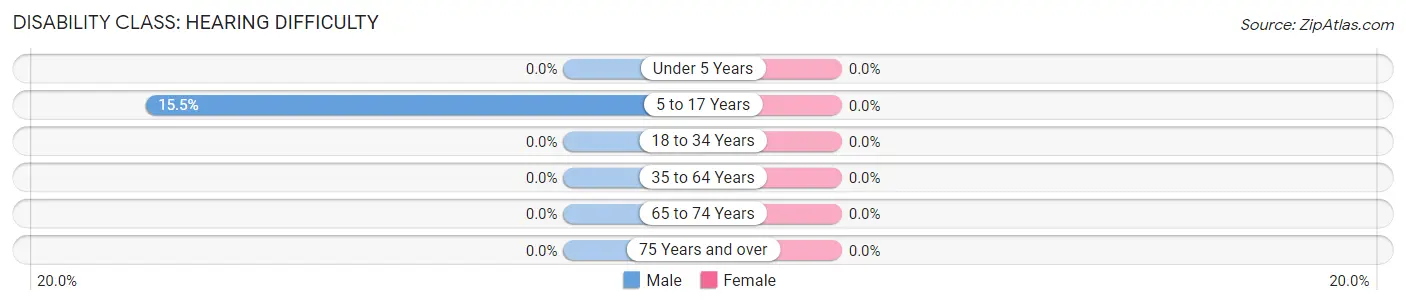
| Age Bracket | Male | Female |
| Under 5 Years | 0 (0.0%) | 0 (0.0%) |
| 5 to 17 Years | 9 (15.5%) | 0 (0.0%) |
| 18 to 34 Years | 0 (0.0%) | 0 (0.0%) |
| 35 to 64 Years | 0 (0.0%) | 0 (0.0%) |
| 65 to 74 Years | 0 (0.0%) | 0 (0.0%) |
| 75 Years and over | 0 (0.0%) | 0 (0.0%) |
Disability Class: Vision Difficulty
| Age Bracket | Male | Female |
| Under 5 Years | 0 (0.0%) | 0 (0.0%) |
| 5 to 17 Years | 0 (0.0%) | 0 (0.0%) |
| 18 to 34 Years | 0 (0.0%) | 0 (0.0%) |
| 35 to 64 Years | 0 (0.0%) | 0 (0.0%) |
| 65 to 74 Years | 0 (0.0%) | 0 (0.0%) |
| 75 Years and over | 0 (0.0%) | 0 (0.0%) |
Disability Class: Cognitive Difficulty
| Age Bracket | Male | Female |
| 5 to 17 Years | 0 (0.0%) | 0 (0.0%) |
| 18 to 34 Years | 0 (0.0%) | 0 (0.0%) |
| 35 to 64 Years | 0 (0.0%) | 0 (0.0%) |
| 65 to 74 Years | 0 (0.0%) | 0 (0.0%) |
| 75 Years and over | 0 (0.0%) | 0 (0.0%) |
Disability Class: Ambulatory Difficulty
| Age Bracket | Male | Female |
| 5 to 17 Years | 0 (0.0%) | 0 (0.0%) |
| 18 to 34 Years | 0 (0.0%) | 0 (0.0%) |
| 35 to 64 Years | 0 (0.0%) | 0 (0.0%) |
| 65 to 74 Years | 0 (0.0%) | 0 (0.0%) |
| 75 Years and over | 0 (0.0%) | 0 (0.0%) |
Disability Class: Self-Care Difficulty
| Age Bracket | Male | Female |
| 5 to 17 Years | 0 (0.0%) | 0 (0.0%) |
| 18 to 34 Years | 0 (0.0%) | 0 (0.0%) |
| 35 to 64 Years | 0 (0.0%) | 0 (0.0%) |
| 65 to 74 Years | 0 (0.0%) | 0 (0.0%) |
| 75 Years and over | 0 (0.0%) | 0 (0.0%) |
Technology Access in Torboy
Computing Device Access in Torboy
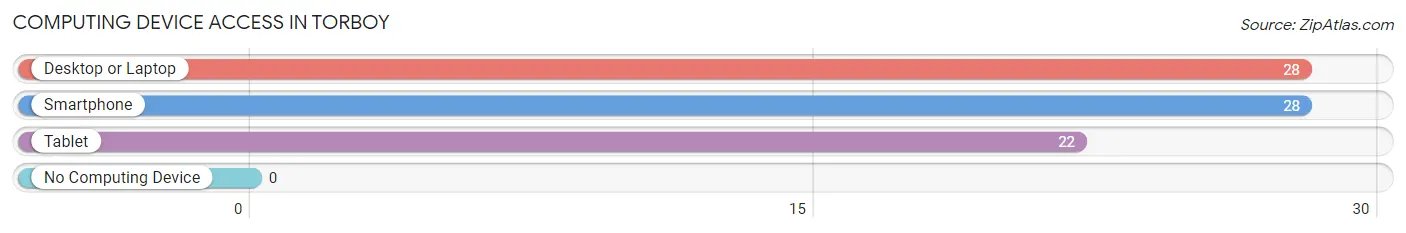
| Device Type | # Households | % Households |
| Desktop or Laptop | 28 | 100.0% |
| Smartphone | 28 | 100.0% |
| Tablet | 22 | 78.6% |
| No Computing Device | 0 | 0.0% |
| Total | 28 | 100.0% |
Internet Access in Torboy
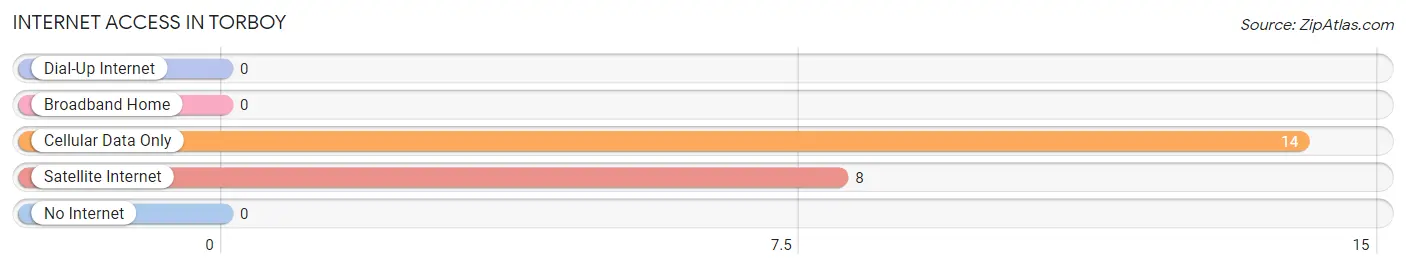
| Internet Type | # Households | % Households |
| Dial-Up Internet | 0 | 0.0% |
| Broadband Home | 0 | 0.0% |
| Cellular Data Only | 14 | 50.0% |
| Satellite Internet | 8 | 28.6% |
| No Internet | 0 | 0.0% |
| Total | 28 | 100.0% |
Torboy Summary
Torboy is a small town located in the state of Washington, United States. It is situated in the county of Whatcom, and is part of the Bellingham Metropolitan Statistical Area. The town has a population of approximately 1,000 people, and is located in the foothills of the Cascade Mountains.
Geography
Torboy is located in the foothills of the Cascade Mountains, and is situated in the Nooksack River Valley. The town is surrounded by lush forests and rolling hills, and is located at an elevation of 1,000 feet. The town is located approximately 20 miles east of Bellingham, and is accessible by State Route 539. The town is also located close to the Canadian border, and is approximately 30 miles from the city of Vancouver, British Columbia.
Climate
Torboy has a temperate climate, with warm summers and cool winters. The average temperature in the summer months is around 70 degrees Fahrenheit, while the average temperature in the winter months is around 40 degrees Fahrenheit. The town receives an average of 40 inches of precipitation per year, with most of the precipitation occurring in the winter months.
Demographics
As of the 2010 census, the population of Torboy was 1,000 people. The racial makeup of the town was 95.2% White, 0.7% African American, 0.7% Native American, 0.7% Asian, 0.7% from other races, and 2.1% from two or more races. Hispanic or Latino of any race were 2.1% of the population.
Economy
The economy of Torboy is largely based on agriculture and forestry. The town is home to several small farms, and the surrounding forests provide timber for the local lumber industry. The town is also home to several small businesses, including restaurants, retail stores, and service providers.
History
The area that is now Torboy was first settled in the late 1800s by homesteaders. The town was officially incorporated in 1910, and was named after the Torboy family, who were among the first settlers in the area. The town grew slowly over the years, and by the 1950s, the population had grown to around 500 people. The town has remained relatively small since then, and the population has remained relatively stable.
Conclusion
Torboy is a small town located in the state of Washington, United States. It is situated in the county of Whatcom, and is part of the Bellingham Metropolitan Statistical Area. The town has a population of approximately 1,000 people, and is located in the foothills of the Cascade Mountains. The economy of Torboy is largely based on agriculture and forestry, and the town is home to several small businesses. The town was first settled in the late 1800s, and was officially incorporated in 1910. The population of Torboy has remained relatively stable since then, and the town continues to be a peaceful and picturesque place to live.
Common Questions
What is Per Capita Income in Torboy?
Per Capita income in Torboy is $13,147.
What is Inequality or Gini Index in Torboy?
Inequality or Gini Index in Torboy is 0.30.
What is the Total Population of Torboy?
Total Population of Torboy is 227.
What is the Total Male Population of Torboy?
Total Male Population of Torboy is 161.
What is the Total Female Population of Torboy?
Total Female Population of Torboy is 66.
What is the Ratio of Males per 100 Females in Torboy?
There are 243.94 Males per 100 Females in Torboy.
What is the Ratio of Females per 100 Males in Torboy?
There are 40.99 Females per 100 Males in Torboy.
What is the Median Population Age in Torboy?
Median Population Age in Torboy is 19.0 Years.
What is the Average Family Size in Torboy
Average Family Size in Torboy is 8.1 People.
What is the Average Household Size in Torboy
Average Household Size in Torboy is 8.1 People.
How Large is the Labor Force in Torboy?
There are 131 People in the Labor Forcein in Torboy.
What is the Percentage of People in the Labor Force in Torboy?
82.4% of People are in the Labor Force in Torboy.