Cities with the Highest Percentage of Eastern European Population in Washington
RELATED REPORTS & OPTIONS
Eastern European
Washington
Compare Cities
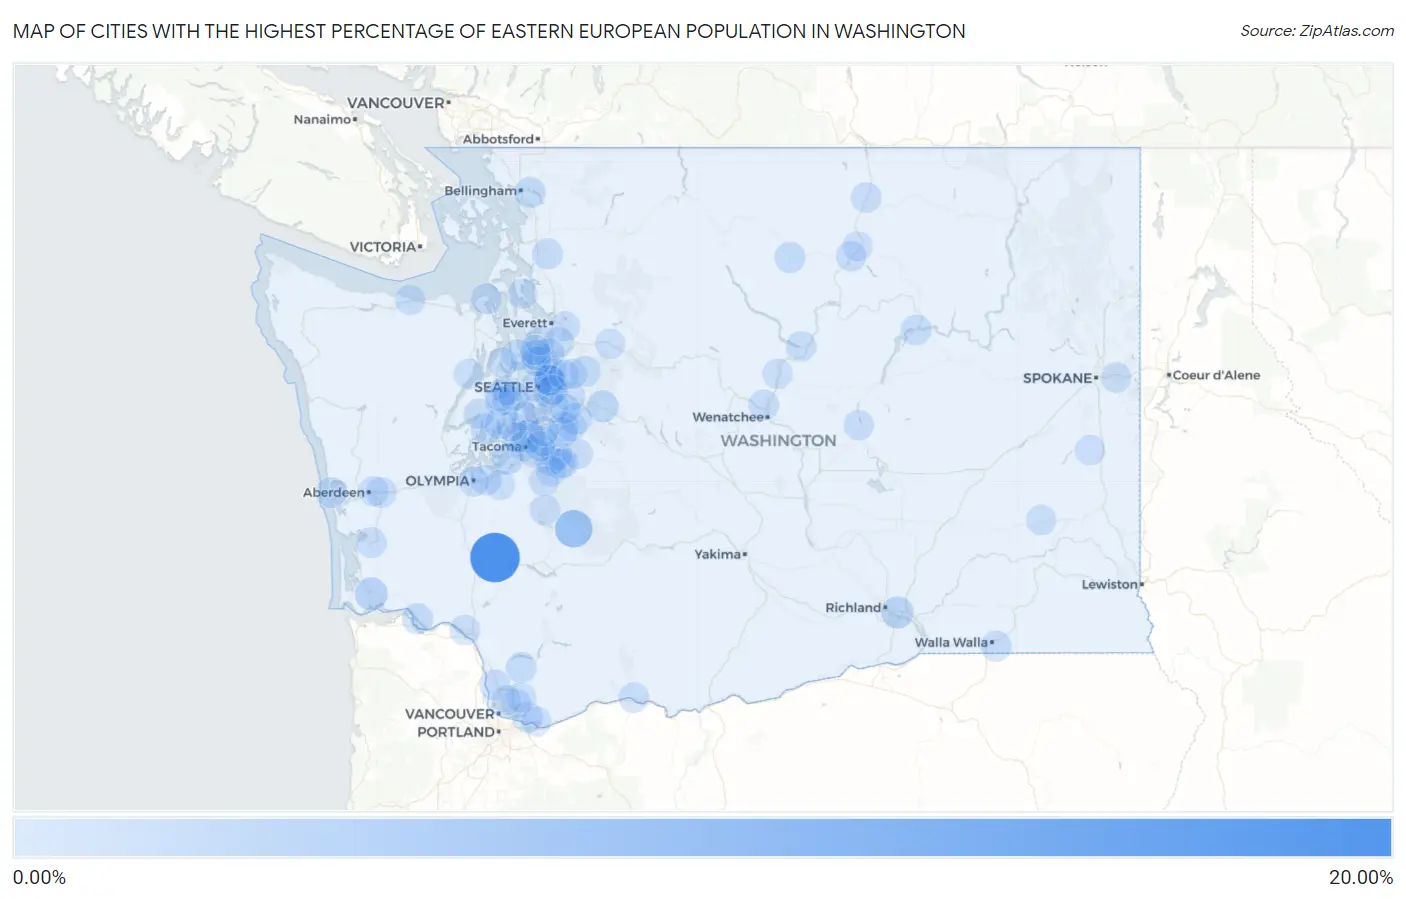
Map of Cities with the Highest Percentage of Eastern European Population in Washington
0.00%
20.00%
Cities with the Highest Percentage of Eastern European Population in Washington
| City | Eastern European | vs State | vs National | |
| 1. | Onalaska | 16.69% | 0.28%(+16.4)#1 | 0.30%(+16.4)#26 |
| 2. | Ashford | 6.22% | 0.28%(+5.94)#2 | 0.30%(+5.92)#97 |
| 3. | Clear Lake Cdp Pierce County | 2.68% | 0.28%(+2.40)#3 | 0.30%(+2.38)#442 |
| 4. | Naselle | 2.38% | 0.28%(+2.11)#4 | 0.30%(+2.08)#519 |
| 5. | Dash Point | 2.38% | 0.28%(+2.10)#5 | 0.30%(+2.08)#521 |
| 6. | West Pasco | 1.98% | 0.28%(+1.70)#6 | 0.30%(+1.67)#709 |
| 7. | North Bend | 1.66% | 0.28%(+1.38)#7 | 0.30%(+1.35)#894 |
| 8. | Steilacoom | 1.60% | 0.28%(+1.32)#8 | 0.30%(+1.30)#934 |
| 9. | Kingston | 1.40% | 0.28%(+1.12)#9 | 0.30%(+1.10)#1,104 |
| 10. | Lake Forest Park | 1.29% | 0.28%(+1.01)#10 | 0.30%(+0.981)#1,241 |
| 11. | Vaughn | 1.22% | 0.28%(+0.939)#11 | 0.30%(+0.915)#1,331 |
| 12. | Hobart | 1.22% | 0.28%(+0.936)#12 | 0.30%(+0.912)#1,336 |
| 13. | Cathlamet | 1.10% | 0.28%(+0.819)#13 | 0.30%(+0.795)#1,508 |
| 14. | Twisp | 1.10% | 0.28%(+0.816)#14 | 0.30%(+0.792)#1,514 |
| 15. | Lake Marcel Stillwater | 1.07% | 0.28%(+0.795)#15 | 0.30%(+0.771)#1,551 |
| 16. | Geneva | 1.05% | 0.28%(+0.770)#16 | 0.30%(+0.746)#1,591 |
| 17. | Walla Walla East | 0.99% | 0.28%(+0.706)#17 | 0.30%(+0.682)#1,711 |
| 18. | Navy Yard City | 0.98% | 0.28%(+0.704)#18 | 0.30%(+0.680)#1,717 |
| 19. | Clyde Hill | 0.97% | 0.28%(+0.686)#19 | 0.30%(+0.662)#1,766 |
| 20. | Amboy | 0.95% | 0.28%(+0.673)#20 | 0.30%(+0.649)#1,790 |
| 21. | Big Lake | 0.93% | 0.28%(+0.647)#21 | 0.30%(+0.623)#1,847 |
| 22. | Wauna | 0.92% | 0.28%(+0.638)#22 | 0.30%(+0.613)#1,863 |
| 23. | Alderton | 0.89% | 0.28%(+0.614)#23 | 0.30%(+0.590)#1,911 |
| 24. | Bonney Lake | 0.87% | 0.28%(+0.593)#24 | 0.30%(+0.568)#1,966 |
| 25. | Grand Coulee | 0.87% | 0.28%(+0.591)#25 | 0.30%(+0.567)#1,969 |
| 26. | Port Townsend | 0.86% | 0.28%(+0.577)#26 | 0.30%(+0.552)#2,006 |
| 27. | Ridgefield | 0.84% | 0.28%(+0.565)#27 | 0.30%(+0.541)#2,035 |
| 28. | Sunnyslope | 0.84% | 0.28%(+0.565)#28 | 0.30%(+0.541)#2,036 |
| 29. | Mercer Island | 0.84% | 0.28%(+0.561)#29 | 0.30%(+0.537)#2,048 |
| 30. | Ocean Shores | 0.83% | 0.28%(+0.554)#30 | 0.30%(+0.530)#2,070 |
| 31. | Bothell West | 0.83% | 0.28%(+0.549)#31 | 0.30%(+0.524)#2,086 |
| 32. | Fairwood Cdp Spokane County | 0.81% | 0.28%(+0.532)#32 | 0.30%(+0.508)#2,150 |
| 33. | Yarrow Point | 0.78% | 0.28%(+0.502)#33 | 0.30%(+0.478)#2,228 |
| 34. | Camas | 0.76% | 0.28%(+0.478)#34 | 0.30%(+0.454)#2,309 |
| 35. | Prairie Ridge | 0.72% | 0.28%(+0.444)#35 | 0.30%(+0.420)#2,420 |
| 36. | Enumclaw | 0.72% | 0.28%(+0.441)#36 | 0.30%(+0.417)#2,438 |
| 37. | Issaquah | 0.70% | 0.28%(+0.421)#37 | 0.30%(+0.397)#2,492 |
| 38. | South Bend | 0.70% | 0.28%(+0.420)#38 | 0.30%(+0.396)#2,497 |
| 39. | Poulsbo | 0.69% | 0.28%(+0.414)#39 | 0.30%(+0.390)#2,515 |
| 40. | Waller | 0.69% | 0.28%(+0.409)#40 | 0.30%(+0.385)#2,536 |
| 41. | Kirkland | 0.68% | 0.28%(+0.404)#41 | 0.30%(+0.380)#2,550 |
| 42. | White Salmon | 0.68% | 0.28%(+0.399)#42 | 0.30%(+0.375)#2,571 |
| 43. | Longview | 0.67% | 0.28%(+0.391)#43 | 0.30%(+0.367)#2,593 |
| 44. | Silver Firs | 0.67% | 0.28%(+0.386)#44 | 0.30%(+0.362)#2,608 |
| 45. | Roche Harbor | 0.66% | 0.28%(+0.385)#45 | 0.30%(+0.360)#2,614 |
| 46. | Tonasket | 0.66% | 0.28%(+0.378)#46 | 0.30%(+0.354)#2,642 |
| 47. | Seattle | 0.63% | 0.28%(+0.355)#47 | 0.30%(+0.331)#2,726 |
| 48. | Esperance | 0.63% | 0.28%(+0.353)#48 | 0.30%(+0.329)#2,732 |
| 49. | Ruston | 0.63% | 0.28%(+0.350)#49 | 0.30%(+0.326)#2,750 |
| 50. | Parkwood | 0.63% | 0.28%(+0.350)#50 | 0.30%(+0.326)#2,752 |
| 51. | Hunts Point | 0.62% | 0.28%(+0.340)#51 | 0.30%(+0.315)#2,801 |
| 52. | Central Park | 0.61% | 0.28%(+0.335)#52 | 0.30%(+0.311)#2,821 |
| 53. | Vashon | 0.61% | 0.28%(+0.333)#53 | 0.30%(+0.309)#2,827 |
| 54. | Spokane Valley | 0.61% | 0.28%(+0.332)#54 | 0.30%(+0.307)#2,834 |
| 55. | Lakeview | 0.58% | 0.28%(+0.305)#55 | 0.30%(+0.281)#2,938 |
| 56. | Lexington | 0.57% | 0.28%(+0.292)#56 | 0.30%(+0.268)#3,000 |
| 57. | Eatonville | 0.56% | 0.28%(+0.283)#57 | 0.30%(+0.259)#3,029 |
| 58. | Tanglewilde | 0.56% | 0.28%(+0.282)#58 | 0.30%(+0.258)#3,034 |
| 59. | Covington | 0.56% | 0.28%(+0.278)#59 | 0.30%(+0.254)#3,060 |
| 60. | Lakeland South | 0.54% | 0.28%(+0.260)#60 | 0.30%(+0.236)#3,150 |
| 61. | Olympia | 0.54% | 0.28%(+0.259)#61 | 0.30%(+0.235)#3,154 |
| 62. | Okanogan | 0.53% | 0.28%(+0.251)#62 | 0.30%(+0.227)#3,195 |
| 63. | Orting | 0.53% | 0.28%(+0.249)#63 | 0.30%(+0.224)#3,202 |
| 64. | Belfair | 0.53% | 0.28%(+0.247)#64 | 0.30%(+0.223)#3,214 |
| 65. | Bunk Foss | 0.52% | 0.28%(+0.243)#65 | 0.30%(+0.218)#3,244 |
| 66. | Malden | 0.52% | 0.28%(+0.236)#66 | 0.30%(+0.212)#3,262 |
| 67. | Redmond | 0.51% | 0.28%(+0.228)#67 | 0.30%(+0.204)#3,305 |
| 68. | Lacrosse | 0.48% | 0.28%(+0.200)#68 | 0.30%(+0.176)#3,456 |
| 69. | Chelan | 0.47% | 0.28%(+0.189)#69 | 0.30%(+0.165)#3,529 |
| 70. | Port Angeles | 0.46% | 0.28%(+0.185)#70 | 0.30%(+0.161)#3,548 |
| 71. | Maple Valley | 0.46% | 0.28%(+0.179)#71 | 0.30%(+0.155)#3,581 |
| 72. | Brinnon | 0.46% | 0.28%(+0.178)#72 | 0.30%(+0.154)#3,588 |
| 73. | Tacoma | 0.44% | 0.28%(+0.162)#73 | 0.30%(+0.137)#3,672 |
| 74. | Renton | 0.43% | 0.28%(+0.152)#74 | 0.30%(+0.128)#3,727 |
| 75. | Lake Morton Berrydale | 0.43% | 0.28%(+0.151)#75 | 0.30%(+0.127)#3,736 |
| 76. | Graham | 0.43% | 0.28%(+0.146)#76 | 0.30%(+0.122)#3,761 |
| 77. | Orchards | 0.42% | 0.28%(+0.138)#77 | 0.30%(+0.114)#3,822 |
| 78. | Hockinson | 0.41% | 0.28%(+0.132)#78 | 0.30%(+0.108)#3,859 |
| 79. | Union Hill Novelty Hill | 0.41% | 0.28%(+0.130)#79 | 0.30%(+0.106)#3,871 |
| 80. | Shoreline | 0.40% | 0.28%(+0.123)#80 | 0.30%(+0.098)#3,933 |
| 81. | Burien | 0.40% | 0.28%(+0.122)#81 | 0.30%(+0.098)#3,938 |
| 82. | Omak | 0.39% | 0.28%(+0.110)#82 | 0.30%(+0.086)#4,026 |
| 83. | Beaux Arts Village | 0.39% | 0.28%(+0.108)#83 | 0.30%(+0.084)#4,041 |
| 84. | Milton | 0.39% | 0.28%(+0.107)#84 | 0.30%(+0.083)#4,055 |
| 85. | Entiat | 0.39% | 0.28%(+0.106)#85 | 0.30%(+0.082)#4,062 |
| 86. | Gold Bar | 0.38% | 0.28%(+0.105)#86 | 0.30%(+0.081)#4,070 |
| 87. | Aberdeen | 0.38% | 0.28%(+0.104)#87 | 0.30%(+0.079)#4,085 |
| 88. | Enetai | 0.37% | 0.28%(+0.095)#88 | 0.30%(+0.071)#4,153 |
| 89. | Barberton | 0.37% | 0.28%(+0.086)#89 | 0.30%(+0.061)#4,224 |
| 90. | Picnic Point | 0.36% | 0.28%(+0.082)#90 | 0.30%(+0.058)#4,251 |
| 91. | Prairie Heights | 0.35% | 0.28%(+0.071)#91 | 0.30%(+0.047)#4,344 |
| 92. | Maplewood | 0.34% | 0.28%(+0.065)#92 | 0.30%(+0.041)#4,403 |
| 93. | Port Orchard | 0.34% | 0.28%(+0.062)#93 | 0.30%(+0.038)#4,430 |
| 94. | Washougal | 0.34% | 0.28%(+0.059)#94 | 0.30%(+0.035)#4,457 |
| 95. | Nisqually Indian Community | 0.34% | 0.28%(+0.058)#95 | 0.30%(+0.034)#4,469 |
| 96. | Camano | 0.33% | 0.28%(+0.055)#96 | 0.30%(+0.031)#4,496 |
| 97. | Lakeland North | 0.33% | 0.28%(+0.055)#97 | 0.30%(+0.030)#4,500 |
| 98. | Manchester | 0.33% | 0.28%(+0.052)#98 | 0.30%(+0.028)#4,536 |
| 99. | East Renton Highlands | 0.33% | 0.28%(+0.052)#99 | 0.30%(+0.027)#4,542 |
| 100. | Edmonds | 0.33% | 0.28%(+0.048)#100 | 0.30%(+0.024)#4,582 |
Common Questions
What are the Top 10 Cities with the Highest Percentage of Eastern European Population in Washington?
Top 10 Cities with the Highest Percentage of Eastern European Population in Washington are:
#1
16.69%
#2
6.22%
#3
2.38%
#4
2.38%
#5
1.98%
#6
1.66%
#7
1.60%
#8
1.40%
#9
1.29%
#10
1.22%
What city has the Highest Percentage of Eastern European Population in Washington?
Onalaska has the Highest Percentage of Eastern European Population in Washington with 16.69%.
What is the Percentage of Eastern European Population in the State of Washington?
Percentage of Eastern European Population in Washington is 0.28%.
What is the Percentage of Eastern European Population in the United States?
Percentage of Eastern European Population in the United States is 0.30%.