Cities with the Highest Percentage of Population Employed in Sales & Related in Washington
RELATED REPORTS & OPTIONS
Sales & Related
Washington
Compare Cities
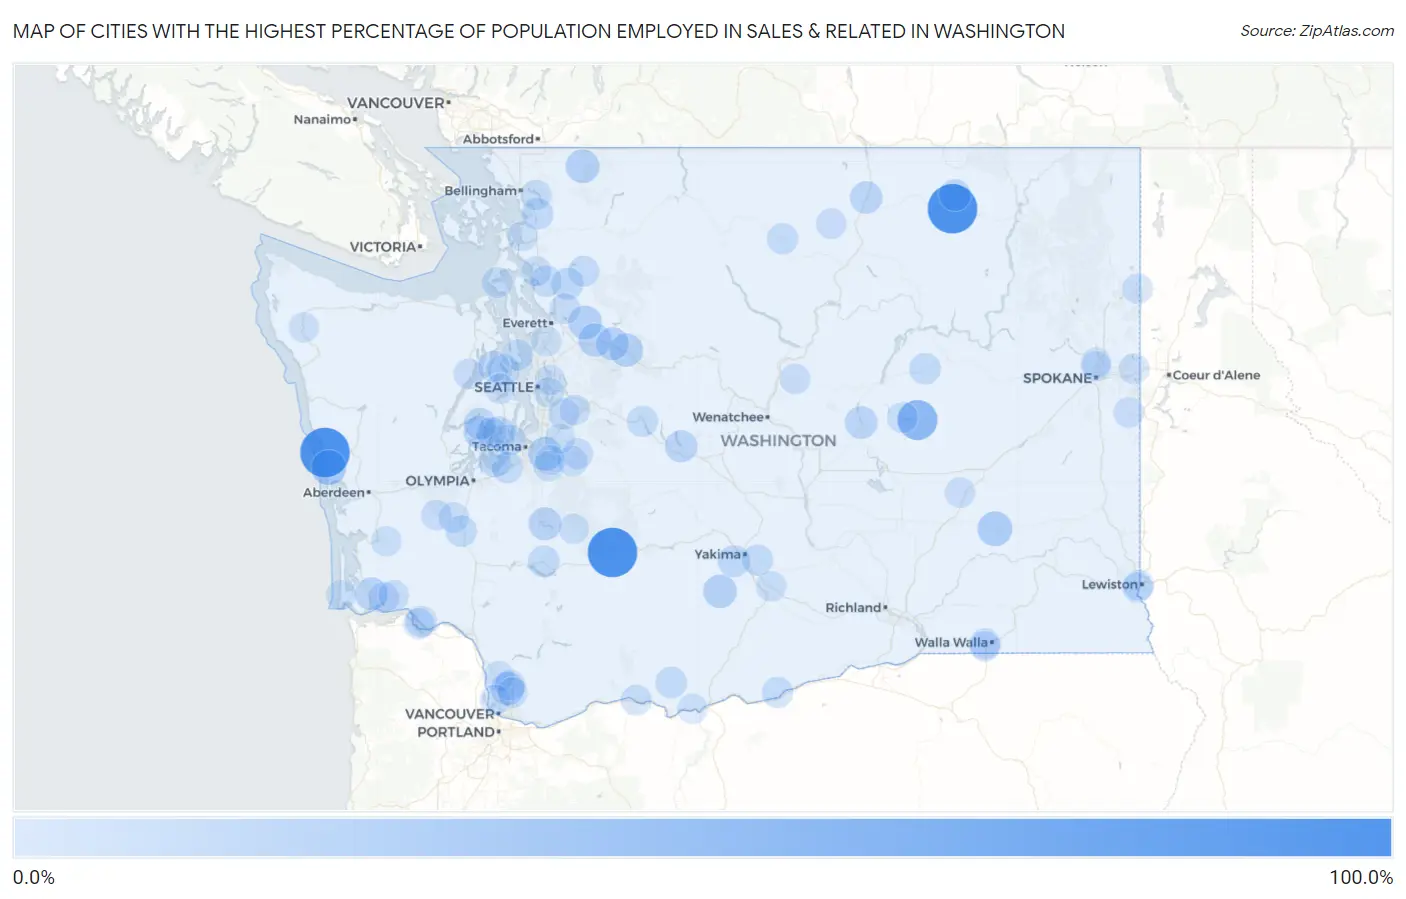
Map of Cities with the Highest Percentage of Population Employed in Sales & Related in Washington
0.0%
100.0%
Cities with the Highest Percentage of Population Employed in Sales & Related in Washington
| City | % Employed | vs State | vs National | |
| 1. | Packwood | 100.0% | 8.8%(+91.2)#1 | 9.6%(+90.4)#9 |
| 2. | Pacific Beach | 100.0% | 8.8%(+91.2)#2 | 9.6%(+90.4)#12 |
| 3. | Pine Grove | 100.0% | 8.8%(+91.2)#3 | 9.6%(+90.4)#19 |
| 4. | Krupp Marlin | 55.6% | 8.8%(+46.8)#4 | 9.6%(+46.0)#133 |
| 5. | Pataha | 35.0% | 8.8%(+26.2)#5 | 9.6%(+25.4)#424 |
| 6. | Copalis Beach | 34.1% | 8.8%(+25.3)#6 | 9.6%(+24.5)#451 |
| 7. | Washtucna | 32.6% | 8.8%(+23.8)#7 | 9.6%(+23.0)#512 |
| 8. | North Puyallup | 28.6% | 8.8%(+19.8)#8 | 9.6%(+19.0)#718 |
| 9. | Lake Roesiger | 27.8% | 8.8%(+19.0)#9 | 9.6%(+18.2)#781 |
| 10. | Glacier | 27.4% | 8.8%(+18.6)#10 | 9.6%(+17.8)#802 |
| 11. | White Swan | 27.2% | 8.8%(+18.4)#11 | 9.6%(+17.6)#820 |
| 12. | Index | 26.9% | 8.8%(+18.1)#12 | 9.6%(+17.3)#840 |
| 13. | Beverly | 26.5% | 8.8%(+17.7)#13 | 9.6%(+16.9)#873 |
| 14. | Dollars Corner | 26.3% | 8.8%(+17.5)#14 | 9.6%(+16.7)#889 |
| 15. | North Sultan | 26.2% | 8.8%(+17.4)#15 | 9.6%(+16.6)#896 |
| 16. | Alder | 25.0% | 8.8%(+16.2)#16 | 9.6%(+15.4)#999 |
| 17. | May Creek | 24.7% | 8.8%(+15.9)#17 | 9.6%(+15.1)#1,037 |
| 18. | Naselle | 24.5% | 8.8%(+15.7)#18 | 9.6%(+14.9)#1,062 |
| 19. | Soap Lake | 23.6% | 8.8%(+14.8)#19 | 9.6%(+14.0)#1,149 |
| 20. | Bow | 23.4% | 8.8%(+14.6)#20 | 9.6%(+13.8)#1,169 |
| 21. | Grapeview | 23.3% | 8.8%(+14.5)#21 | 9.6%(+13.7)#1,187 |
| 22. | Tonasket | 22.5% | 8.8%(+13.7)#22 | 9.6%(+12.9)#1,305 |
| 23. | Raft Island | 22.1% | 8.8%(+13.3)#23 | 9.6%(+12.5)#1,367 |
| 24. | Roslyn | 21.1% | 8.8%(+12.3)#24 | 9.6%(+11.5)#1,555 |
| 25. | Curlew Lake | 20.9% | 8.8%(+12.1)#25 | 9.6%(+11.3)#1,582 |
| 26. | Arlington Heights | 20.9% | 8.8%(+12.1)#26 | 9.6%(+11.3)#1,592 |
| 27. | Allyn | 20.7% | 8.8%(+11.9)#27 | 9.6%(+11.1)#1,630 |
| 28. | Ahtanum | 20.3% | 8.8%(+11.5)#28 | 9.6%(+10.7)#1,719 |
| 29. | Beacon Hill | 20.1% | 8.8%(+11.4)#29 | 9.6%(+10.6)#1,744 |
| 30. | Anderson Island | 19.7% | 8.8%(+10.9)#30 | 9.6%(+10.1)#1,869 |
| 31. | Morton | 19.1% | 8.8%(+10.3)#31 | 9.6%(+9.47)#2,036 |
| 32. | Klickitat | 19.0% | 8.8%(+10.3)#32 | 9.6%(+9.45)#2,040 |
| 33. | Keyport | 19.0% | 8.8%(+10.2)#33 | 9.6%(+9.38)#2,066 |
| 34. | Alger | 18.9% | 8.8%(+10.1)#34 | 9.6%(+9.31)#2,096 |
| 35. | Almira | 18.8% | 8.8%(+9.96)#35 | 9.6%(+9.15)#2,131 |
| 36. | Fords Prairie | 18.3% | 8.8%(+9.54)#36 | 9.6%(+8.74)#2,255 |
| 37. | Sunday Lake | 17.8% | 8.8%(+9.02)#37 | 9.6%(+8.22)#2,412 |
| 38. | North Fort Lewis | 17.7% | 8.8%(+8.93)#38 | 9.6%(+8.12)#2,442 |
| 39. | Moxee | 17.5% | 8.8%(+8.67)#39 | 9.6%(+7.87)#2,520 |
| 40. | Riverpoint | 17.2% | 8.8%(+8.45)#40 | 9.6%(+7.65)#2,610 |
| 41. | Roosevelt | 17.2% | 8.8%(+8.45)#41 | 9.6%(+7.65)#2,614 |
| 42. | Snoqualmie Pass | 17.2% | 8.8%(+8.40)#42 | 9.6%(+7.60)#2,635 |
| 43. | Kingston | 17.0% | 8.8%(+8.25)#43 | 9.6%(+7.44)#2,704 |
| 44. | Winthrop | 16.8% | 8.8%(+8.04)#44 | 9.6%(+7.24)#2,807 |
| 45. | Coupeville | 16.7% | 8.8%(+7.94)#45 | 9.6%(+7.14)#2,851 |
| 46. | Oso | 16.7% | 8.8%(+7.87)#46 | 9.6%(+7.07)#2,885 |
| 47. | Bangor Base | 16.6% | 8.8%(+7.84)#47 | 9.6%(+7.04)#2,936 |
| 48. | East Cathlamet | 16.6% | 8.8%(+7.76)#48 | 9.6%(+6.96)#2,971 |
| 49. | Wollochet | 16.4% | 8.8%(+7.60)#49 | 9.6%(+6.79)#3,044 |
| 50. | Garrett | 16.3% | 8.8%(+7.53)#50 | 9.6%(+6.73)#3,083 |
| 51. | Puget Island | 16.1% | 8.8%(+7.29)#51 | 9.6%(+6.49)#3,236 |
| 52. | Wilson Creek | 16.1% | 8.8%(+7.28)#52 | 9.6%(+6.48)#3,239 |
| 53. | Maple Heights Lake Desire | 16.0% | 8.8%(+7.23)#53 | 9.6%(+6.43)#3,272 |
| 54. | Roche Harbor | 16.0% | 8.8%(+7.17)#54 | 9.6%(+6.37)#3,317 |
| 55. | Enumclaw | 15.9% | 8.8%(+7.09)#55 | 9.6%(+6.28)#3,363 |
| 56. | Deep River | 15.8% | 8.8%(+7.00)#56 | 9.6%(+6.19)#3,422 |
| 57. | Bingen | 15.6% | 8.8%(+6.76)#57 | 9.6%(+5.96)#3,569 |
| 58. | Lake Cassidy | 15.5% | 8.8%(+6.70)#58 | 9.6%(+5.90)#3,610 |
| 59. | Sudden Valley | 15.3% | 8.8%(+6.46)#59 | 9.6%(+5.66)#3,751 |
| 60. | Oakville | 15.1% | 8.8%(+6.31)#60 | 9.6%(+5.51)#3,859 |
| 61. | La Center | 15.0% | 8.8%(+6.17)#61 | 9.6%(+5.37)#3,960 |
| 62. | Conconully | 14.9% | 8.8%(+6.13)#62 | 9.6%(+5.33)#3,990 |
| 63. | Rochester | 14.9% | 8.8%(+6.12)#63 | 9.6%(+5.32)#3,998 |
| 64. | Grays River | 14.9% | 8.8%(+6.07)#64 | 9.6%(+5.26)#4,040 |
| 65. | Kitsap Lake | 14.8% | 8.8%(+6.04)#65 | 9.6%(+5.24)#4,052 |
| 66. | Key Center | 14.8% | 8.8%(+6.04)#66 | 9.6%(+5.23)#4,057 |
| 67. | Brinnon | 14.7% | 8.8%(+5.86)#67 | 9.6%(+5.06)#4,184 |
| 68. | Otis Orchards East Farms | 14.6% | 8.8%(+5.80)#68 | 9.6%(+5.00)#4,229 |
| 69. | Mirrormont | 14.6% | 8.8%(+5.79)#69 | 9.6%(+4.98)#4,244 |
| 70. | Newport | 14.5% | 8.8%(+5.72)#70 | 9.6%(+4.92)#4,296 |
| 71. | Rockford | 14.4% | 8.8%(+5.64)#71 | 9.6%(+4.84)#4,352 |
| 72. | Waterville | 14.4% | 8.8%(+5.64)#72 | 9.6%(+4.84)#4,355 |
| 73. | Felida | 14.4% | 8.8%(+5.60)#73 | 9.6%(+4.80)#4,391 |
| 74. | Erlands Point | 14.4% | 8.8%(+5.59)#74 | 9.6%(+4.79)#4,400 |
| 75. | Cherry Grove | 14.4% | 8.8%(+5.56)#75 | 9.6%(+4.76)#4,427 |
| 76. | Meadow Glade | 14.3% | 8.8%(+5.46)#76 | 9.6%(+4.66)#4,542 |
| 77. | Lind | 14.2% | 8.8%(+5.39)#77 | 9.6%(+4.58)#4,612 |
| 78. | Rocky Point | 14.2% | 8.8%(+5.37)#78 | 9.6%(+4.57)#4,632 |
| 79. | Willapa | 14.1% | 8.8%(+5.29)#79 | 9.6%(+4.49)#4,696 |
| 80. | Mcmillin | 14.1% | 8.8%(+5.28)#80 | 9.6%(+4.48)#4,712 |
| 81. | Clarkston | 14.1% | 8.8%(+5.27)#81 | 9.6%(+4.46)#4,720 |
| 82. | College Place | 14.0% | 8.8%(+5.21)#82 | 9.6%(+4.40)#4,770 |
| 83. | West Clarkston Highland | 14.0% | 8.8%(+5.18)#83 | 9.6%(+4.38)#4,798 |
| 84. | Lake Ketchum | 13.9% | 8.8%(+5.08)#84 | 9.6%(+4.27)#4,894 |
| 85. | Ashford | 13.9% | 8.8%(+5.06)#85 | 9.6%(+4.26)#4,909 |
| 86. | Tehaleh | 13.8% | 8.8%(+5.00)#86 | 9.6%(+4.20)#4,958 |
| 87. | Buckley | 13.8% | 8.8%(+4.98)#87 | 9.6%(+4.18)#4,978 |
| 88. | Zillah | 13.8% | 8.8%(+4.97)#88 | 9.6%(+4.17)#4,984 |
| 89. | Long Beach | 13.7% | 8.8%(+4.89)#89 | 9.6%(+4.09)#5,074 |
| 90. | Yarrow Point | 13.6% | 8.8%(+4.84)#90 | 9.6%(+4.03)#5,135 |
| 91. | Lake Stickney | 13.5% | 8.8%(+4.71)#91 | 9.6%(+3.91)#5,256 |
| 92. | Forks | 13.4% | 8.8%(+4.65)#92 | 9.6%(+3.85)#5,318 |
| 93. | Crescent Bar | 13.4% | 8.8%(+4.62)#93 | 9.6%(+3.82)#5,349 |
| 94. | Wishram | 13.3% | 8.8%(+4.49)#94 | 9.6%(+3.69)#5,522 |
| 95. | Mercer Island | 13.2% | 8.8%(+4.43)#95 | 9.6%(+3.63)#5,593 |
| 96. | Country Homes | 13.2% | 8.8%(+4.41)#96 | 9.6%(+3.60)#5,622 |
| 97. | Lake Holm | 13.2% | 8.8%(+4.39)#97 | 9.6%(+3.59)#5,647 |
| 98. | Town And Country | 13.1% | 8.8%(+4.35)#98 | 9.6%(+3.54)#5,707 |
| 99. | Bay View | 13.1% | 8.8%(+4.33)#99 | 9.6%(+3.53)#5,720 |
| 100. | Alderton | 13.0% | 8.8%(+4.21)#100 | 9.6%(+3.41)#5,875 |
Common Questions
What are the Top 10 Cities with the Highest Percentage of Population Employed in Sales & Related in Washington?
Top 10 Cities with the Highest Percentage of Population Employed in Sales & Related in Washington are:
#1
100.0%
#2
100.0%
#3
100.0%
#4
55.6%
#5
34.1%
#6
32.6%
#7
28.6%
#8
27.8%
#9
27.4%
#10
27.2%
What city has the Highest Percentage of Population Employed in Sales & Related in Washington?
Packwood has the Highest Percentage of Population Employed in Sales & Related in Washington with 100.0%.
What is the Percentage of Population Employed in Sales & Related in the State of Washington?
Percentage of Population Employed in Sales & Related in Washington is 8.8%.
What is the Percentage of Population Employed in Sales & Related in the United States?
Percentage of Population Employed in Sales & Related in the United States is 9.6%.