Cities with the Most Immigrants from Indonesia in Washington
RELATED REPORTS & OPTIONS
Indonesia
Washington
Compare Cities
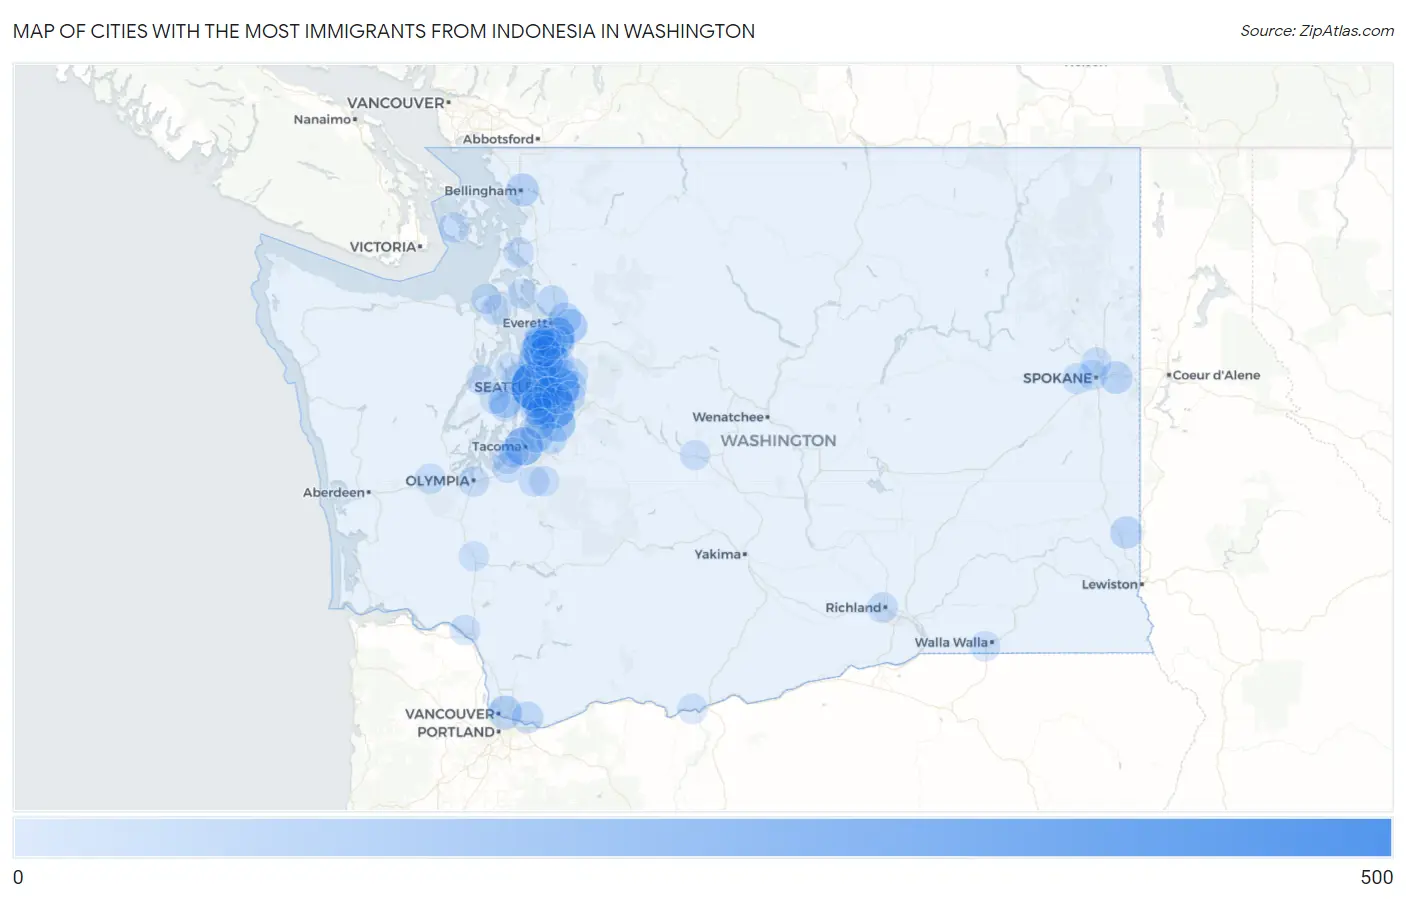
Map of Cities with the Most Immigrants from Indonesia in Washington
0
500
Cities with the Most Immigrants from Indonesia in Washington
| City | Indonesia | vs State | vs National | |
| 1. | Seattle | 479 | 3,995(11.99%)#1 | 99,615(0.48%)#22 |
| 2. | Renton | 291 | 3,995(7.28%)#2 | 99,615(0.29%)#46 |
| 3. | Bellevue | 261 | 3,995(6.53%)#3 | 99,615(0.26%)#57 |
| 4. | Eastmont | 223 | 3,995(5.58%)#4 | 99,615(0.22%)#79 |
| 5. | Tacoma | 199 | 3,995(4.98%)#5 | 99,615(0.20%)#86 |
| 6. | Lynnwood | 185 | 3,995(4.63%)#6 | 99,615(0.19%)#92 |
| 7. | Kent | 138 | 3,995(3.45%)#7 | 99,615(0.14%)#132 |
| 8. | Shoreline | 124 | 3,995(3.10%)#8 | 99,615(0.12%)#146 |
| 9. | Bothell West | 121 | 3,995(3.03%)#9 | 99,615(0.12%)#153 |
| 10. | Everett | 105 | 3,995(2.63%)#10 | 99,615(0.11%)#172 |
| 11. | Vancouver | 87 | 3,995(2.18%)#11 | 99,615(0.09%)#211 |
| 12. | Tukwila | 80 | 3,995(2.00%)#12 | 99,615(0.08%)#242 |
| 13. | East Port Orchard | 70 | 3,995(1.75%)#13 | 99,615(0.07%)#272 |
| 14. | Federal Way | 68 | 3,995(1.70%)#14 | 99,615(0.07%)#281 |
| 15. | Bellingham | 66 | 3,995(1.65%)#15 | 99,615(0.07%)#286 |
| 16. | Burien | 63 | 3,995(1.58%)#16 | 99,615(0.06%)#311 |
| 17. | Martha Lake | 59 | 3,995(1.48%)#17 | 99,615(0.06%)#324 |
| 18. | Spokane Valley | 57 | 3,995(1.43%)#18 | 99,615(0.06%)#331 |
| 19. | Silver Firs | 56 | 3,995(1.40%)#19 | 99,615(0.06%)#344 |
| 20. | Lake Stevens | 53 | 3,995(1.33%)#20 | 99,615(0.05%)#364 |
| 21. | Bothell | 51 | 3,995(1.28%)#21 | 99,615(0.05%)#376 |
| 22. | Pullman | 51 | 3,995(1.28%)#22 | 99,615(0.05%)#379 |
| 23. | Mountlake Terrace | 49 | 3,995(1.23%)#23 | 99,615(0.05%)#389 |
| 24. | Kirkland | 42 | 3,995(1.05%)#24 | 99,615(0.04%)#449 |
| 25. | Marysville | 40 | 3,995(1.00%)#25 | 99,615(0.04%)#470 |
| 26. | Camas | 40 | 3,995(1.00%)#26 | 99,615(0.04%)#472 |
| 27. | Seatac | 39 | 3,995(0.98%)#27 | 99,615(0.04%)#476 |
| 28. | Meadowdale | 38 | 3,995(0.95%)#28 | 99,615(0.04%)#485 |
| 29. | Mercer Island | 31 | 3,995(0.78%)#29 | 99,615(0.03%)#558 |
| 30. | Union Hill Novelty Hill | 31 | 3,995(0.78%)#30 | 99,615(0.03%)#559 |
| 31. | Picnic Point | 30 | 3,995(0.75%)#31 | 99,615(0.03%)#577 |
| 32. | North Lynnwood | 29 | 3,995(0.73%)#32 | 99,615(0.03%)#586 |
| 33. | Auburn | 28 | 3,995(0.70%)#33 | 99,615(0.03%)#591 |
| 34. | Edmonds | 26 | 3,995(0.65%)#34 | 99,615(0.03%)#619 |
| 35. | Sammamish | 22 | 3,995(0.55%)#35 | 99,615(0.02%)#691 |
| 36. | White Center | 20 | 3,995(0.50%)#36 | 99,615(0.02%)#742 |
| 37. | Airway Heights | 20 | 3,995(0.50%)#37 | 99,615(0.02%)#745 |
| 38. | Bethel | 19 | 3,995(0.48%)#38 | 99,615(0.02%)#773 |
| 39. | Olympia | 18 | 3,995(0.45%)#39 | 99,615(0.02%)#776 |
| 40. | Bainbridge Island | 18 | 3,995(0.45%)#40 | 99,615(0.02%)#783 |
| 41. | Redmond | 17 | 3,995(0.43%)#41 | 99,615(0.02%)#802 |
| 42. | North Fort Lewis | 17 | 3,995(0.43%)#42 | 99,615(0.02%)#820 |
| 43. | Des Moines | 15 | 3,995(0.38%)#43 | 99,615(0.02%)#868 |
| 44. | Mill Creek | 15 | 3,995(0.38%)#44 | 99,615(0.02%)#874 |
| 45. | Lake Stickney | 15 | 3,995(0.38%)#45 | 99,615(0.02%)#876 |
| 46. | Woodinville | 15 | 3,995(0.38%)#46 | 99,615(0.02%)#877 |
| 47. | Issaquah | 14 | 3,995(0.35%)#47 | 99,615(0.01%)#905 |
| 48. | Richland | 13 | 3,995(0.33%)#48 | 99,615(0.01%)#931 |
| 49. | Bremerton | 12 | 3,995(0.30%)#49 | 99,615(0.01%)#964 |
| 50. | Kenmore | 12 | 3,995(0.30%)#50 | 99,615(0.01%)#971 |
| 51. | Mccleary | 12 | 3,995(0.30%)#51 | 99,615(0.01%)#988 |
| 52. | Spokane | 11 | 3,995(0.28%)#52 | 99,615(0.01%)#991 |
| 53. | Longview | 11 | 3,995(0.28%)#53 | 99,615(0.01%)#1,006 |
| 54. | Elk Plain | 11 | 3,995(0.28%)#54 | 99,615(0.01%)#1,022 |
| 55. | Alderwood Manor | 11 | 3,995(0.28%)#55 | 99,615(0.01%)#1,025 |
| 56. | Marrowstone | 11 | 3,995(0.28%)#56 | 99,615(0.01%)#1,035 |
| 57. | Camano | 9 | 3,995(0.23%)#57 | 99,615(0.01%)#1,118 |
| 58. | College Place | 9 | 3,995(0.23%)#58 | 99,615(0.01%)#1,130 |
| 59. | Steilacoom | 9 | 3,995(0.23%)#59 | 99,615(0.01%)#1,133 |
| 60. | Mukilteo | 8 | 3,995(0.20%)#60 | 99,615(0.01%)#1,179 |
| 61. | Country Homes | 8 | 3,995(0.20%)#61 | 99,615(0.01%)#1,189 |
| 62. | Seabeck | 8 | 3,995(0.20%)#62 | 99,615(0.01%)#1,197 |
| 63. | Newcastle | 7 | 3,995(0.18%)#63 | 99,615(0.01%)#1,230 |
| 64. | Friday Harbor | 7 | 3,995(0.18%)#64 | 99,615(0.01%)#1,243 |
| 65. | Graham | 6 | 3,995(0.15%)#65 | 99,615(0.01%)#1,258 |
| 66. | University Place | 5 | 3,995(0.13%)#66 | 99,615(0.01%)#1,311 |
| 67. | Port Townsend | 5 | 3,995(0.13%)#67 | 99,615(0.01%)#1,323 |
| 68. | Cle Elum | 4 | 3,995(0.10%)#68 | 99,615(0.00%)#1,368 |
| 69. | La Conner | 4 | 3,995(0.10%)#69 | 99,615(0.00%)#1,380 |
| 70. | Suquamish | 3 | 3,995(0.08%)#70 | 99,615(0.00%)#1,397 |
| 71. | Wishram | 3 | 3,995(0.08%)#71 | 99,615(0.00%)#1,417 |
| 72. | Napavine | 1 | 3,995(0.03%)#72 | 99,615(0.00%)#1,480 |
Common Questions
What are the Top 10 Cities with the Most Immigrants from Indonesia in Washington?
Top 10 Cities with the Most Immigrants from Indonesia in Washington are:
What city has the Most Immigrants from Indonesia in Washington?
Seattle has the Most Immigrants from Indonesia in Washington with 479.
What is the Total Immigrants from Indonesia in the State of Washington?
Total Immigrants from Indonesia in Washington is 3,995.
What is the Total Immigrants from Indonesia in the United States?
Total Immigrants from Indonesia in the United States is 99,615.