Cities with the Highest Wage/Income Gap (%) in Washington
RELATED REPORTS & OPTIONS
Highest Wage/Income Gap (%)
Washington
Compare Cities
Map of Cities with the Highest Wage/Income Gap (%) in Washington
0.0%
100.0%
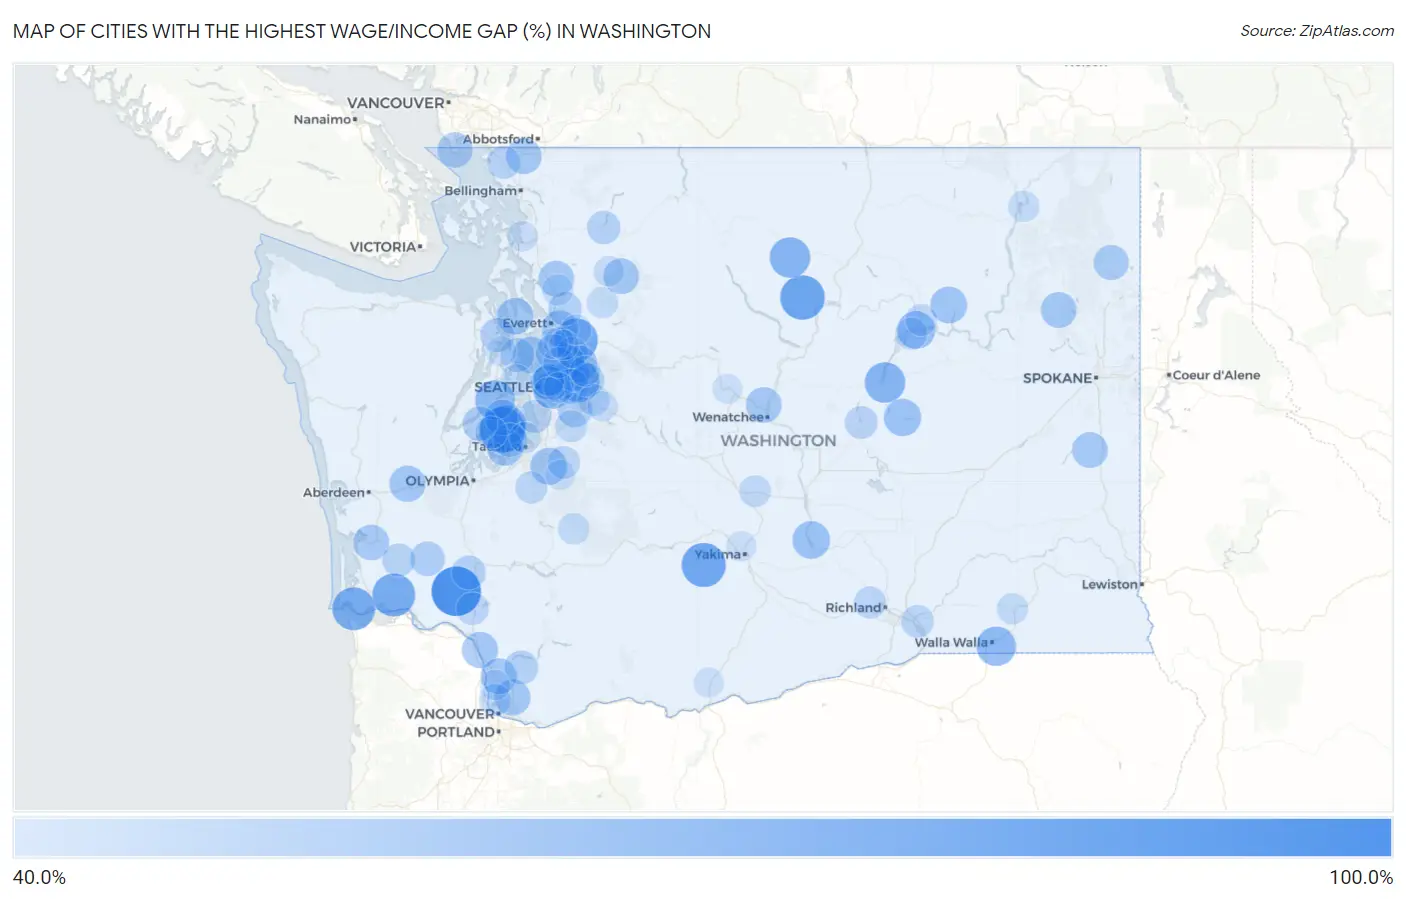
Cities with the Highest Wage/Income Gap (%) in Washington
| City | Wage/Income Gap (%) | vs State | vs National | |
| 1. | Ryderwood | 88.3% | 30.9%(+0.574)#1 | 28.0%(+0.603)#91 |
| 2. | Rosedale | 80.1% | 30.9%(+0.492)#2 | 28.0%(+0.522)#187 |
| 3. | Methow | 77.9% | 30.9%(+0.470)#3 | 28.0%(+0.499)#221 |
| 4. | Tampico | 76.9% | 30.9%(+0.459)#4 | 28.0%(+0.489)#248 |
| 5. | Monroe North | 74.7% | 30.9%(+0.438)#5 | 28.0%(+0.467)#296 |
| 6. | Grays River | 74.5% | 30.9%(+0.436)#6 | 28.0%(+0.466)#300 |
| 7. | Chinook | 74.3% | 30.9%(+0.433)#7 | 28.0%(+0.463)#307 |
| 8. | Ames Lake | 72.2% | 30.9%(+0.413)#8 | 28.0%(+0.442)#408 |
| 9. | Banks Lake South | 69.5% | 30.9%(+0.385)#9 | 28.0%(+0.415)#541 |
| 10. | Twisp | 69.4% | 30.9%(+0.385)#10 | 28.0%(+0.414)#547 |
| 11. | Canterwood | 67.5% | 30.9%(+0.366)#11 | 28.0%(+0.396)#682 |
| 12. | Gorst | 67.4% | 30.9%(+0.365)#12 | 28.0%(+0.394)#692 |
| 13. | Walla Walla East | 67.0% | 30.9%(+0.361)#13 | 28.0%(+0.390)#721 |
| 14. | Clear Lake Cdp Skagit County | 65.3% | 30.9%(+0.344)#14 | 28.0%(+0.373)#855 |
| 15. | Clyde Hill | 65.0% | 30.9%(+0.341)#15 | 28.0%(+0.370)#888 |
| 16. | Grand Coulee | 64.2% | 30.9%(+0.332)#16 | 28.0%(+0.362)#955 |
| 17. | Beaux Arts Village | 63.9% | 30.9%(+0.330)#17 | 28.0%(+0.359)#986 |
| 18. | Desert Aire | 63.4% | 30.9%(+0.324)#18 | 28.0%(+0.354)#1,061 |
| 19. | Wilson Creek | 62.8% | 30.9%(+0.319)#19 | 28.0%(+0.348)#1,116 |
| 20. | Duvall | 62.5% | 30.9%(+0.316)#20 | 28.0%(+0.345)#1,148 |
| 21. | Cottage Lake | 62.4% | 30.9%(+0.314)#21 | 28.0%(+0.344)#1,166 |
| 22. | Mcmillin | 61.8% | 30.9%(+0.309)#22 | 28.0%(+0.338)#1,222 |
| 23. | Woodway | 61.7% | 30.9%(+0.308)#23 | 28.0%(+0.337)#1,244 |
| 24. | Keller | 61.4% | 30.9%(+0.305)#24 | 28.0%(+0.334)#1,281 |
| 25. | Fobes Hill | 61.1% | 30.9%(+0.302)#25 | 28.0%(+0.332)#1,307 |
| 26. | Fox Island | 61.1% | 30.9%(+0.302)#26 | 28.0%(+0.331)#1,314 |
| 27. | Freeland | 60.9% | 30.9%(+0.300)#27 | 28.0%(+0.330)#1,323 |
| 28. | Bothell East | 60.7% | 30.9%(+0.298)#28 | 28.0%(+0.327)#1,346 |
| 29. | Satsop | 60.7% | 30.9%(+0.298)#29 | 28.0%(+0.327)#1,348 |
| 30. | Kalama | 60.3% | 30.9%(+0.294)#30 | 28.0%(+0.323)#1,393 |
| 31. | Brush Prairie | 60.2% | 30.9%(+0.292)#31 | 28.0%(+0.322)#1,408 |
| 32. | La Center | 59.9% | 30.9%(+0.290)#32 | 28.0%(+0.319)#1,437 |
| 33. | Bryant | 59.9% | 30.9%(+0.289)#33 | 28.0%(+0.319)#1,444 |
| 34. | Sunnyslope | 59.7% | 30.9%(+0.288)#34 | 28.0%(+0.318)#1,458 |
| 35. | Lynden | 59.6% | 30.9%(+0.287)#35 | 28.0%(+0.317)#1,475 |
| 36. | Darrington | 59.6% | 30.9%(+0.287)#36 | 28.0%(+0.317)#1,477 |
| 37. | Malden | 59.4% | 30.9%(+0.285)#37 | 28.0%(+0.315)#1,511 |
| 38. | Burley | 59.4% | 30.9%(+0.285)#38 | 28.0%(+0.314)#1,514 |
| 39. | Springdale | 59.4% | 30.9%(+0.285)#39 | 28.0%(+0.314)#1,517 |
| 40. | South Bend | 59.3% | 30.9%(+0.283)#40 | 28.0%(+0.313)#1,542 |
| 41. | Point Roberts | 58.9% | 30.9%(+0.279)#41 | 28.0%(+0.309)#1,614 |
| 42. | Kitsap Lake | 58.4% | 30.9%(+0.274)#42 | 28.0%(+0.304)#1,682 |
| 43. | Cusick | 58.3% | 30.9%(+0.273)#43 | 28.0%(+0.303)#1,695 |
| 44. | Union Hill Novelty Hill | 57.8% | 30.9%(+0.268)#44 | 28.0%(+0.298)#1,776 |
| 45. | Sammamish | 57.4% | 30.9%(+0.264)#45 | 28.0%(+0.294)#1,845 |
| 46. | Mirrormont | 57.3% | 30.9%(+0.264)#46 | 28.0%(+0.294)#1,850 |
| 47. | Allyn | 57.1% | 30.9%(+0.261)#47 | 28.0%(+0.291)#1,893 |
| 48. | Pe Ell | 57.0% | 30.9%(+0.261)#48 | 28.0%(+0.291)#1,897 |
| 49. | Port Ludlow | 56.6% | 30.9%(+0.256)#49 | 28.0%(+0.286)#1,989 |
| 50. | Yarrow Point | 56.0% | 30.9%(+0.251)#50 | 28.0%(+0.280)#2,101 |
| 51. | Amboy | 55.9% | 30.9%(+0.250)#51 | 28.0%(+0.280)#2,116 |
| 52. | Kingston | 55.9% | 30.9%(+0.250)#52 | 28.0%(+0.279)#2,121 |
| 53. | Winlock | 55.9% | 30.9%(+0.250)#53 | 28.0%(+0.279)#2,123 |
| 54. | Wollochet | 55.7% | 30.9%(+0.248)#54 | 28.0%(+0.278)#2,156 |
| 55. | Lake Cassidy | 55.7% | 30.9%(+0.248)#55 | 28.0%(+0.277)#2,162 |
| 56. | Carnation | 55.3% | 30.9%(+0.244)#56 | 28.0%(+0.273)#2,240 |
| 57. | Medina | 55.0% | 30.9%(+0.240)#57 | 28.0%(+0.270)#2,299 |
| 58. | Concrete | 54.8% | 30.9%(+0.238)#58 | 28.0%(+0.268)#2,341 |
| 59. | Custer | 54.4% | 30.9%(+0.235)#59 | 28.0%(+0.265)#2,413 |
| 60. | Lebam | 54.4% | 30.9%(+0.235)#60 | 28.0%(+0.264)#2,428 |
| 61. | Normandy Park | 54.3% | 30.9%(+0.234)#61 | 28.0%(+0.264)#2,443 |
| 62. | Soap Lake | 53.7% | 30.9%(+0.228)#62 | 28.0%(+0.257)#2,591 |
| 63. | Burbank | 53.4% | 30.9%(+0.224)#63 | 28.0%(+0.254)#2,650 |
| 64. | Castle Rock | 53.3% | 30.9%(+0.224)#64 | 28.0%(+0.254)#2,651 |
| 65. | Prairie Heights | 53.1% | 30.9%(+0.221)#65 | 28.0%(+0.251)#2,714 |
| 66. | West Richland | 52.7% | 30.9%(+0.218)#66 | 28.0%(+0.248)#2,791 |
| 67. | Key Center | 52.6% | 30.9%(+0.217)#67 | 28.0%(+0.247)#2,812 |
| 68. | South Creek | 52.4% | 30.9%(+0.214)#68 | 28.0%(+0.244)#2,884 |
| 69. | Electric City | 52.3% | 30.9%(+0.214)#69 | 28.0%(+0.243)#2,895 |
| 70. | Felida | 52.2% | 30.9%(+0.213)#70 | 28.0%(+0.242)#2,920 |
| 71. | Maple Valley | 51.8% | 30.9%(+0.209)#71 | 28.0%(+0.239)#3,021 |
| 72. | Elmer City | 51.8% | 30.9%(+0.208)#72 | 28.0%(+0.238)#3,034 |
| 73. | Snoqualmie | 51.6% | 30.9%(+0.207)#73 | 28.0%(+0.236)#3,070 |
| 74. | Kittitas | 51.5% | 30.9%(+0.206)#74 | 28.0%(+0.235)#3,087 |
| 75. | Bainbridge Island | 51.4% | 30.9%(+0.205)#75 | 28.0%(+0.234)#3,121 |
| 76. | Hunts Point | 51.1% | 30.9%(+0.201)#76 | 28.0%(+0.231)#3,205 |
| 77. | Ashford | 51.0% | 30.9%(+0.201)#77 | 28.0%(+0.230)#3,225 |
| 78. | Waitsburg | 50.9% | 30.9%(+0.199)#78 | 28.0%(+0.229)#3,255 |
| 79. | Verlot | 50.6% | 30.9%(+0.197)#79 | 28.0%(+0.227)#3,309 |
| 80. | Arlington | 50.6% | 30.9%(+0.197)#80 | 28.0%(+0.226)#3,327 |
| 81. | Marcus | 50.5% | 30.9%(+0.196)#81 | 28.0%(+0.226)#3,334 |
| 82. | Browns Point | 50.4% | 30.9%(+0.194)#82 | 28.0%(+0.224)#3,388 |
| 83. | Woodinville | 50.3% | 30.9%(+0.193)#83 | 28.0%(+0.223)#3,418 |
| 84. | High Bridge | 50.1% | 30.9%(+0.192)#84 | 28.0%(+0.221)#3,464 |
| 85. | Lake Marcel Stillwater | 49.5% | 30.9%(+0.186)#85 | 28.0%(+0.215)#3,623 |
| 86. | Swede Heaven | 49.5% | 30.9%(+0.185)#86 | 28.0%(+0.215)#3,630 |
| 87. | Mercer Island | 49.3% | 30.9%(+0.184)#87 | 28.0%(+0.213)#3,680 |
| 88. | Ridgefield | 49.2% | 30.9%(+0.183)#88 | 28.0%(+0.212)#3,712 |
| 89. | Bay View | 49.2% | 30.9%(+0.182)#89 | 28.0%(+0.212)#3,732 |
| 90. | Three Lakes | 49.1% | 30.9%(+0.182)#90 | 28.0%(+0.211)#3,746 |
| 91. | North Bend | 49.1% | 30.9%(+0.182)#91 | 28.0%(+0.211)#3,752 |
| 92. | Silver Firs | 48.7% | 30.9%(+0.178)#92 | 28.0%(+0.207)#3,872 |
| 93. | Mill Creek | 48.7% | 30.9%(+0.178)#93 | 28.0%(+0.207)#3,876 |
| 94. | Bellevue | 48.7% | 30.9%(+0.177)#94 | 28.0%(+0.207)#3,884 |
| 95. | Selah | 48.7% | 30.9%(+0.177)#95 | 28.0%(+0.207)#3,891 |
| 96. | Crocker | 48.6% | 30.9%(+0.177)#96 | 28.0%(+0.206)#3,903 |
| 97. | Lofall | 48.6% | 30.9%(+0.176)#97 | 28.0%(+0.206)#3,911 |
| 98. | Leavenworth | 48.6% | 30.9%(+0.176)#98 | 28.0%(+0.206)#3,914 |
| 99. | Goldendale | 48.5% | 30.9%(+0.176)#99 | 28.0%(+0.205)#3,937 |
| 100. | Cathcart | 48.4% | 30.9%(+0.175)#100 | 28.0%(+0.205)#3,957 |
Common Questions
What are the Top 10 Cities with the Highest Wage/Income Gap (%) in Washington?
Top 10 Cities with the Highest Wage/Income Gap (%) in Washington are:
#1
88.3%
#2
80.1%
#3
77.9%
#4
76.9%
#5
74.7%
#6
74.5%
#7
74.3%
#8
72.2%
#9
69.5%
#10
69.4%
What city has the Highest Wage/Income Gap (%) in Washington?
Ryderwood has the Highest Wage/Income Gap (%) in Washington with 88.3%.
What is the Wage / Income Gap in Percentage Terms in the State of Washington?
Wage / Income Gap in Percentage Terms in Washington is 30.9%.
What is the Wage / Income Gap in Percentage Terms in the United States?
Wage / Income Gap in Percentage Terms in the United States is 28.0%.