Cities with the Most Immigrants from Romania in Washington
RELATED REPORTS & OPTIONS
Romania
Washington
Compare Cities
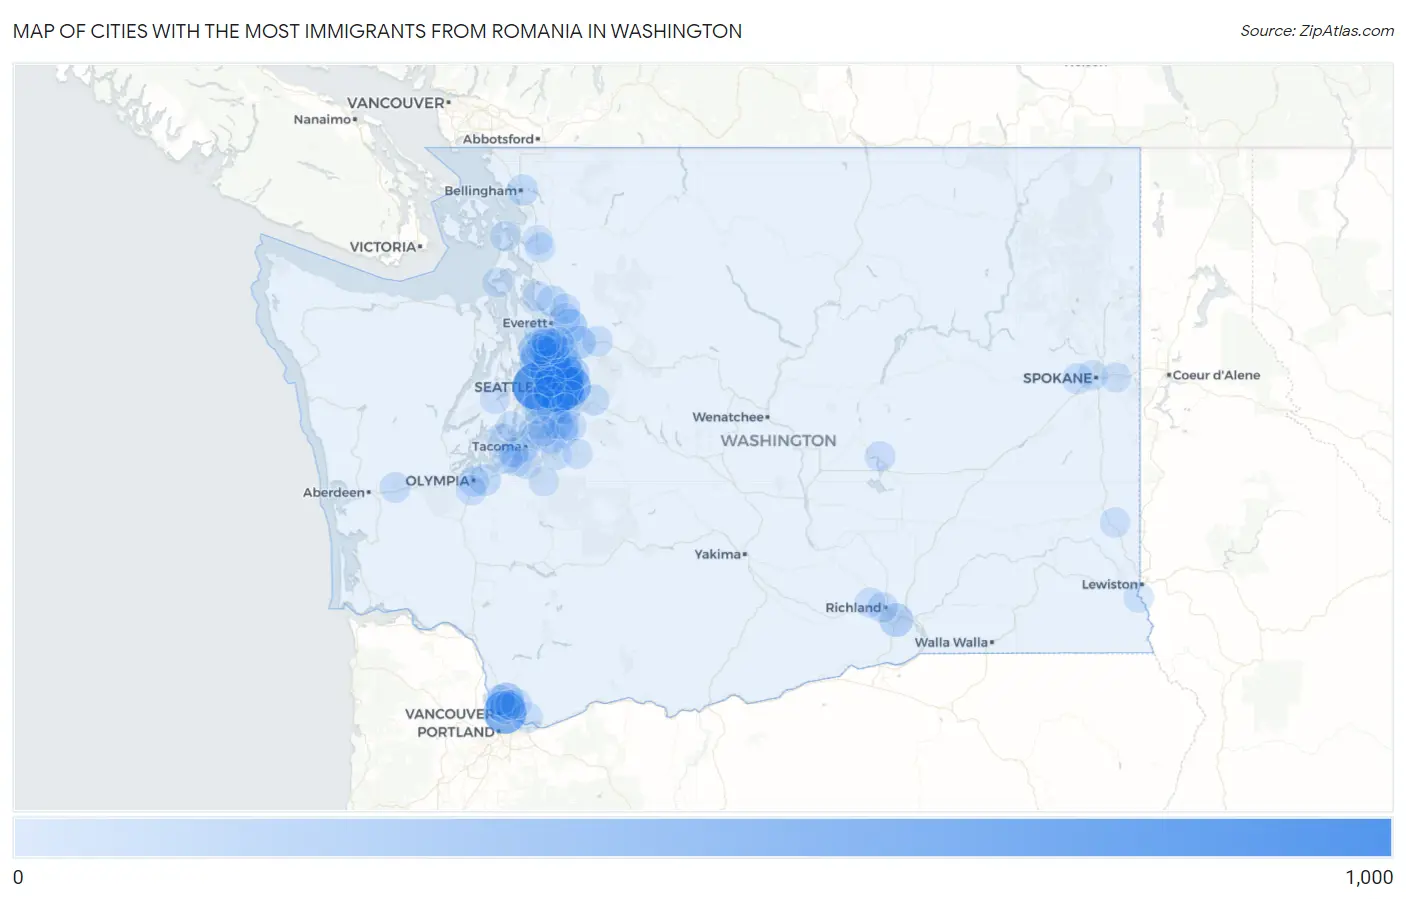
Map of Cities with the Most Immigrants from Romania in Washington
0
1,000
Cities with the Most Immigrants from Romania in Washington
| City | Romania | vs State | vs National | |
| 1. | Bellevue | 857 | 7,568(11.32%)#1 | 164,406(0.52%)#7 |
| 2. | Seattle | 738 | 7,568(9.75%)#2 | 164,406(0.45%)#14 |
| 3. | Vancouver | 546 | 7,568(7.21%)#3 | 164,406(0.33%)#21 |
| 4. | Kirkland | 526 | 7,568(6.95%)#4 | 164,406(0.32%)#23 |
| 5. | Redmond | 428 | 7,568(5.66%)#5 | 164,406(0.26%)#34 |
| 6. | Sammamish | 393 | 7,568(5.19%)#6 | 164,406(0.24%)#37 |
| 7. | Bothell | 240 | 7,568(3.17%)#7 | 164,406(0.15%)#84 |
| 8. | Barberton | 201 | 7,568(2.66%)#8 | 164,406(0.12%)#104 |
| 9. | Everett | 178 | 7,568(2.35%)#9 | 164,406(0.11%)#121 |
| 10. | Renton | 160 | 7,568(2.11%)#10 | 164,406(0.10%)#132 |
| 11. | Edmonds | 157 | 7,568(2.07%)#11 | 164,406(0.10%)#137 |
| 12. | Union Hill Novelty Hill | 157 | 7,568(2.07%)#12 | 164,406(0.10%)#138 |
| 13. | Shoreline | 156 | 7,568(2.06%)#13 | 164,406(0.09%)#139 |
| 14. | Monroe | 151 | 7,568(2.00%)#14 | 164,406(0.09%)#145 |
| 15. | Kennewick | 150 | 7,568(1.98%)#15 | 164,406(0.09%)#146 |
| 16. | Martha Lake | 119 | 7,568(1.57%)#16 | 164,406(0.07%)#208 |
| 17. | Bothell West | 99 | 7,568(1.31%)#17 | 164,406(0.06%)#257 |
| 18. | Newcastle | 92 | 7,568(1.22%)#18 | 164,406(0.06%)#285 |
| 19. | Maltby | 77 | 7,568(1.02%)#19 | 164,406(0.05%)#345 |
| 20. | North Lynnwood | 72 | 7,568(0.95%)#20 | 164,406(0.04%)#371 |
| 21. | Boulevard Park | 68 | 7,568(0.90%)#21 | 164,406(0.04%)#398 |
| 22. | Esperance | 67 | 7,568(0.89%)#22 | 164,406(0.04%)#410 |
| 23. | Mercer Island | 60 | 7,568(0.79%)#23 | 164,406(0.04%)#453 |
| 24. | Lacey | 58 | 7,568(0.77%)#24 | 164,406(0.04%)#465 |
| 25. | Cottage Lake | 57 | 7,568(0.75%)#25 | 164,406(0.03%)#477 |
| 26. | Marysville | 56 | 7,568(0.74%)#26 | 164,406(0.03%)#482 |
| 27. | Mill Creek East | 53 | 7,568(0.70%)#27 | 164,406(0.03%)#508 |
| 28. | Lake Morton Berrydale | 53 | 7,568(0.70%)#28 | 164,406(0.03%)#509 |
| 29. | Hazel Dell | 52 | 7,568(0.69%)#29 | 164,406(0.03%)#521 |
| 30. | Lake Stevens | 50 | 7,568(0.66%)#30 | 164,406(0.03%)#546 |
| 31. | Bellingham | 47 | 7,568(0.62%)#31 | 164,406(0.03%)#580 |
| 32. | Tacoma | 43 | 7,568(0.57%)#32 | 164,406(0.03%)#627 |
| 33. | Issaquah | 42 | 7,568(0.55%)#33 | 164,406(0.03%)#646 |
| 34. | Silver Firs | 41 | 7,568(0.54%)#34 | 164,406(0.02%)#669 |
| 35. | Mukilteo | 41 | 7,568(0.54%)#35 | 164,406(0.02%)#670 |
| 36. | Kent | 39 | 7,568(0.52%)#36 | 164,406(0.02%)#690 |
| 37. | Snoqualmie | 38 | 7,568(0.50%)#37 | 164,406(0.02%)#720 |
| 38. | Minnehaha | 37 | 7,568(0.49%)#38 | 164,406(0.02%)#741 |
| 39. | East Renton Highlands | 35 | 7,568(0.46%)#39 | 164,406(0.02%)#785 |
| 40. | Olympia | 33 | 7,568(0.44%)#40 | 164,406(0.02%)#805 |
| 41. | Auburn | 30 | 7,568(0.40%)#41 | 164,406(0.02%)#865 |
| 42. | Des Moines | 30 | 7,568(0.40%)#42 | 164,406(0.02%)#874 |
| 43. | Salmon Creek | 28 | 7,568(0.37%)#43 | 164,406(0.02%)#929 |
| 44. | Artondale | 28 | 7,568(0.37%)#44 | 164,406(0.02%)#933 |
| 45. | Airway Heights | 28 | 7,568(0.37%)#45 | 164,406(0.02%)#936 |
| 46. | Alderwood Manor | 28 | 7,568(0.37%)#46 | 164,406(0.02%)#937 |
| 47. | Federal Way | 27 | 7,568(0.36%)#47 | 164,406(0.02%)#946 |
| 48. | Camas | 26 | 7,568(0.34%)#48 | 164,406(0.02%)#983 |
| 49. | Montesano | 26 | 7,568(0.34%)#49 | 164,406(0.02%)#998 |
| 50. | Orchards | 25 | 7,568(0.33%)#50 | 164,406(0.02%)#1,013 |
| 51. | Lynnwood | 24 | 7,568(0.32%)#51 | 164,406(0.01%)#1,038 |
| 52. | Sultan | 24 | 7,568(0.32%)#52 | 164,406(0.01%)#1,051 |
| 53. | Richland | 23 | 7,568(0.30%)#53 | 164,406(0.01%)#1,058 |
| 54. | Lake Cassidy | 21 | 7,568(0.28%)#54 | 164,406(0.01%)#1,143 |
| 55. | Fairwood Cdp King County | 20 | 7,568(0.26%)#55 | 164,406(0.01%)#1,159 |
| 56. | Clyde Hill | 18 | 7,568(0.24%)#56 | 164,406(0.01%)#1,260 |
| 57. | Tumwater | 16 | 7,568(0.21%)#57 | 164,406(0.01%)#1,329 |
| 58. | Lakewood | 15 | 7,568(0.20%)#58 | 164,406(0.01%)#1,373 |
| 59. | Suncrest | 15 | 7,568(0.20%)#59 | 164,406(0.01%)#1,399 |
| 60. | Spokane | 14 | 7,568(0.18%)#60 | 164,406(0.01%)#1,407 |
| 61. | Covington | 14 | 7,568(0.18%)#61 | 164,406(0.01%)#1,424 |
| 62. | Parkland | 13 | 7,568(0.17%)#62 | 164,406(0.01%)#1,455 |
| 63. | Kayak Point | 13 | 7,568(0.17%)#63 | 164,406(0.01%)#1,492 |
| 64. | Moses Lake North | 12 | 7,568(0.16%)#64 | 164,406(0.01%)#1,529 |
| 65. | Bremerton | 11 | 7,568(0.15%)#65 | 164,406(0.01%)#1,554 |
| 66. | Five Corners | 11 | 7,568(0.15%)#66 | 164,406(0.01%)#1,570 |
| 67. | Burien | 10 | 7,568(0.13%)#67 | 164,406(0.01%)#1,622 |
| 68. | University Place | 10 | 7,568(0.13%)#68 | 164,406(0.01%)#1,629 |
| 69. | Mill Creek | 9 | 7,568(0.12%)#69 | 164,406(0.01%)#1,706 |
| 70. | Maple Valley | 8 | 7,568(0.11%)#70 | 164,406(0.00%)#1,761 |
| 71. | Bonney Lake | 8 | 7,568(0.11%)#71 | 164,406(0.00%)#1,765 |
| 72. | West Richland | 8 | 7,568(0.11%)#72 | 164,406(0.00%)#1,772 |
| 73. | Lakeland North | 8 | 7,568(0.11%)#73 | 164,406(0.00%)#1,774 |
| 74. | Steilacoom | 8 | 7,568(0.11%)#74 | 164,406(0.00%)#1,790 |
| 75. | Maplewood | 8 | 7,568(0.11%)#75 | 164,406(0.00%)#1,794 |
| 76. | Albion | 7 | 7,568(0.09%)#76 | 164,406(0.00%)#1,876 |
| 77. | Asotin | 5 | 7,568(0.07%)#77 | 164,406(0.00%)#1,983 |
| 78. | Spokane Valley | 3 | 7,568(0.04%)#78 | 164,406(0.00%)#2,029 |
| 79. | Anacortes | 3 | 7,568(0.04%)#79 | 164,406(0.00%)#2,037 |
| 80. | Coupeville | 3 | 7,568(0.04%)#80 | 164,406(0.00%)#2,045 |
| 81. | Lake Stickney | 2 | 7,568(0.03%)#81 | 164,406(0.00%)#2,072 |
| 82. | Burlington | 2 | 7,568(0.03%)#82 | 164,406(0.00%)#2,077 |
| 83. | Mount Vernon | 1 | 7,568(0.01%)#83 | 164,406(0.00%)#2,118 |
| 84. | Graham | 1 | 7,568(0.01%)#84 | 164,406(0.00%)#2,119 |
| 85. | Enumclaw | 1 | 7,568(0.01%)#85 | 164,406(0.00%)#2,122 |
Common Questions
What are the Top 10 Cities with the Most Immigrants from Romania in Washington?
Top 10 Cities with the Most Immigrants from Romania in Washington are:
What city has the Most Immigrants from Romania in Washington?
Bellevue has the Most Immigrants from Romania in Washington with 857.
What is the Total Immigrants from Romania in the State of Washington?
Total Immigrants from Romania in Washington is 7,568.
What is the Total Immigrants from Romania in the United States?
Total Immigrants from Romania in the United States is 164,406.