Zip Codes with the Highest Percentage of Population Employed in Architecture & Engineering in Tacoma, WA
RELATED REPORTS & OPTIONS
Architecture & Engineering
Tacoma
Compare Zip Codes
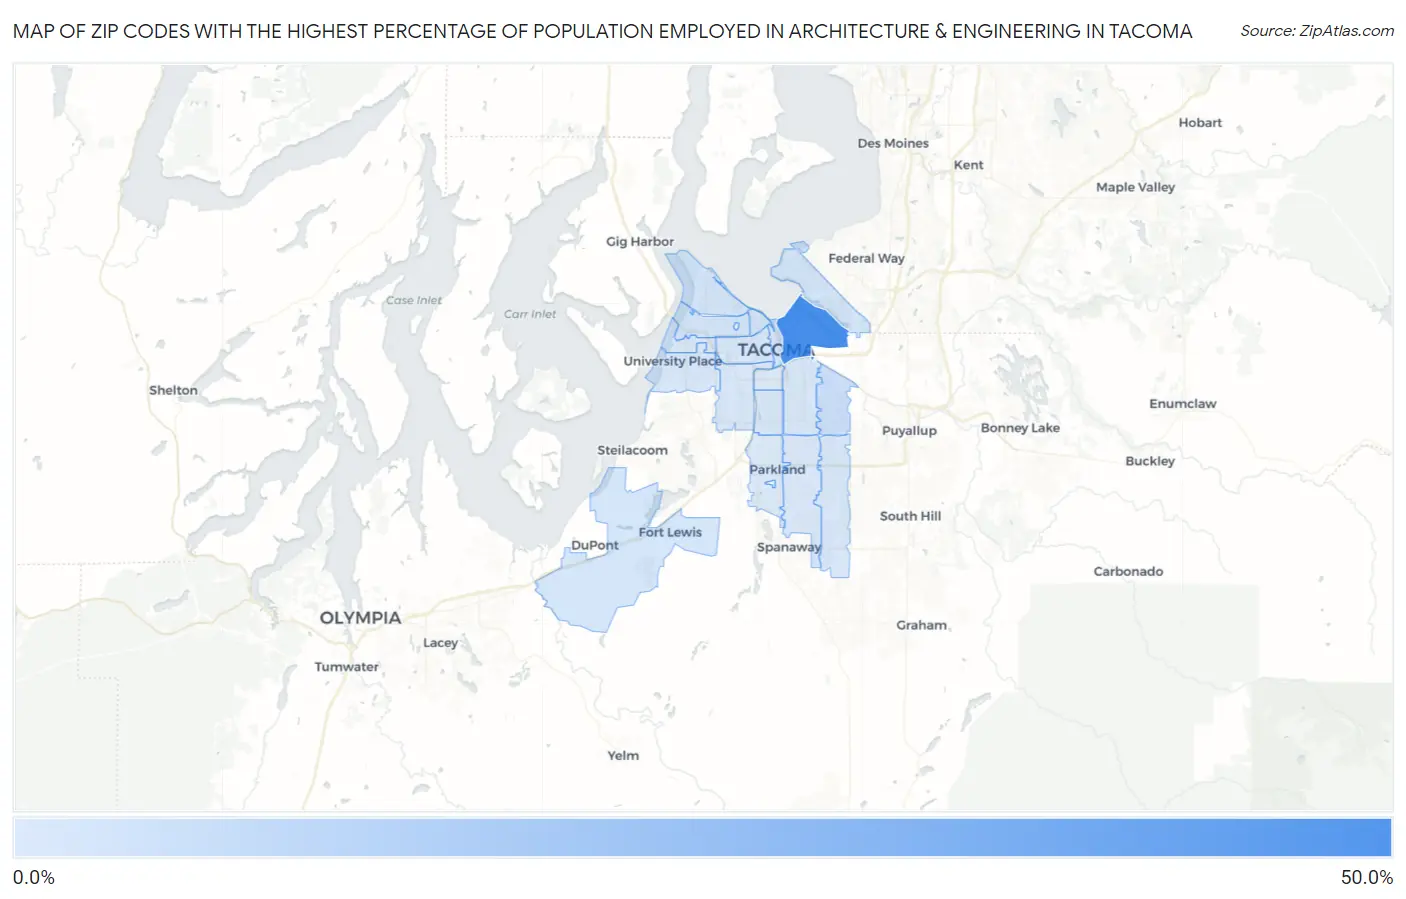
Map of Zip Codes with the Highest Percentage of Population Employed in Architecture & Engineering in Tacoma
0.16%
45.5%
Zip Codes with the Highest Percentage of Population Employed in Architecture & Engineering in Tacoma, WA
| Zip Code | % Employed | vs State | vs National | |
| 1. | 98421 | 45.5% | 2.8%(+42.7)#2 | 2.1%(+43.3)#21 |
| 2. | 98443 | 5.0% | 2.8%(+2.19)#39 | 2.1%(+2.83)#1,682 |
| 3. | 98403 | 3.0% | 2.8%(+0.248)#141 | 2.1%(+0.890)#4,931 |
| 4. | 98406 | 2.7% | 2.8%(-0.126)#168 | 2.1%(+0.516)#6,312 |
| 5. | 98407 | 2.4% | 2.8%(-0.370)#185 | 2.1%(+0.272)#7,367 |
| 6. | 98402 | 2.4% | 2.8%(-0.407)#190 | 2.1%(+0.235)#7,552 |
| 7. | 98422 | 2.2% | 2.8%(-0.579)#212 | 2.1%(+0.063)#8,425 |
| 8. | 98433 | 2.1% | 2.8%(-0.702)#226 | 2.1%(-0.060)#9,117 |
| 9. | 98466 | 1.6% | 2.8%(-1.19)#271 | 2.1%(-0.552)#12,201 |
| 10. | 98409 | 1.6% | 2.8%(-1.21)#273 | 2.1%(-0.566)#12,289 |
| 11. | 98405 | 1.4% | 2.8%(-1.38)#290 | 2.1%(-0.740)#13,521 |
| 12. | 98408 | 1.3% | 2.8%(-1.46)#299 | 2.1%(-0.823)#14,127 |
| 13. | 98446 | 1.2% | 2.8%(-1.62)#323 | 2.1%(-0.977)#15,302 |
| 14. | 98404 | 1.1% | 2.8%(-1.66)#326 | 2.1%(-1.01)#15,580 |
| 15. | 98465 | 0.98% | 2.8%(-1.81)#344 | 2.1%(-1.17)#16,732 |
| 16. | 98445 | 0.66% | 2.8%(-2.13)#372 | 2.1%(-1.49)#19,155 |
| 17. | 98418 | 0.28% | 2.8%(-2.51)#395 | 2.1%(-1.87)#21,663 |
| 18. | 98444 | 0.16% | 2.8%(-2.64)#406 | 2.1%(-1.99)#22,234 |
1
Common Questions
What are the Top 10 Zip Codes with the Highest Percentage of Population Employed in Architecture & Engineering in Tacoma, WA?
Top 10 Zip Codes with the Highest Percentage of Population Employed in Architecture & Engineering in Tacoma, WA are:
What zip code has the Highest Percentage of Population Employed in Architecture & Engineering in Tacoma, WA?
98421 has the Highest Percentage of Population Employed in Architecture & Engineering in Tacoma, WA with 45.5%.
What is the Percentage of Population Employed in Architecture & Engineering in Tacoma, WA?
Percentage of Population Employed in Architecture & Engineering in Tacoma is 1.7%.
What is the Percentage of Population Employed in Architecture & Engineering in Washington?
Percentage of Population Employed in Architecture & Engineering in Washington is 2.8%.
What is the Percentage of Population Employed in Architecture & Engineering in the United States?
Percentage of Population Employed in Architecture & Engineering in the United States is 2.1%.