Chico, WA Map & Demographics
Chico Map
Chico Overview
$72,086
PER CAPITA INCOME
$143,676
AVG FAMILY INCOME
$126,904
AVG HOUSEHOLD INCOME
16.5%
WAGE / INCOME GAP [ % ]
83.5¢/ $1
WAGE / INCOME GAP [ $ ]
0.42
INEQUALITY / GINI INDEX
3,076
TOTAL POPULATION
1,627
MALE POPULATION
1,449
FEMALE POPULATION
112.28
MALES / 100 FEMALES
89.06
FEMALES / 100 MALES
47.8
MEDIAN AGE
2.9
AVG FAMILY SIZE
2.6
AVG HOUSEHOLD SIZE
1,486
LABOR FORCE [ PEOPLE ]
59.8%
PERCENT IN LABOR FORCE
3.7%
UNEMPLOYMENT RATE
Income in Chico
Income Overview in Chico
Per Capita Income in Chico is $72,086, while median incomes of families and households are $143,676 and $126,904 respectively.
| Characteristic | Number | Measure |
| Per Capita Income | 3,076 | $72,086 |
| Median Family Income | 874 | $143,676 |
| Mean Family Income | 874 | $203,231 |
| Median Household Income | 1,165 | $126,904 |
| Mean Household Income | 1,165 | $189,328 |
| Income Deficit | 874 | $0 |
| Wage / Income Gap (%) | 3,076 | 16.55% |
| Wage / Income Gap ($) | 3,076 | 83.45¢ per $1 |
| Gini / Inequality Index | 3,076 | 0.42 |
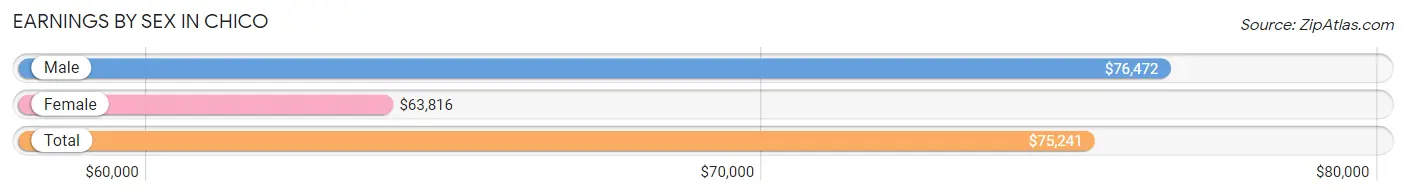
Earnings by Sex in Chico
Average Earnings in Chico are $75,241, $76,472 for men and $63,816 for women, a difference of 16.6%.
| Sex | Number | Average Earnings |
| Male | 781 (52.1%) | $76,472 |
| Female | 718 (47.9%) | $63,816 |
| Total | 1,499 (100.0%) | $75,241 |
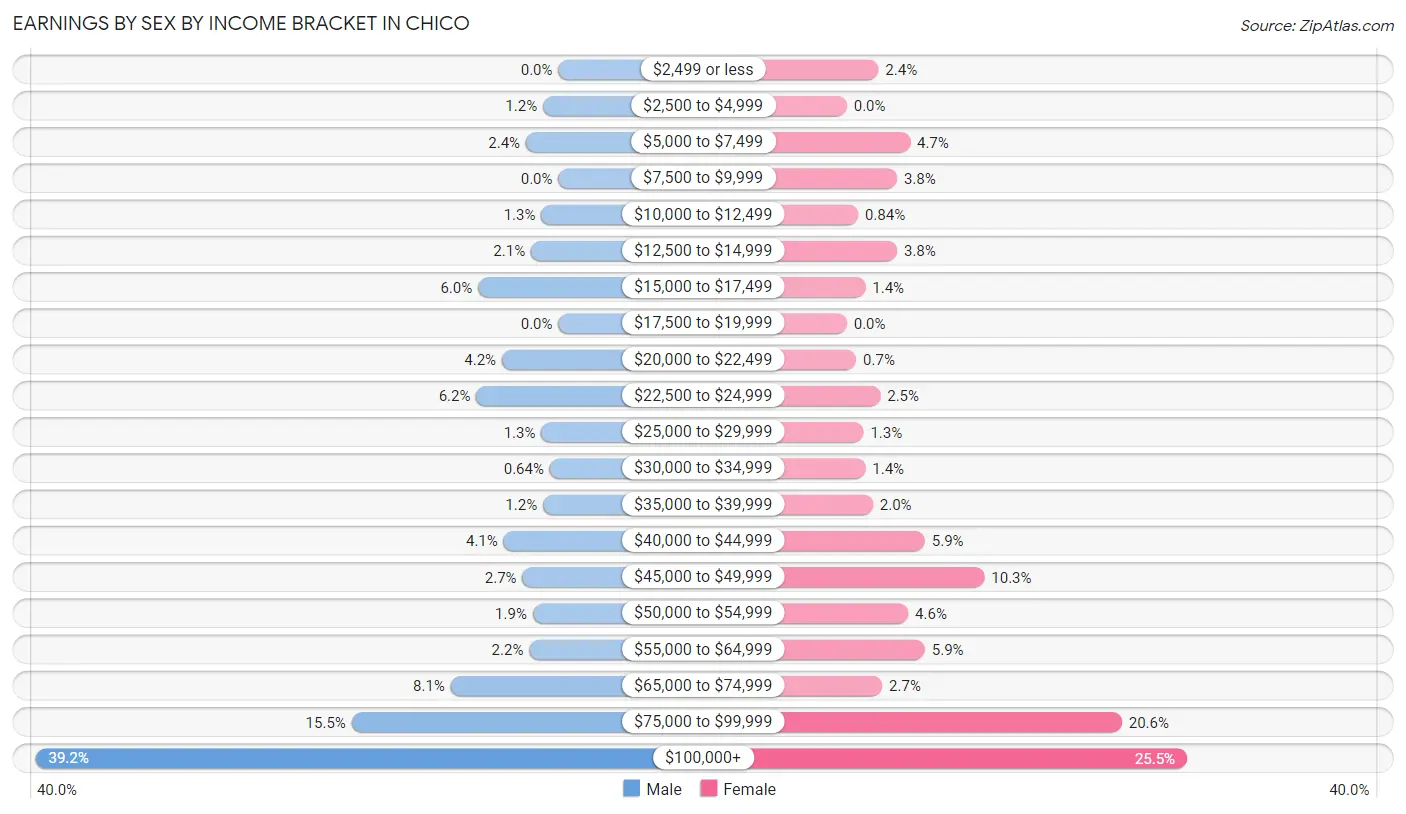
Earnings by Sex by Income Bracket in Chico
The most common earnings brackets in Chico are $100,000+ for men (306 | 39.2%) and $100,000+ for women (183 | 25.5%).
| Income | Male | Female |
| $2,499 or less | 0 (0.0%) | 17 (2.4%) |
| $2,500 to $4,999 | 9 (1.1%) | 0 (0.0%) |
| $5,000 to $7,499 | 19 (2.4%) | 34 (4.7%) |
| $7,500 to $9,999 | 0 (0.0%) | 27 (3.8%) |
| $10,000 to $12,499 | 10 (1.3%) | 6 (0.8%) |
| $12,500 to $14,999 | 16 (2.1%) | 27 (3.8%) |
| $15,000 to $17,499 | 47 (6.0%) | 10 (1.4%) |
| $17,500 to $19,999 | 0 (0.0%) | 0 (0.0%) |
| $20,000 to $22,499 | 33 (4.2%) | 5 (0.7%) |
| $22,500 to $24,999 | 48 (6.1%) | 18 (2.5%) |
| $25,000 to $29,999 | 10 (1.3%) | 9 (1.3%) |
| $30,000 to $34,999 | 5 (0.6%) | 10 (1.4%) |
| $35,000 to $39,999 | 9 (1.1%) | 14 (1.9%) |
| $40,000 to $44,999 | 32 (4.1%) | 42 (5.9%) |
| $45,000 to $49,999 | 21 (2.7%) | 74 (10.3%) |
| $50,000 to $54,999 | 15 (1.9%) | 33 (4.6%) |
| $55,000 to $64,999 | 17 (2.2%) | 42 (5.9%) |
| $65,000 to $74,999 | 63 (8.1%) | 19 (2.6%) |
| $75,000 to $99,999 | 121 (15.5%) | 148 (20.6%) |
| $100,000+ | 306 (39.2%) | 183 (25.5%) |
| Total | 781 (100.0%) | 718 (100.0%) |
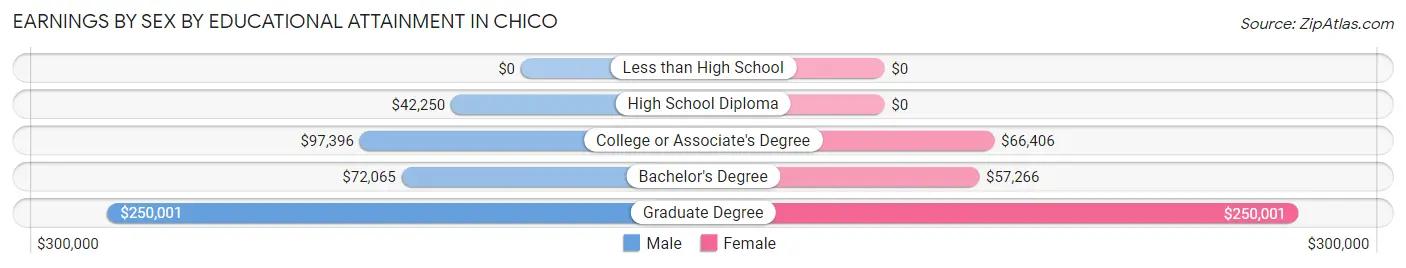
Earnings by Sex by Educational Attainment in Chico
Average earnings in Chico are $91,042 for men and $71,250 for women, a difference of 21.7%. Men with an educational attainment of graduate degree enjoy the highest average annual earnings of $250,001, while those with high school diploma education earn the least with $42,250. Women with an educational attainment of graduate degree earn the most with the average annual earnings of $250,001, while those with bachelor's degree education have the smallest earnings of $57,266.
| Educational Attainment | Male Income | Female Income |
| Less than High School | - | - |
| High School Diploma | $42,250 | $0 |
| College or Associate's Degree | $97,396 | $66,406 |
| Bachelor's Degree | $72,065 | $57,266 |
| Graduate Degree | $250,001 | $250,001 |
| Total | $91,042 | $71,250 |
Family Income in Chico
Family Income Brackets in Chico
According to the Chico family income data, there are 230 families falling into the $100,000 to $149,999 income range, which is the most common income bracket and makes up 26.3% of all families.
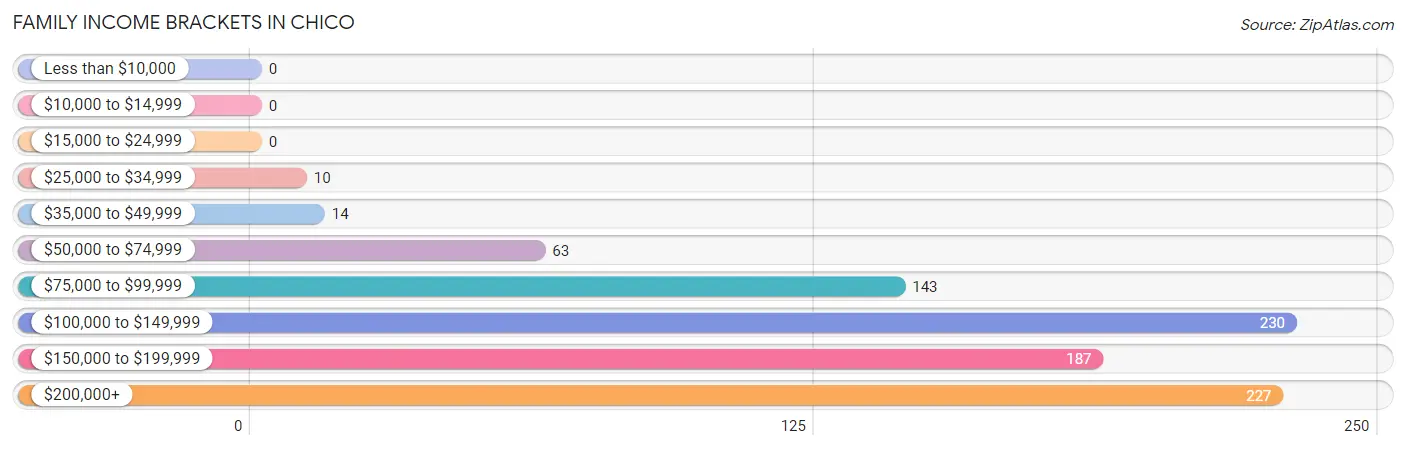
| Income Bracket | # Families | % Families |
| Less than $10,000 | 0 | 0.0% |
| $10,000 to $14,999 | 0 | 0.0% |
| $15,000 to $24,999 | 0 | 0.0% |
| $25,000 to $34,999 | 10 | 1.1% |
| $35,000 to $49,999 | 14 | 1.6% |
| $50,000 to $74,999 | 63 | 7.2% |
| $75,000 to $99,999 | 143 | 16.4% |
| $100,000 to $149,999 | 230 | 26.3% |
| $150,000 to $199,999 | 187 | 21.4% |
| $200,000+ | 227 | 26.0% |
Family Income by Famaliy Size in Chico
4-person families (119 | 13.6%) account for the highest median family income in Chico with $250,001 per family, while 4-person families (119 | 13.6%) have the highest median income of $62,500 per family member.
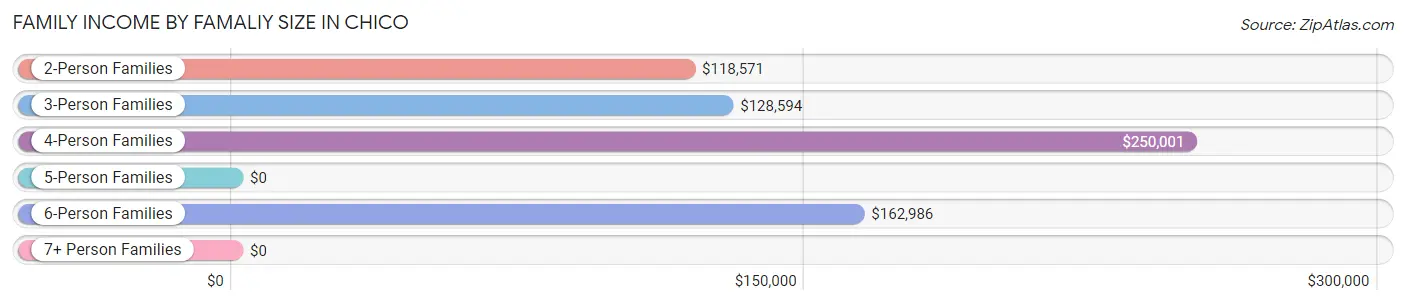
| Income Bracket | # Families | Median Income |
| 2-Person Families | 442 (50.6%) | $118,571 |
| 3-Person Families | 225 (25.7%) | $128,594 |
| 4-Person Families | 119 (13.6%) | $250,001 |
| 5-Person Families | 53 (6.1%) | $0 |
| 6-Person Families | 29 (3.3%) | $162,986 |
| 7+ Person Families | 6 (0.7%) | $0 |
| Total | 874 (100.0%) | $143,676 |
Family Income by Number of Earners in Chico
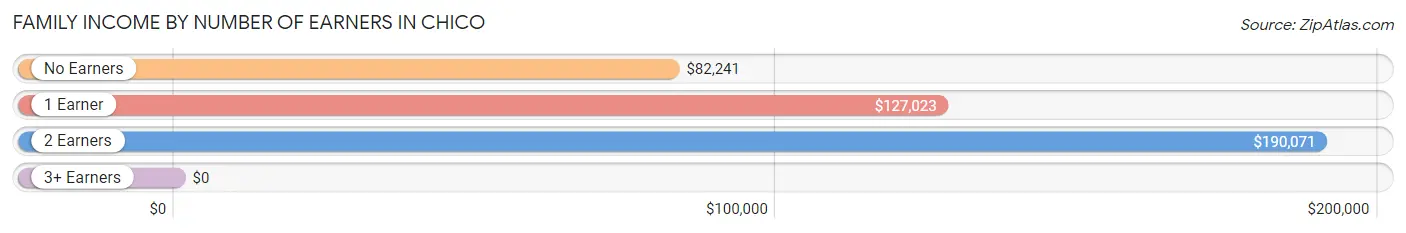
| Number of Earners | # Families | Median Income |
| No Earners | 178 (20.4%) | $82,241 |
| 1 Earner | 265 (30.3%) | $127,023 |
| 2 Earners | 397 (45.4%) | $190,071 |
| 3+ Earners | 34 (3.9%) | $0 |
| Total | 874 (100.0%) | $143,676 |
Household Income in Chico
Household Income Brackets in Chico
With 301 households falling in the category, the $200,000+ income range is the most frequent in Chico, accounting for 25.8% of all households.
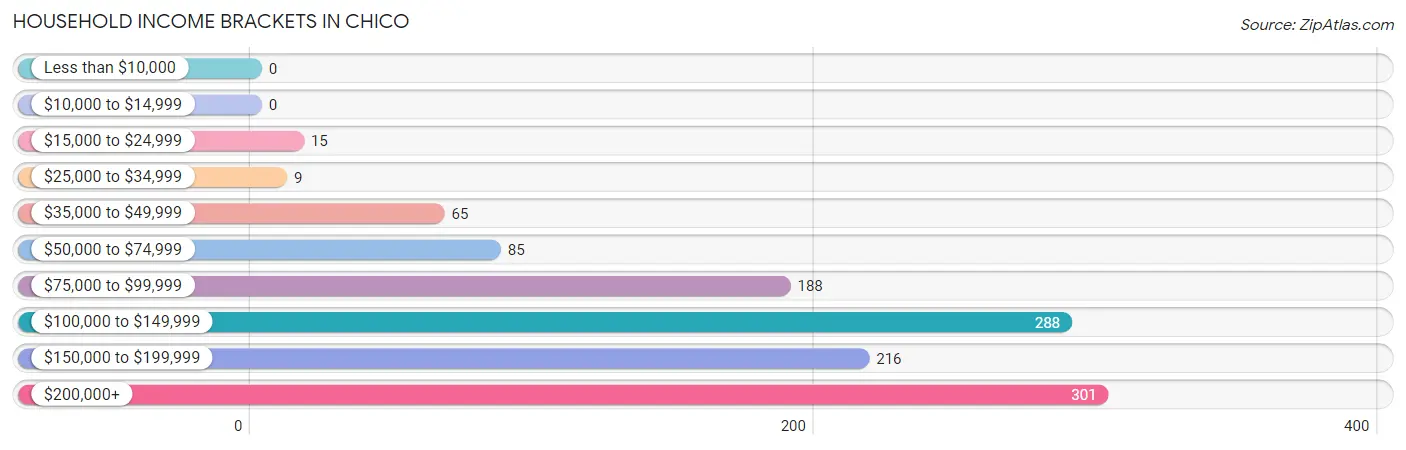
| Income Bracket | # Households | % Households |
| Less than $10,000 | 0 | 0.0% |
| $10,000 to $14,999 | 0 | 0.0% |
| $15,000 to $24,999 | 15 | 1.3% |
| $25,000 to $34,999 | 9 | 0.8% |
| $35,000 to $49,999 | 65 | 5.6% |
| $50,000 to $74,999 | 85 | 7.3% |
| $75,000 to $99,999 | 188 | 16.1% |
| $100,000 to $149,999 | 288 | 24.7% |
| $150,000 to $199,999 | 216 | 18.5% |
| $200,000+ | 301 | 25.8% |
Household Income by Householder Age in Chico
The median household income in Chico is $126,904, with the highest median household income of $165,893 found in the 45 to 64 years age bracket for the primary householder. A total of 485 households (41.6%) fall into this category.
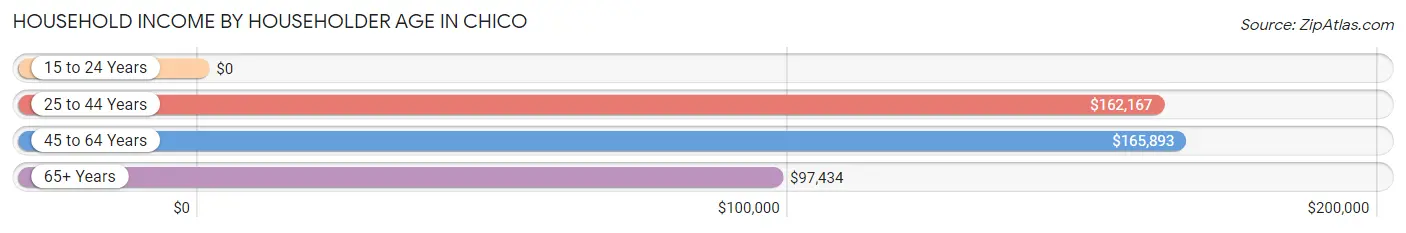
| Income Bracket | # Households | Median Income |
| 15 to 24 Years | 0 (0.0%) | $0 |
| 25 to 44 Years | 300 (25.8%) | $162,167 |
| 45 to 64 Years | 485 (41.6%) | $165,893 |
| 65+ Years | 380 (32.6%) | $97,434 |
| Total | 1,165 (100.0%) | $126,904 |
Poverty in Chico
Income Below Poverty by Sex and Age in Chico
With 1.7% poverty level for males and 2.8% for females among the residents of Chico, 35 to 44 year old males and 25 to 34 year old females are the most vulnerable to poverty, with 17 males (7.2%) and 18 females (23.4%) in their respective age groups living below the poverty level.
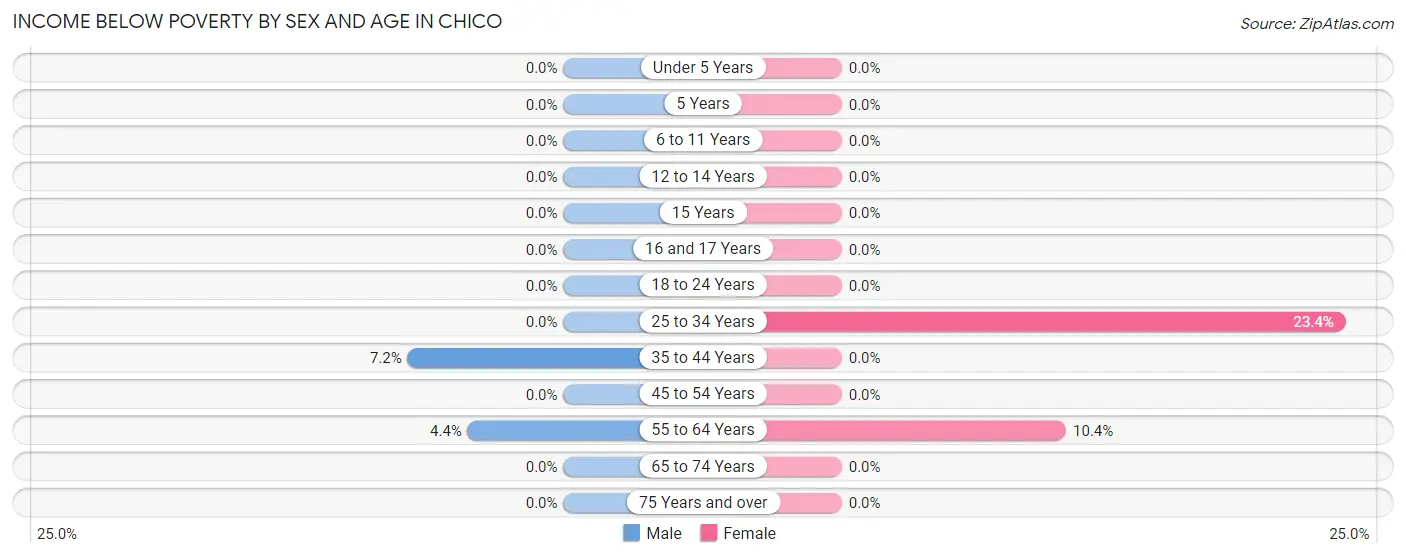
| Age Bracket | Male | Female |
| Under 5 Years | 0 (0.0%) | 0 (0.0%) |
| 5 Years | 0 (0.0%) | 0 (0.0%) |
| 6 to 11 Years | 0 (0.0%) | 0 (0.0%) |
| 12 to 14 Years | 0 (0.0%) | 0 (0.0%) |
| 15 Years | 0 (0.0%) | 0 (0.0%) |
| 16 and 17 Years | 0 (0.0%) | 0 (0.0%) |
| 18 to 24 Years | 0 (0.0%) | 0 (0.0%) |
| 25 to 34 Years | 0 (0.0%) | 18 (23.4%) |
| 35 to 44 Years | 17 (7.2%) | 0 (0.0%) |
| 45 to 54 Years | 0 (0.0%) | 0 (0.0%) |
| 55 to 64 Years | 11 (4.4%) | 23 (10.4%) |
| 65 to 74 Years | 0 (0.0%) | 0 (0.0%) |
| 75 Years and over | 0 (0.0%) | 0 (0.0%) |
| Total | 28 (1.7%) | 41 (2.8%) |
Income Above Poverty by Sex and Age in Chico
According to the poverty statistics in Chico, males aged under 5 years and females aged under 5 years are the age groups that are most secure financially, with 100.0% of males and 100.0% of females in these age groups living above the poverty line.
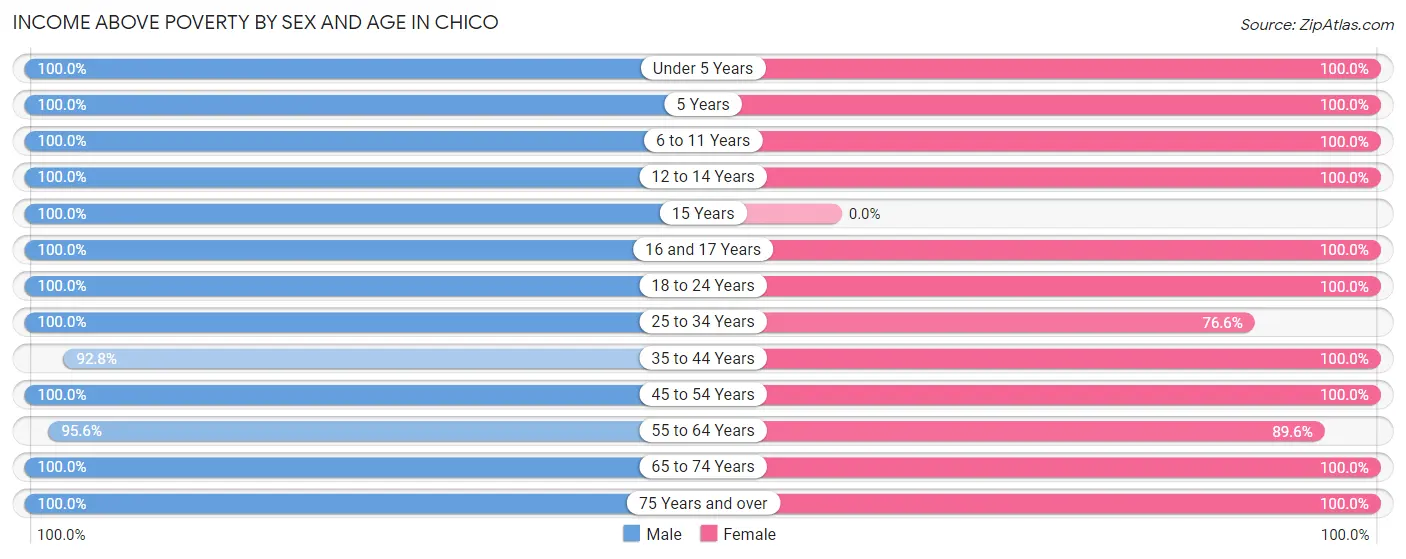
| Age Bracket | Male | Female |
| Under 5 Years | 31 (100.0%) | 37 (100.0%) |
| 5 Years | 6 (100.0%) | 5 (100.0%) |
| 6 to 11 Years | 246 (100.0%) | 90 (100.0%) |
| 12 to 14 Years | 79 (100.0%) | 73 (100.0%) |
| 15 Years | 24 (100.0%) | 0 (0.0%) |
| 16 and 17 Years | 75 (100.0%) | 39 (100.0%) |
| 18 to 24 Years | 63 (100.0%) | 56 (100.0%) |
| 25 to 34 Years | 120 (100.0%) | 59 (76.6%) |
| 35 to 44 Years | 218 (92.8%) | 225 (100.0%) |
| 45 to 54 Years | 165 (100.0%) | 240 (100.0%) |
| 55 to 64 Years | 237 (95.6%) | 198 (89.6%) |
| 65 to 74 Years | 195 (100.0%) | 201 (100.0%) |
| 75 Years and over | 140 (100.0%) | 185 (100.0%) |
| Total | 1,599 (98.3%) | 1,408 (97.2%) |
Income Below Poverty Among Married-Couple Families in Chico
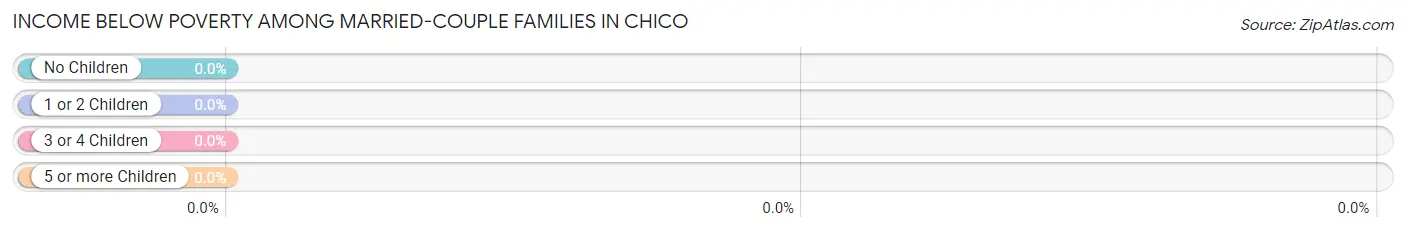
| Children | Above Poverty | Below Poverty |
| No Children | 479 (100.0%) | 0 (0.0%) |
| 1 or 2 Children | 208 (100.0%) | 0 (0.0%) |
| 3 or 4 Children | 77 (100.0%) | 0 (0.0%) |
| 5 or more Children | 6 (100.0%) | 0 (0.0%) |
| Total | 770 (100.0%) | 0 (0.0%) |
Income Below Poverty Among Single-Parent Households in Chico
| Children | Single Father | Single Mother |
| No Children | 0 (0.0%) | 0 (0.0%) |
| 1 or 2 Children | 0 (0.0%) | 0 (0.0%) |
| 3 or 4 Children | 0 (0.0%) | 0 (0.0%) |
| 5 or more Children | 0 (0.0%) | 0 (0.0%) |
| Total | 0 (0.0%) | 0 (0.0%) |
Income Below Poverty Among Married-Couple vs Single-Parent Households in Chico
| Children | Married-Couple Families | Single-Parent Households |
| No Children | 0 (0.0%) | 0 (0.0%) |
| 1 or 2 Children | 0 (0.0%) | 0 (0.0%) |
| 3 or 4 Children | 0 (0.0%) | 0 (0.0%) |
| 5 or more Children | 0 (0.0%) | 0 (0.0%) |
| Total | 0 (0.0%) | 0 (0.0%) |
Race in Chico
The most populous races in Chico are White / Caucasian (2,363 | 76.8%), Asian (361 | 11.7%), and Two or more Races (178 | 5.8%).
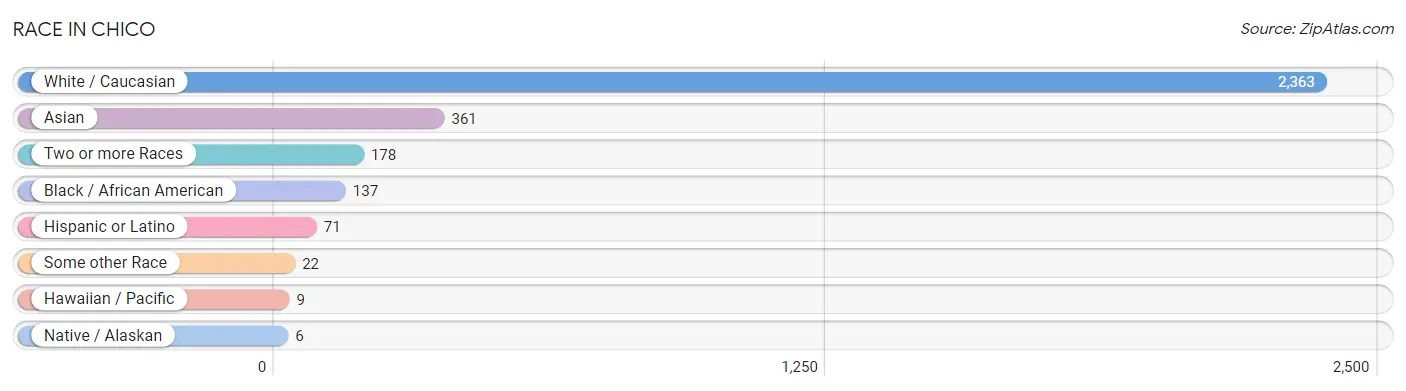
| Race | # Population | % Population |
| Asian | 361 | 11.7% |
| Black / African American | 137 | 4.4% |
| Hawaiian / Pacific | 9 | 0.3% |
| Hispanic or Latino | 71 | 2.3% |
| Native / Alaskan | 6 | 0.2% |
| White / Caucasian | 2,363 | 76.8% |
| Two or more Races | 178 | 5.8% |
| Some other Race | 22 | 0.7% |
| Total | 3,076 | 100.0% |
Ancestry in Chico
The most populous ancestries reported in Chico are German (706 | 23.0%), Korean (412 | 13.4%), English (375 | 12.2%), European (271 | 8.8%), and Irish (200 | 6.5%), together accounting for 63.8% of all Chico residents.
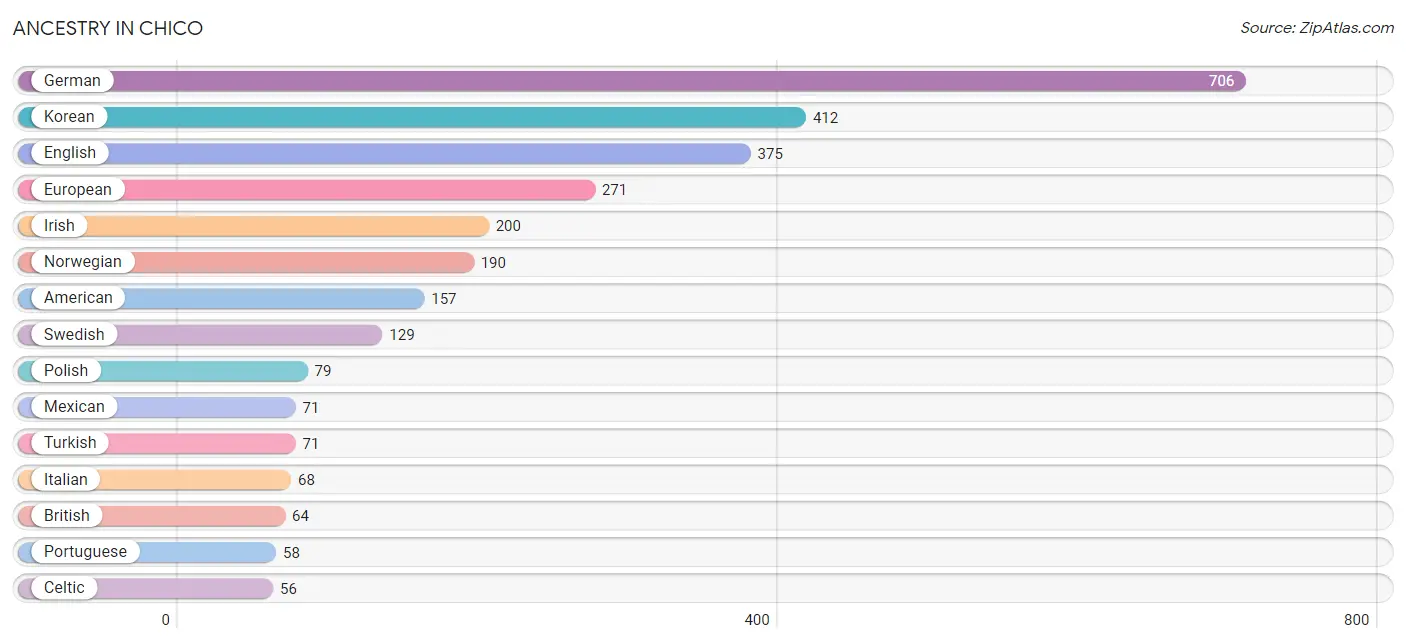
| Ancestry | # Population | % Population |
| African | 5 | 0.2% |
| American | 157 | 5.1% |
| Austrian | 16 | 0.5% |
| Bhutanese | 15 | 0.5% |
| British | 64 | 2.1% |
| Burmese | 31 | 1.0% |
| Celtic | 56 | 1.8% |
| Cherokee | 6 | 0.2% |
| Colville | 8 | 0.3% |
| Dutch | 7 | 0.2% |
| Eastern European | 10 | 0.3% |
| English | 375 | 12.2% |
| European | 271 | 8.8% |
| Finnish | 40 | 1.3% |
| French | 33 | 1.1% |
| French Canadian | 9 | 0.3% |
| German | 706 | 23.0% |
| Guamanian / Chamorro | 9 | 0.3% |
| Hungarian | 28 | 0.9% |
| Indian (Asian) | 17 | 0.5% |
| Irish | 200 | 6.5% |
| Italian | 68 | 2.2% |
| Korean | 412 | 13.4% |
| Mexican | 71 | 2.3% |
| Nigerian | 18 | 0.6% |
| Norwegian | 190 | 6.2% |
| Polish | 79 | 2.6% |
| Portuguese | 58 | 1.9% |
| Samoan | 17 | 0.5% |
| Scandinavian | 10 | 0.3% |
| Scottish | 8 | 0.3% |
| Serbian | 13 | 0.4% |
| Subsaharan African | 23 | 0.7% |
| Swedish | 129 | 4.2% |
| Turkish | 71 | 2.3% |
| Ukrainian | 32 | 1.0% | View All 36 Rows |
Immigrants in Chico
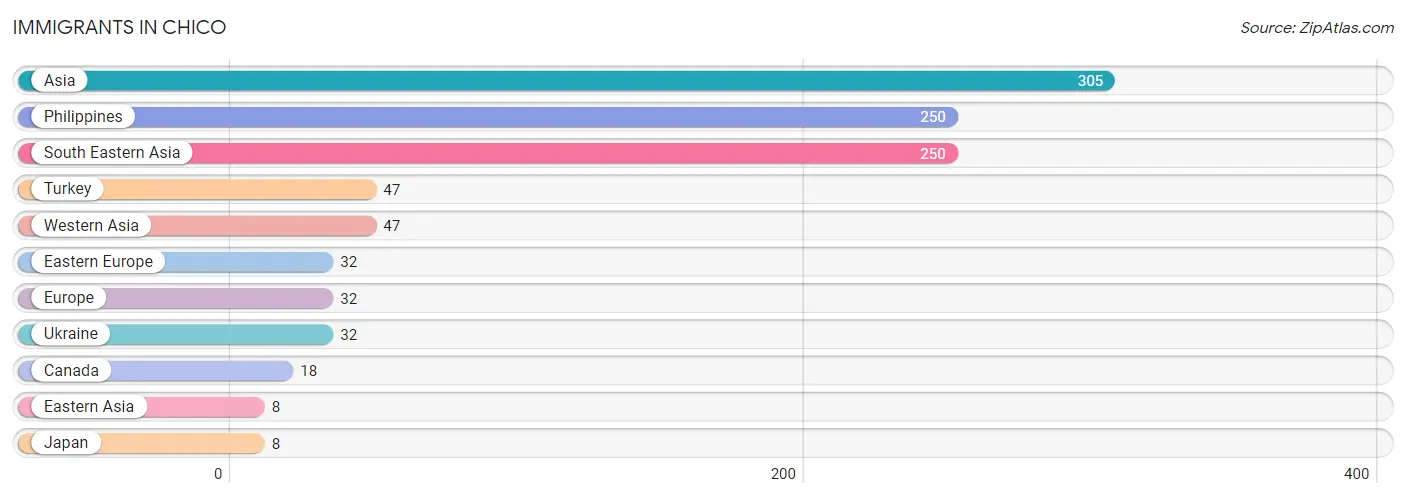
The most numerous immigrant groups reported in Chico came from Asia (305 | 9.9%), Philippines (250 | 8.1%), South Eastern Asia (250 | 8.1%), Turkey (47 | 1.5%), and Western Asia (47 | 1.5%), together accounting for 29.2% of all Chico residents.
| Immigration Origin | # Population | % Population |
| Asia | 305 | 9.9% |
| Canada | 18 | 0.6% |
| Eastern Asia | 8 | 0.3% |
| Eastern Europe | 32 | 1.0% |
| Europe | 32 | 1.0% |
| Japan | 8 | 0.3% |
| Philippines | 250 | 8.1% |
| South Eastern Asia | 250 | 8.1% |
| Turkey | 47 | 1.5% |
| Ukraine | 32 | 1.0% |
| Western Asia | 47 | 1.5% | View All 11 Rows |
Sex and Age in Chico
Sex and Age in Chico
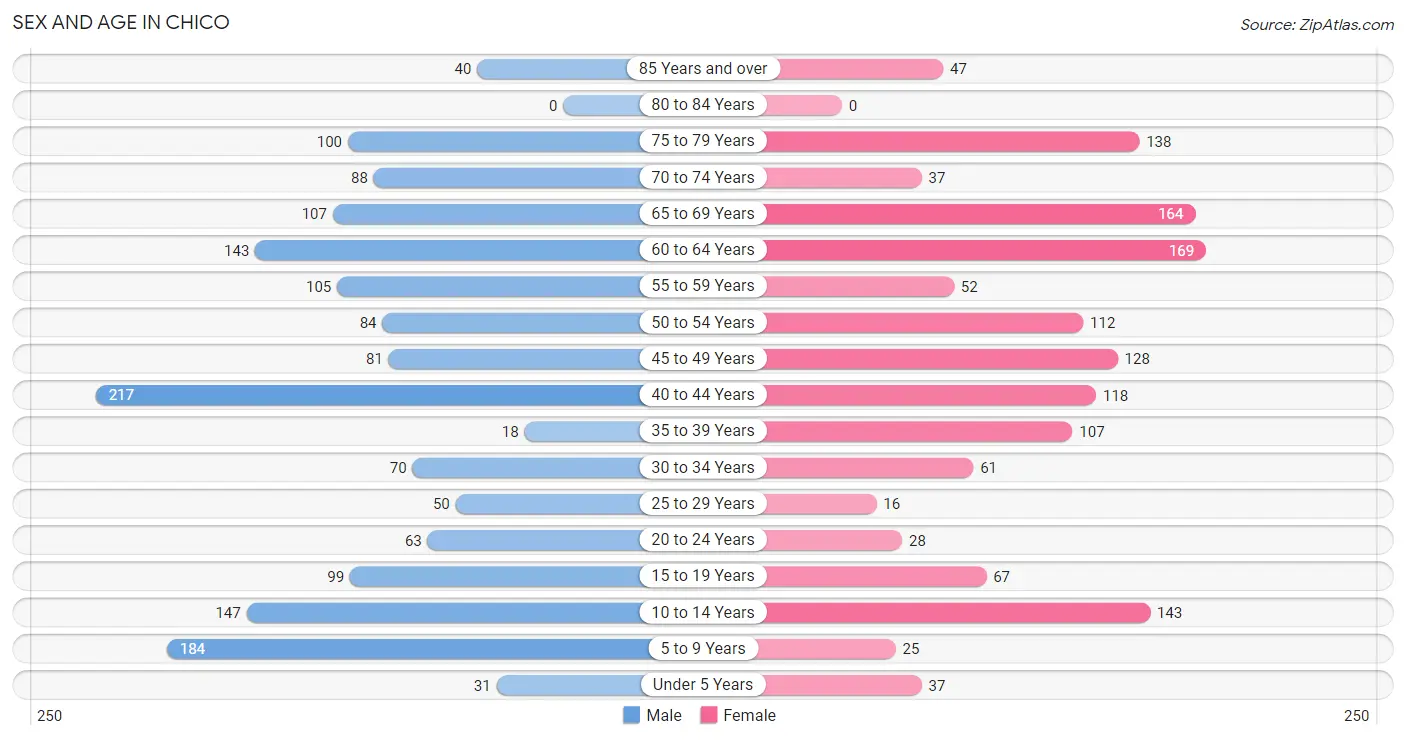
The most populous age groups in Chico are 40 to 44 Years (217 | 13.3%) for men and 60 to 64 Years (169 | 11.7%) for women.
| Age Bracket | Male | Female |
| Under 5 Years | 31 (1.9%) | 37 (2.5%) |
| 5 to 9 Years | 184 (11.3%) | 25 (1.7%) |
| 10 to 14 Years | 147 (9.0%) | 143 (9.9%) |
| 15 to 19 Years | 99 (6.1%) | 67 (4.6%) |
| 20 to 24 Years | 63 (3.9%) | 28 (1.9%) |
| 25 to 29 Years | 50 (3.1%) | 16 (1.1%) |
| 30 to 34 Years | 70 (4.3%) | 61 (4.2%) |
| 35 to 39 Years | 18 (1.1%) | 107 (7.4%) |
| 40 to 44 Years | 217 (13.3%) | 118 (8.1%) |
| 45 to 49 Years | 81 (5.0%) | 128 (8.8%) |
| 50 to 54 Years | 84 (5.2%) | 112 (7.7%) |
| 55 to 59 Years | 105 (6.5%) | 52 (3.6%) |
| 60 to 64 Years | 143 (8.8%) | 169 (11.7%) |
| 65 to 69 Years | 107 (6.6%) | 164 (11.3%) |
| 70 to 74 Years | 88 (5.4%) | 37 (2.5%) |
| 75 to 79 Years | 100 (6.1%) | 138 (9.5%) |
| 80 to 84 Years | 0 (0.0%) | 0 (0.0%) |
| 85 Years and over | 40 (2.5%) | 47 (3.2%) |
| Total | 1,627 (100.0%) | 1,449 (100.0%) |
Families and Households in Chico
Median Family Size in Chico
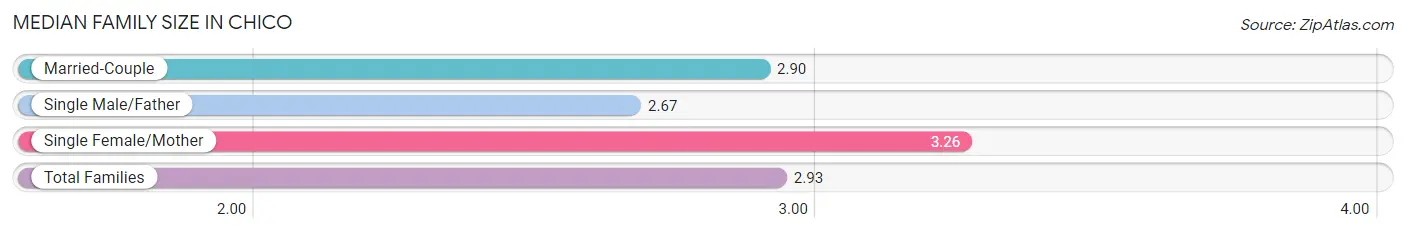
The median family size in Chico is 2.93 persons per family, with single female/mother families (89 | 10.2%) accounting for the largest median family size of 3.26 persons per family. On the other hand, single male/father families (15 | 1.7%) represent the smallest median family size with 2.67 persons per family.
| Family Type | # Families | Family Size |
| Married-Couple | 770 (88.1%) | 2.90 |
| Single Male/Father | 15 (1.7%) | 2.67 |
| Single Female/Mother | 89 (10.2%) | 3.26 |
| Total Families | 874 (100.0%) | 2.93 |
Median Household Size in Chico
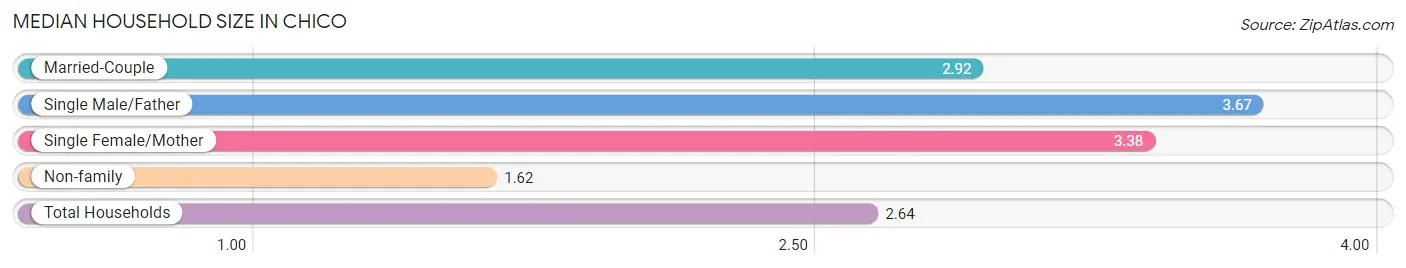
The median household size in Chico is 2.64 persons per household, with single male/father households (15 | 1.3%) accounting for the largest median household size of 3.67 persons per household. non-family households (291 | 25.0%) represent the smallest median household size with 1.62 persons per household.
| Household Type | # Households | Household Size |
| Married-Couple | 770 (66.1%) | 2.92 |
| Single Male/Father | 15 (1.3%) | 3.67 |
| Single Female/Mother | 89 (7.6%) | 3.38 |
| Non-family | 291 (25.0%) | 1.62 |
| Total Households | 1,165 (100.0%) | 2.64 |
Household Size by Marriage Status in Chico
Out of a total of 1,165 households in Chico, 874 (75.0%) are family households, while 291 (25.0%) are nonfamily households. The most numerous type of family households are 2-person households, comprising 427, and the most common type of nonfamily households are 1-person households, comprising 187.
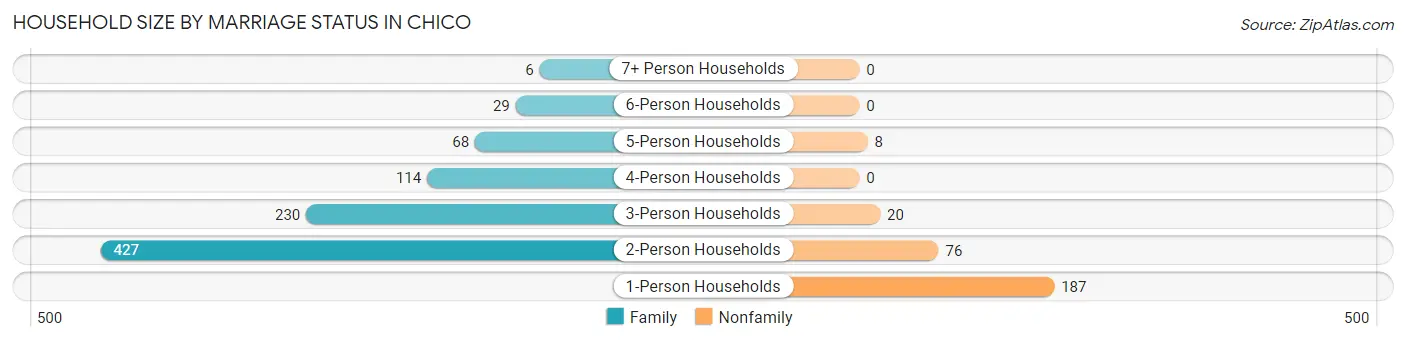
| Household Size | Family Households | Nonfamily Households |
| 1-Person Households | - | 187 (16.1%) |
| 2-Person Households | 427 (36.6%) | 76 (6.5%) |
| 3-Person Households | 230 (19.7%) | 20 (1.7%) |
| 4-Person Households | 114 (9.8%) | 0 (0.0%) |
| 5-Person Households | 68 (5.8%) | 8 (0.7%) |
| 6-Person Households | 29 (2.5%) | 0 (0.0%) |
| 7+ Person Households | 6 (0.5%) | 0 (0.0%) |
| Total | 874 (75.0%) | 291 (25.0%) |
Female Fertility in Chico
Fertility by Age in Chico
| Age Bracket | Women with Births | Births / 1,000 Women |
| 15 to 19 years | 0 (0.0%) | 0.0 |
| 20 to 34 years | 0 (0.0%) | 0.0 |
| 35 to 50 years | 0 (0.0%) | 0.0 |
| Total | 0 (0.0%) | 0.0 |
Fertility by Age by Marriage Status in Chico
| Age Bracket | Married | Unmarried |
| 15 to 19 years | 0 (0.0%) | 0 (0.0%) |
| 20 to 34 years | 0 (0.0%) | 0 (0.0%) |
| 35 to 50 years | 0 (0.0%) | 0 (0.0%) |
| Total | 0 (0.0%) | 0 (0.0%) |
Fertility by Education in Chico
| Educational Attainment | Women with Births | Births / 1,000 Women |
| Less than High School | 0 (0.0%) | 0.0 |
| High School Diploma | 0 (0.0%) | 0.0 |
| College or Associate's Degree | 0 (0.0%) | 0.0 |
| Bachelor's Degree | 0 (0.0%) | 0.0 |
| Graduate Degree | 0 (0.0%) | 0.0 |
| Total | 0 (0.0%) | 0.0 |
Fertility by Education by Marriage Status in Chico
| Educational Attainment | Married | Unmarried |
| Less than High School | 0 (0.0%) | 0 (0.0%) |
| High School Diploma | 0 (0.0%) | 0 (0.0%) |
| College or Associate's Degree | 0 (0.0%) | 0 (0.0%) |
| Bachelor's Degree | 0 (0.0%) | 0 (0.0%) |
| Graduate Degree | 0 (0.0%) | 0 (0.0%) |
| Total | 0 (0.0%) | 0 (0.0%) |
Employment Characteristics in Chico
Employment by Class of Employer in Chico
Among the 1,369 employed individuals in Chico, private company employees (578 | 42.2%), federal government employees (387 | 28.3%), and state government employees (104 | 7.6%) make up the most common classes of employment.
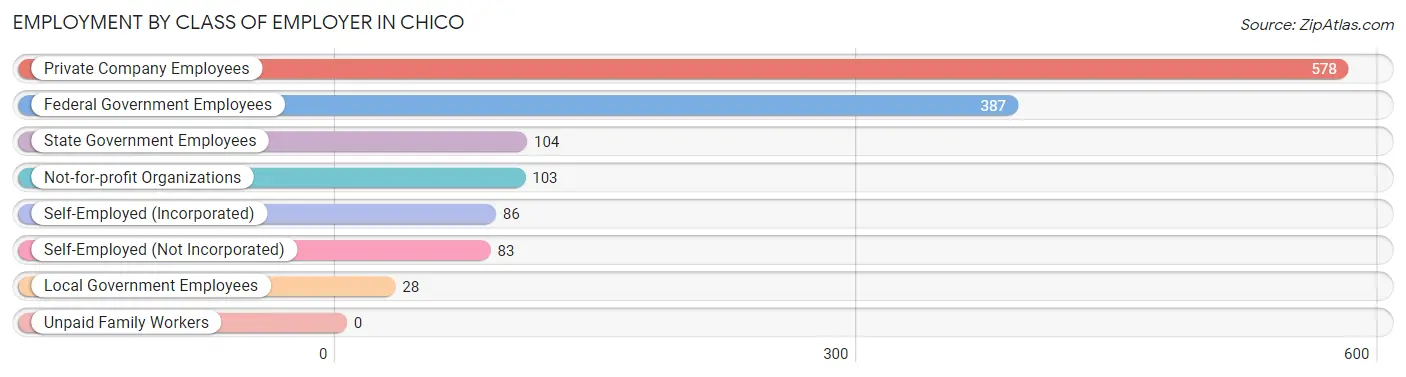
| Employer Class | # Employees | % Employees |
| Private Company Employees | 578 | 42.2% |
| Self-Employed (Incorporated) | 86 | 6.3% |
| Self-Employed (Not Incorporated) | 83 | 6.1% |
| Not-for-profit Organizations | 103 | 7.5% |
| Local Government Employees | 28 | 2.1% |
| State Government Employees | 104 | 7.6% |
| Federal Government Employees | 387 | 28.3% |
| Unpaid Family Workers | 0 | 0.0% |
| Total | 1,369 | 100.0% |
Employment Status by Age in Chico
According to the labor force statistics for Chico, out of the total population over 16 years of age (2,485), 59.8% or 1,486 individuals are in the labor force, with 3.7% or 55 of them unemployed. The age group with the highest labor force participation rate is 20 to 24 years, with 100.0% or 91 individuals in the labor force. Within the labor force, the 55 to 59 years age range has the highest percentage of unemployed individuals, with 33.1% or 45 of them being unemployed.
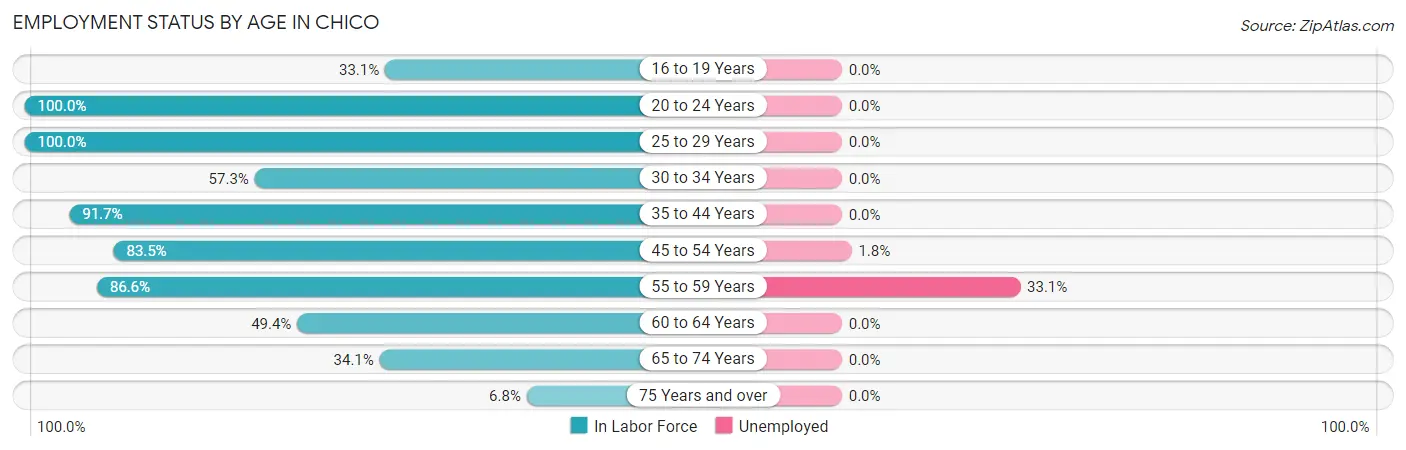
| Age Bracket | In Labor Force | Unemployed |
| 16 to 19 Years | 47 (33.1%) | 0 (0.0%) |
| 20 to 24 Years | 91 (100.0%) | 0 (0.0%) |
| 25 to 29 Years | 66 (100.0%) | 0 (0.0%) |
| 30 to 34 Years | 75 (57.3%) | 0 (0.0%) |
| 35 to 44 Years | 422 (91.7%) | 0 (0.0%) |
| 45 to 54 Years | 338 (83.5%) | 6 (1.8%) |
| 55 to 59 Years | 136 (86.6%) | 45 (33.1%) |
| 60 to 64 Years | 154 (49.4%) | 0 (0.0%) |
| 65 to 74 Years | 135 (34.1%) | 0 (0.0%) |
| 75 Years and over | 22 (6.8%) | 0 (0.0%) |
| Total | 1,486 (59.8%) | 55 (3.7%) |
Employment Status by Educational Attainment in Chico
According to labor force statistics for Chico, 77.8% of individuals (1,191) out of the total population between 25 and 64 years of age (1,531) are in the labor force, with 4.6% or 55 of them being unemployed. The group with the highest labor force participation rate are those with the educational attainment of college / associate degree, with 79.2% or 568 individuals in the labor force. Within the labor force, individuals with high school diploma education have the highest percentage of unemployment, with 24.5% or 37 of them being unemployed.
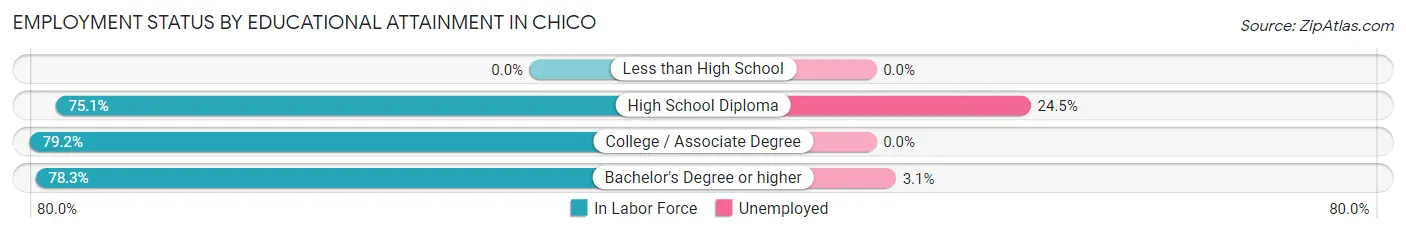
| Educational Attainment | In Labor Force | Unemployed |
| Less than High School | 0 (0.0%) | 0 (0.0%) |
| High School Diploma | 151 (75.1%) | 49 (24.5%) |
| College / Associate Degree | 568 (79.2%) | 0 (0.0%) |
| Bachelor's Degree or higher | 472 (78.3%) | 19 (3.1%) |
| Total | 1,191 (77.8%) | 70 (4.6%) |
Employment Occupations by Sex in Chico
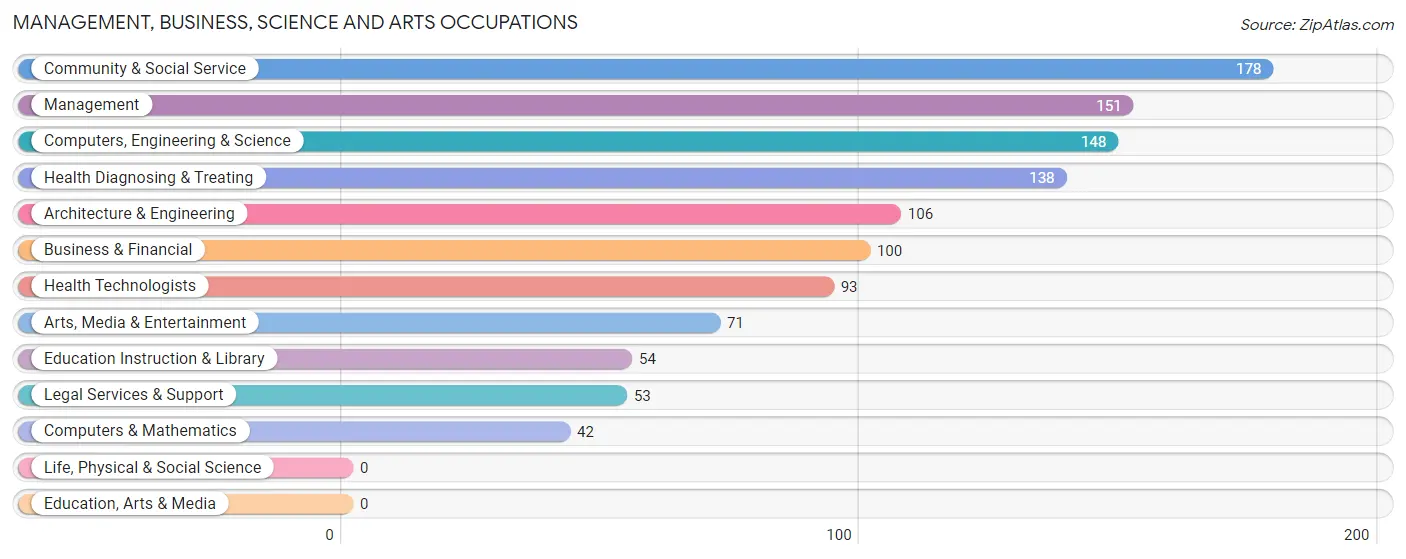
Management, Business, Science and Arts Occupations
The most common Management, Business, Science and Arts occupations in Chico are Community & Social Service (178 | 13.2%), Management (151 | 11.2%), Computers, Engineering & Science (148 | 11.0%), Health Diagnosing & Treating (138 | 10.3%), and Architecture & Engineering (106 | 7.9%).
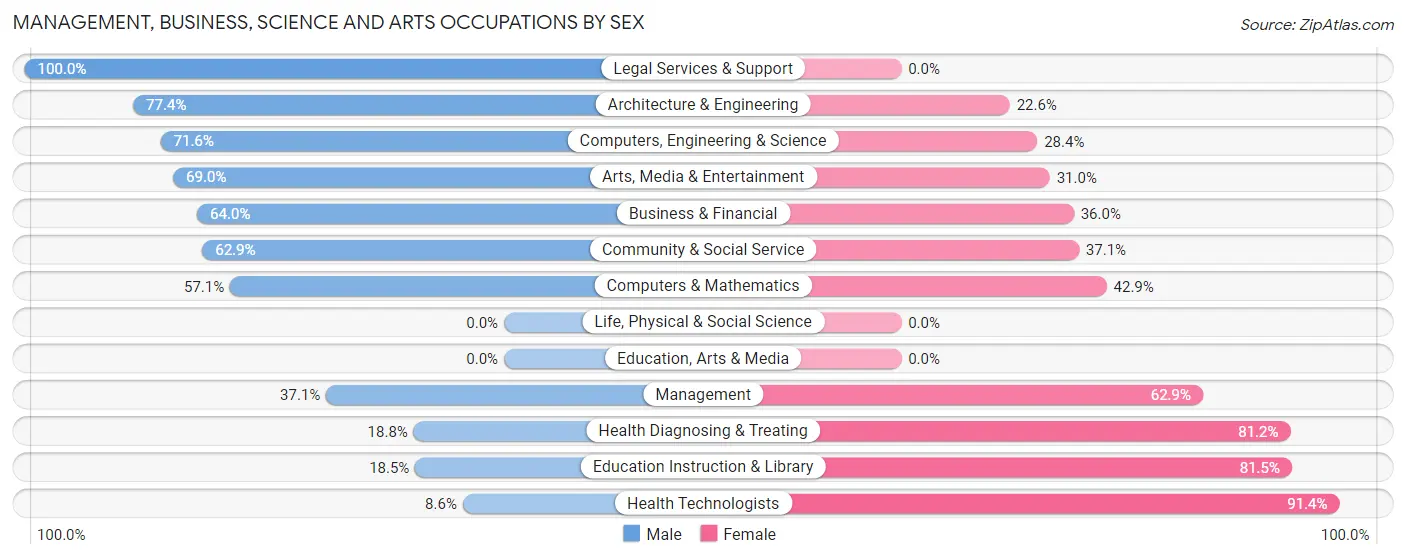
Management, Business, Science and Arts Occupations by Sex
Within the Management, Business, Science and Arts occupations in Chico, the most male-oriented occupations are Legal Services & Support (100.0%), Architecture & Engineering (77.4%), and Computers, Engineering & Science (71.6%), while the most female-oriented occupations are Health Technologists (91.4%), Education Instruction & Library (81.5%), and Health Diagnosing & Treating (81.2%).
| Occupation | Male | Female |
| Management | 56 (37.1%) | 95 (62.9%) |
| Business & Financial | 64 (64.0%) | 36 (36.0%) |
| Computers, Engineering & Science | 106 (71.6%) | 42 (28.4%) |
| Computers & Mathematics | 24 (57.1%) | 18 (42.9%) |
| Architecture & Engineering | 82 (77.4%) | 24 (22.6%) |
| Life, Physical & Social Science | 0 (0.0%) | 0 (0.0%) |
| Community & Social Service | 112 (62.9%) | 66 (37.1%) |
| Education, Arts & Media | 0 (0.0%) | 0 (0.0%) |
| Legal Services & Support | 53 (100.0%) | 0 (0.0%) |
| Education Instruction & Library | 10 (18.5%) | 44 (81.5%) |
| Arts, Media & Entertainment | 49 (69.0%) | 22 (31.0%) |
| Health Diagnosing & Treating | 26 (18.8%) | 112 (81.2%) |
| Health Technologists | 8 (8.6%) | 85 (91.4%) |
| Total (Category) | 364 (50.9%) | 351 (49.1%) |
| Total (Overall) | 671 (49.9%) | 673 (50.1%) |
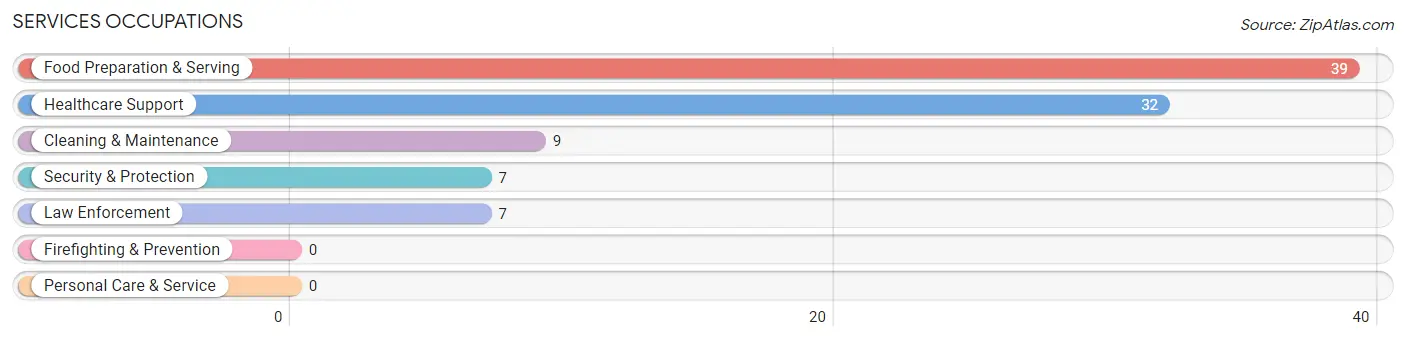
Services Occupations
The most common Services occupations in Chico are Food Preparation & Serving (39 | 2.9%), Healthcare Support (32 | 2.4%), Cleaning & Maintenance (9 | 0.7%), Security & Protection (7 | 0.5%), and Law Enforcement (7 | 0.5%).
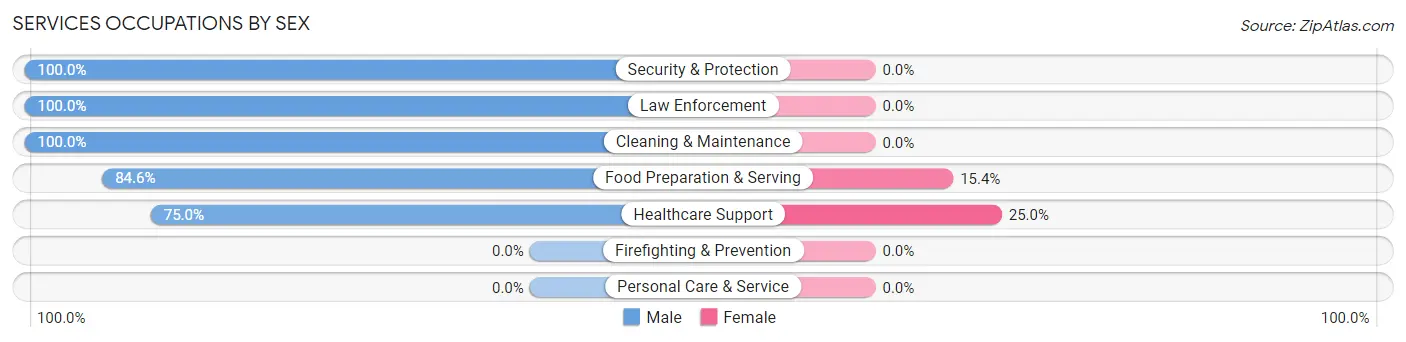
Services Occupations by Sex
Within the Services occupations in Chico, the most male-oriented occupations are Security & Protection (100.0%), Law Enforcement (100.0%), and Cleaning & Maintenance (100.0%), while the most female-oriented occupations are Healthcare Support (25.0%), and Food Preparation & Serving (15.4%).
| Occupation | Male | Female |
| Healthcare Support | 24 (75.0%) | 8 (25.0%) |
| Security & Protection | 7 (100.0%) | 0 (0.0%) |
| Firefighting & Prevention | 0 (0.0%) | 0 (0.0%) |
| Law Enforcement | 7 (100.0%) | 0 (0.0%) |
| Food Preparation & Serving | 33 (84.6%) | 6 (15.4%) |
| Cleaning & Maintenance | 9 (100.0%) | 0 (0.0%) |
| Personal Care & Service | 0 (0.0%) | 0 (0.0%) |
| Total (Category) | 73 (83.9%) | 14 (16.1%) |
| Total (Overall) | 671 (49.9%) | 673 (50.1%) |
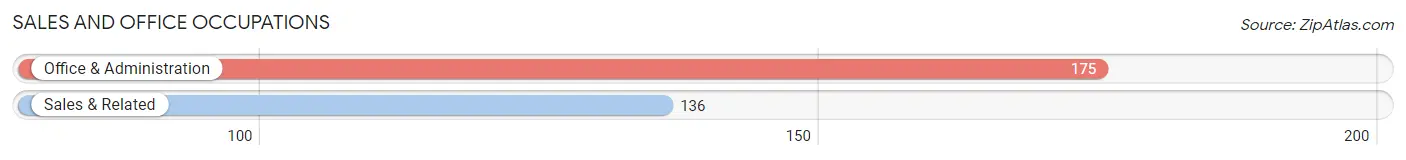
Sales and Office Occupations
The most common Sales and Office occupations in Chico are Office & Administration (175 | 13.0%), and Sales & Related (136 | 10.1%).
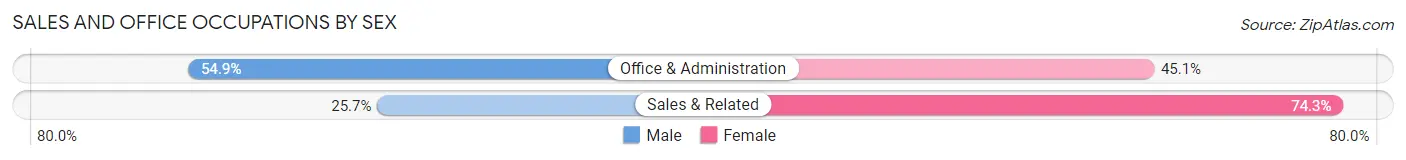
Sales and Office Occupations by Sex
| Occupation | Male | Female |
| Sales & Related | 35 (25.7%) | 101 (74.3%) |
| Office & Administration | 96 (54.9%) | 79 (45.1%) |
| Total (Category) | 131 (42.1%) | 180 (57.9%) |
| Total (Overall) | 671 (49.9%) | 673 (50.1%) |
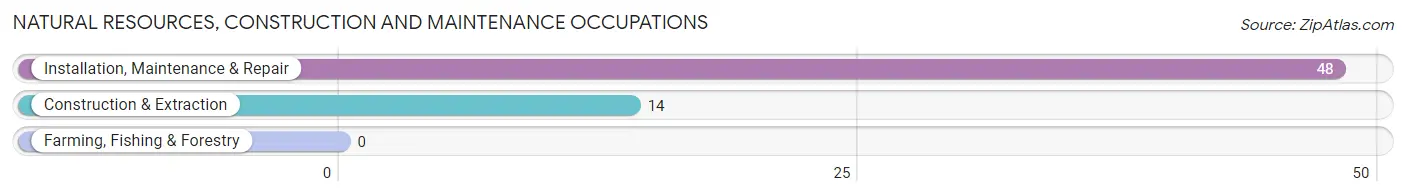
Natural Resources, Construction and Maintenance Occupations
The most common Natural Resources, Construction and Maintenance occupations in Chico are Installation, Maintenance & Repair (48 | 3.6%), and Construction & Extraction (14 | 1.0%).
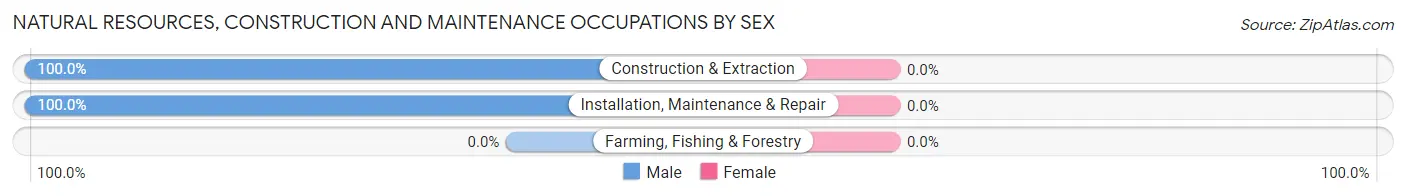
Natural Resources, Construction and Maintenance Occupations by Sex
| Occupation | Male | Female |
| Farming, Fishing & Forestry | 0 (0.0%) | 0 (0.0%) |
| Construction & Extraction | 14 (100.0%) | 0 (0.0%) |
| Installation, Maintenance & Repair | 48 (100.0%) | 0 (0.0%) |
| Total (Category) | 62 (100.0%) | 0 (0.0%) |
| Total (Overall) | 671 (49.9%) | 673 (50.1%) |
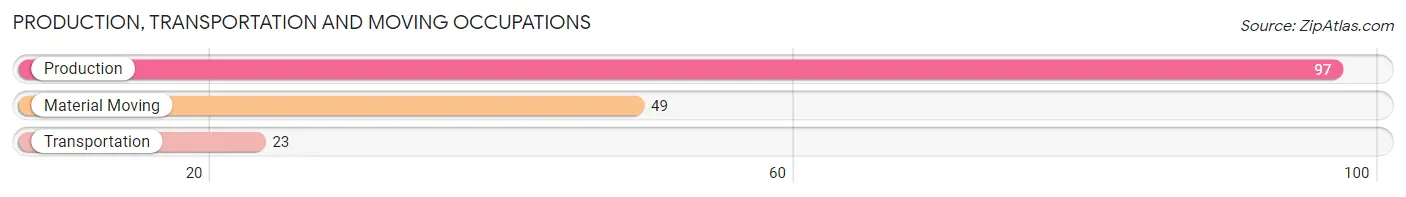
Production, Transportation and Moving Occupations
The most common Production, Transportation and Moving occupations in Chico are Production (97 | 7.2%), Material Moving (49 | 3.6%), and Transportation (23 | 1.7%).
Production, Transportation and Moving Occupations by Sex
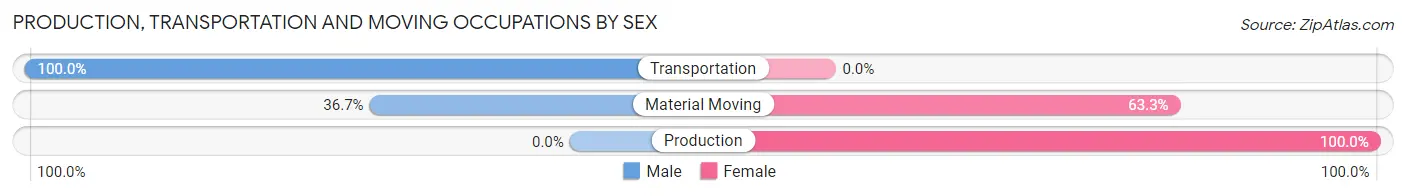
| Occupation | Male | Female |
| Production | 0 (0.0%) | 97 (100.0%) |
| Transportation | 23 (100.0%) | 0 (0.0%) |
| Material Moving | 18 (36.7%) | 31 (63.3%) |
| Total (Category) | 41 (24.3%) | 128 (75.7%) |
| Total (Overall) | 671 (49.9%) | 673 (50.1%) |
Employment Industries by Sex in Chico
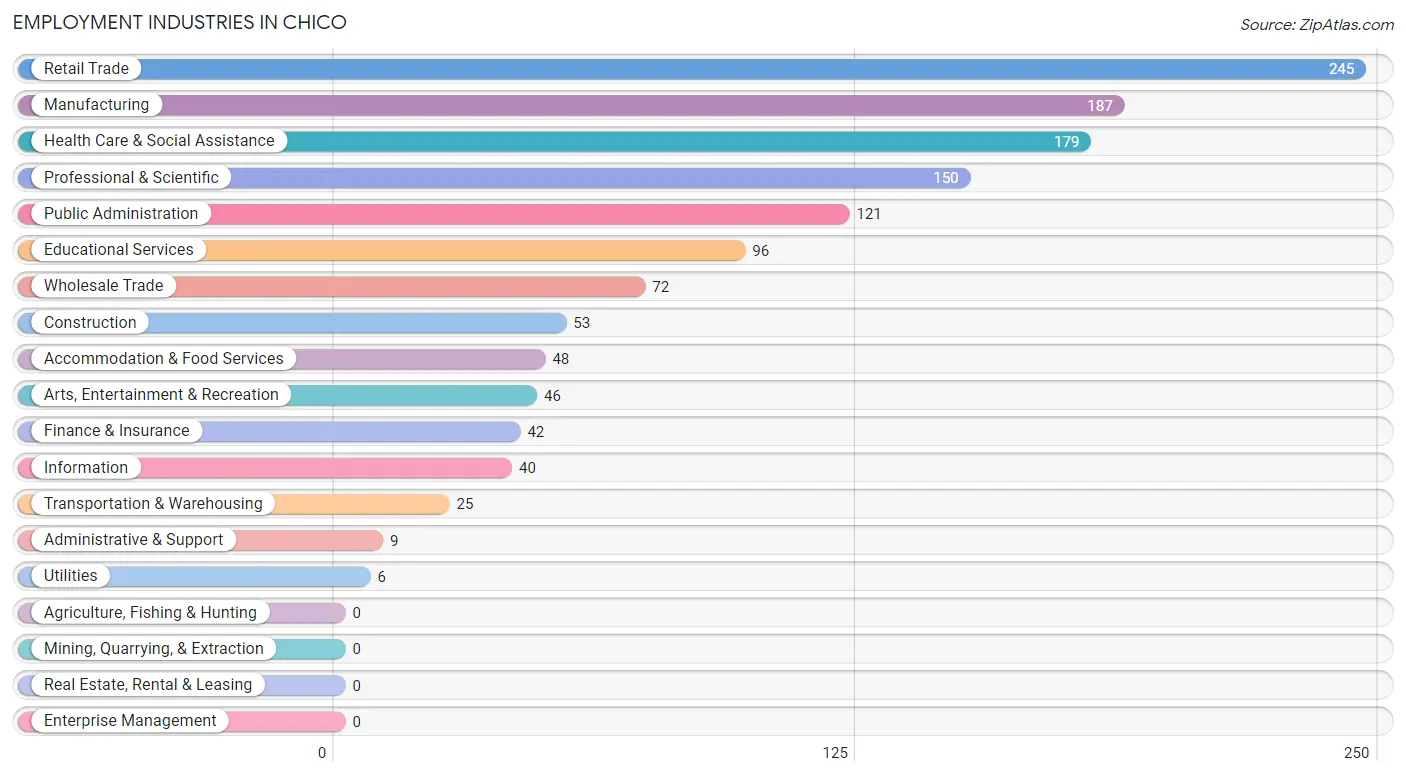
Employment Industries in Chico
The major employment industries in Chico include Retail Trade (245 | 18.2%), Manufacturing (187 | 13.9%), Health Care & Social Assistance (179 | 13.3%), Professional & Scientific (150 | 11.2%), and Public Administration (121 | 9.0%).
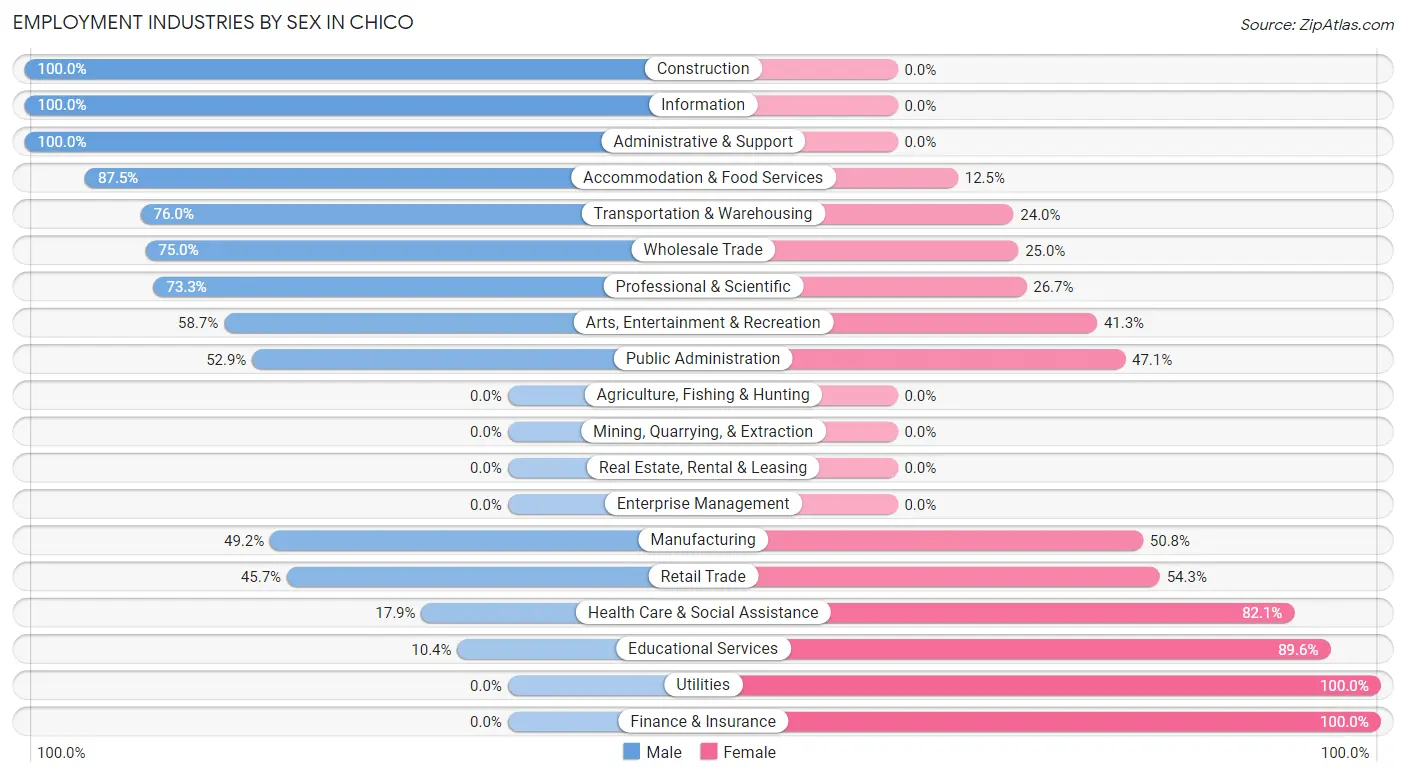
Employment Industries by Sex in Chico
The Chico industries that see more men than women are Construction (100.0%), Information (100.0%), and Administrative & Support (100.0%), whereas the industries that tend to have a higher number of women are Utilities (100.0%), Finance & Insurance (100.0%), and Educational Services (89.6%).
| Industry | Male | Female |
| Agriculture, Fishing & Hunting | 0 (0.0%) | 0 (0.0%) |
| Mining, Quarrying, & Extraction | 0 (0.0%) | 0 (0.0%) |
| Construction | 53 (100.0%) | 0 (0.0%) |
| Manufacturing | 92 (49.2%) | 95 (50.8%) |
| Wholesale Trade | 54 (75.0%) | 18 (25.0%) |
| Retail Trade | 112 (45.7%) | 133 (54.3%) |
| Transportation & Warehousing | 19 (76.0%) | 6 (24.0%) |
| Utilities | 0 (0.0%) | 6 (100.0%) |
| Information | 40 (100.0%) | 0 (0.0%) |
| Finance & Insurance | 0 (0.0%) | 42 (100.0%) |
| Real Estate, Rental & Leasing | 0 (0.0%) | 0 (0.0%) |
| Professional & Scientific | 110 (73.3%) | 40 (26.7%) |
| Enterprise Management | 0 (0.0%) | 0 (0.0%) |
| Administrative & Support | 9 (100.0%) | 0 (0.0%) |
| Educational Services | 10 (10.4%) | 86 (89.6%) |
| Health Care & Social Assistance | 32 (17.9%) | 147 (82.1%) |
| Arts, Entertainment & Recreation | 27 (58.7%) | 19 (41.3%) |
| Accommodation & Food Services | 42 (87.5%) | 6 (12.5%) |
| Public Administration | 64 (52.9%) | 57 (47.1%) |
| Total | 671 (49.9%) | 673 (50.1%) |
Education in Chico
School Enrollment in Chico
The most common levels of schooling among the 814 students in Chico are middle school (249 | 30.6%), elementary school (194 | 23.8%), and high school (185 | 22.7%).
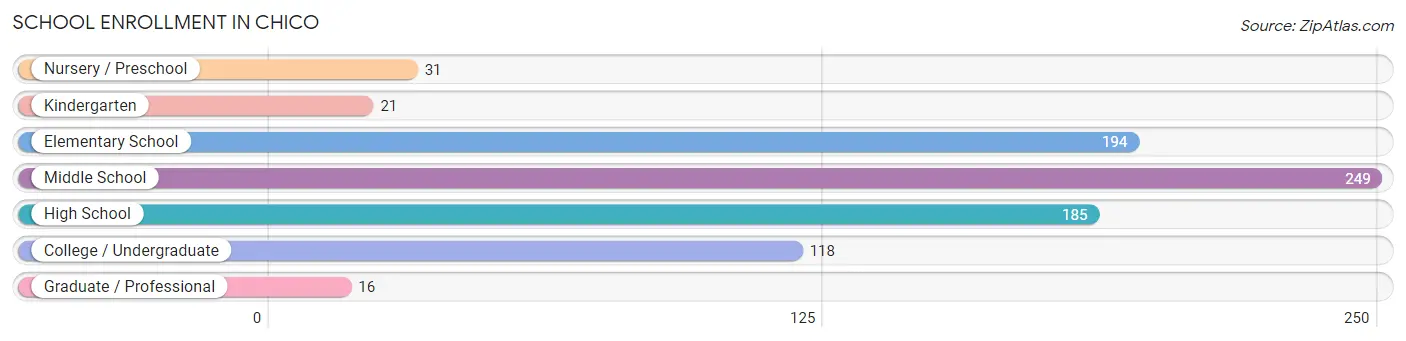
| School Level | # Students | % Students |
| Nursery / Preschool | 31 | 3.8% |
| Kindergarten | 21 | 2.6% |
| Elementary School | 194 | 23.8% |
| Middle School | 249 | 30.6% |
| High School | 185 | 22.7% |
| College / Undergraduate | 118 | 14.5% |
| Graduate / Professional | 16 | 2.0% |
| Total | 814 | 100.0% |
School Enrollment by Age by Funding Source in Chico
Out of a total of 814 students who are enrolled in schools in Chico, 63 (7.7%) attend a private institution, while the remaining 751 (92.3%) are enrolled in public schools. The age group of 3 to 4 year olds has the highest likelihood of being enrolled in private schools, with 13 (41.9% in the age bracket) enrolled. Conversely, the age group of 15 to 17 year olds has the lowest likelihood of being enrolled in a private school, with 138 (100.0% in the age bracket) attending a public institution.
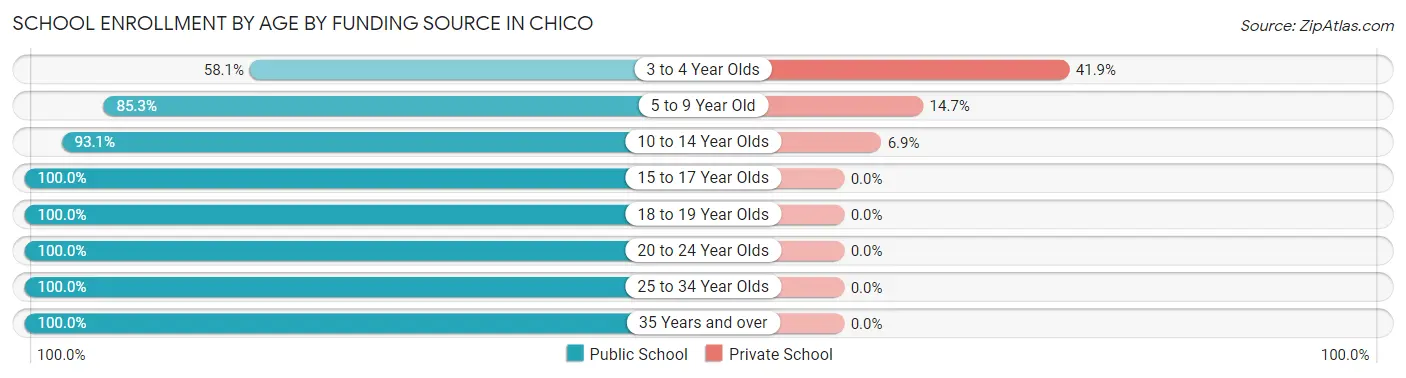
| Age Bracket | Public School | Private School |
| 3 to 4 Year Olds | 18 (58.1%) | 13 (41.9%) |
| 5 to 9 Year Old | 174 (85.3%) | 30 (14.7%) |
| 10 to 14 Year Olds | 270 (93.1%) | 20 (6.9%) |
| 15 to 17 Year Olds | 138 (100.0%) | 0 (0.0%) |
| 18 to 19 Year Olds | 28 (100.0%) | 0 (0.0%) |
| 20 to 24 Year Olds | 33 (100.0%) | 0 (0.0%) |
| 25 to 34 Year Olds | 48 (100.0%) | 0 (0.0%) |
| 35 Years and over | 42 (100.0%) | 0 (0.0%) |
| Total | 751 (92.3%) | 63 (7.7%) |
Educational Attainment by Field of Study in Chico
Engineering (143 | 15.5%), science & technology (135 | 14.6%), bio, nature & agricultural (122 | 13.2%), business (97 | 10.5%), and education (71 | 7.7%) are the most common fields of study among 924 individuals in Chico who have obtained a bachelor's degree or higher.
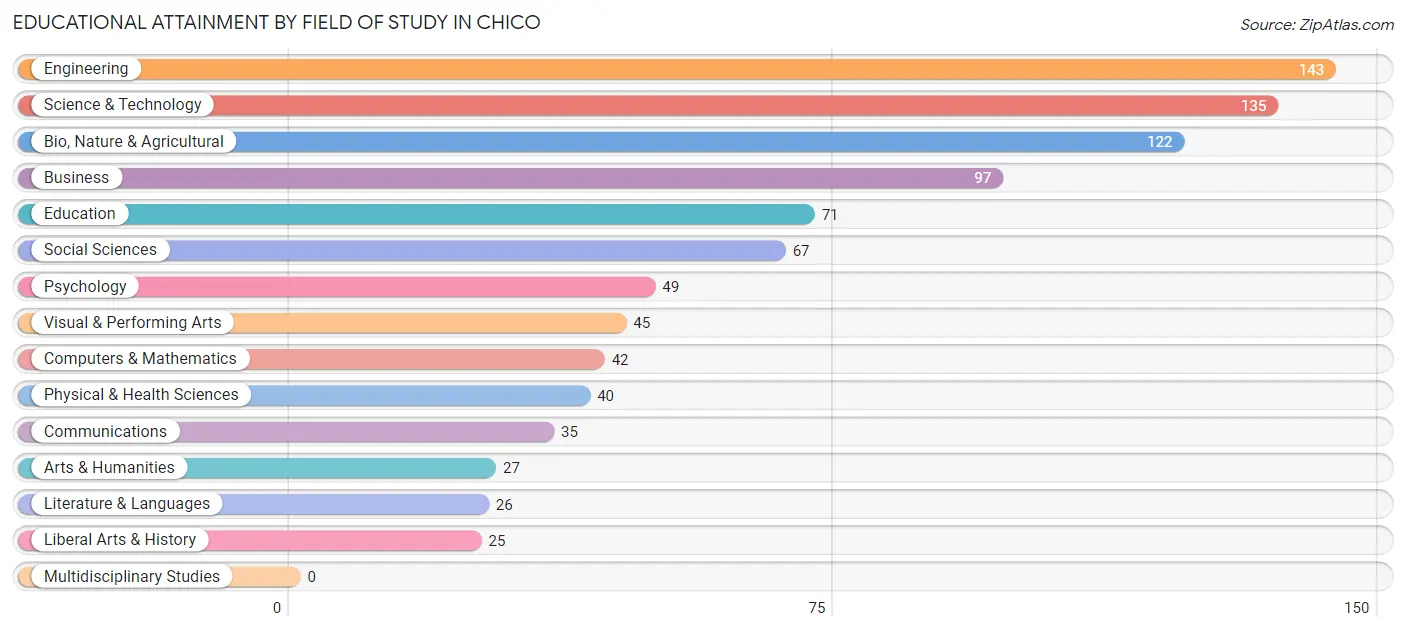
| Field of Study | # Graduates | % Graduates |
| Computers & Mathematics | 42 | 4.5% |
| Bio, Nature & Agricultural | 122 | 13.2% |
| Physical & Health Sciences | 40 | 4.3% |
| Psychology | 49 | 5.3% |
| Social Sciences | 67 | 7.2% |
| Engineering | 143 | 15.5% |
| Multidisciplinary Studies | 0 | 0.0% |
| Science & Technology | 135 | 14.6% |
| Business | 97 | 10.5% |
| Education | 71 | 7.7% |
| Literature & Languages | 26 | 2.8% |
| Liberal Arts & History | 25 | 2.7% |
| Visual & Performing Arts | 45 | 4.9% |
| Communications | 35 | 3.8% |
| Arts & Humanities | 27 | 2.9% |
| Total | 924 | 100.0% |
Transportation & Commute in Chico
Vehicle Availability by Sex in Chico
The most prevalent vehicle ownership categories in Chico are males with 2 vehicles (319, accounting for 43.3%) and females with 2 vehicles (293, making up 50.4%).
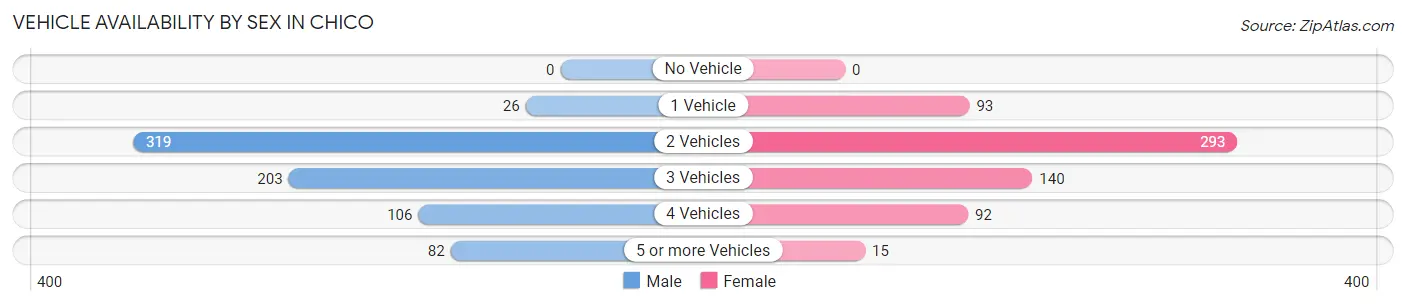
| Vehicles Available | Male | Female |
| No Vehicle | 0 (0.0%) | 0 (0.0%) |
| 1 Vehicle | 26 (3.5%) | 93 (14.7%) |
| 2 Vehicles | 319 (43.3%) | 293 (46.3%) |
| 3 Vehicles | 203 (27.6%) | 140 (22.1%) |
| 4 Vehicles | 106 (14.4%) | 92 (14.5%) |
| 5 or more Vehicles | 82 (11.1%) | 15 (2.4%) |
| Total | 736 (100.0%) | 633 (100.0%) |
Commute Time in Chico
The most frequently occuring commute durations in Chico are 15 to 19 minutes (278 commuters, 24.2%), 10 to 14 minutes (236 commuters, 20.5%), and 20 to 24 minutes (176 commuters, 15.3%).
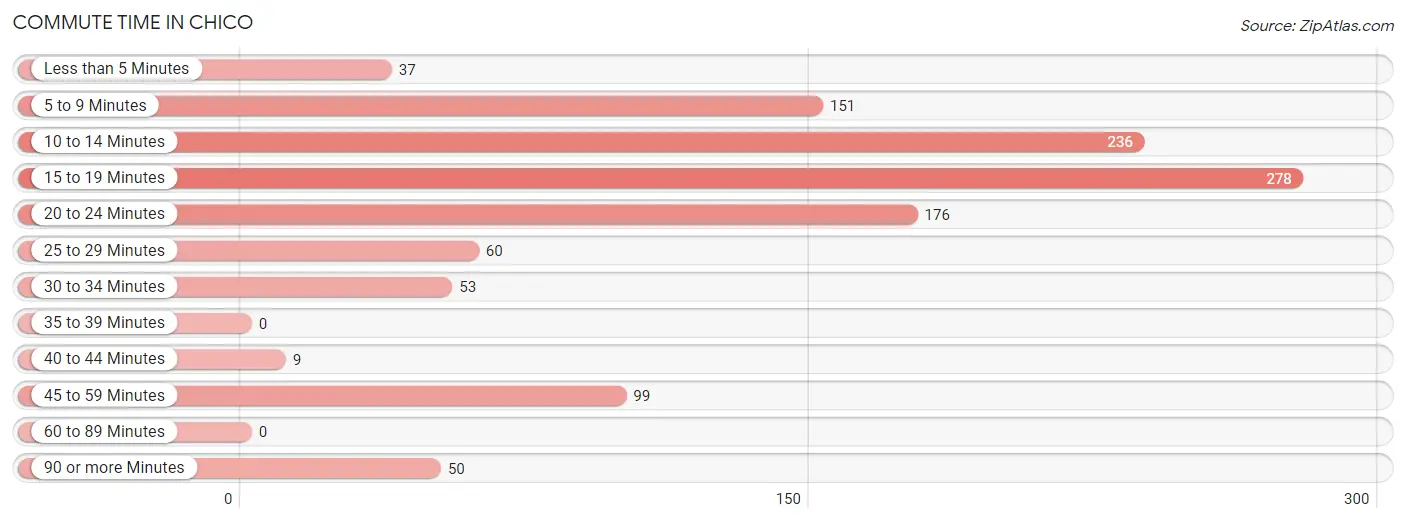
| Commute Time | # Commuters | % Commuters |
| Less than 5 Minutes | 37 | 3.2% |
| 5 to 9 Minutes | 151 | 13.1% |
| 10 to 14 Minutes | 236 | 20.5% |
| 15 to 19 Minutes | 278 | 24.2% |
| 20 to 24 Minutes | 176 | 15.3% |
| 25 to 29 Minutes | 60 | 5.2% |
| 30 to 34 Minutes | 53 | 4.6% |
| 35 to 39 Minutes | 0 | 0.0% |
| 40 to 44 Minutes | 9 | 0.8% |
| 45 to 59 Minutes | 99 | 8.6% |
| 60 to 89 Minutes | 0 | 0.0% |
| 90 or more Minutes | 50 | 4.3% |
Commute Time by Sex in Chico
The most common commute times in Chico are 10 to 14 minutes (185 commuters, 28.7%) for males and 15 to 19 minutes (154 commuters, 30.6%) for females.
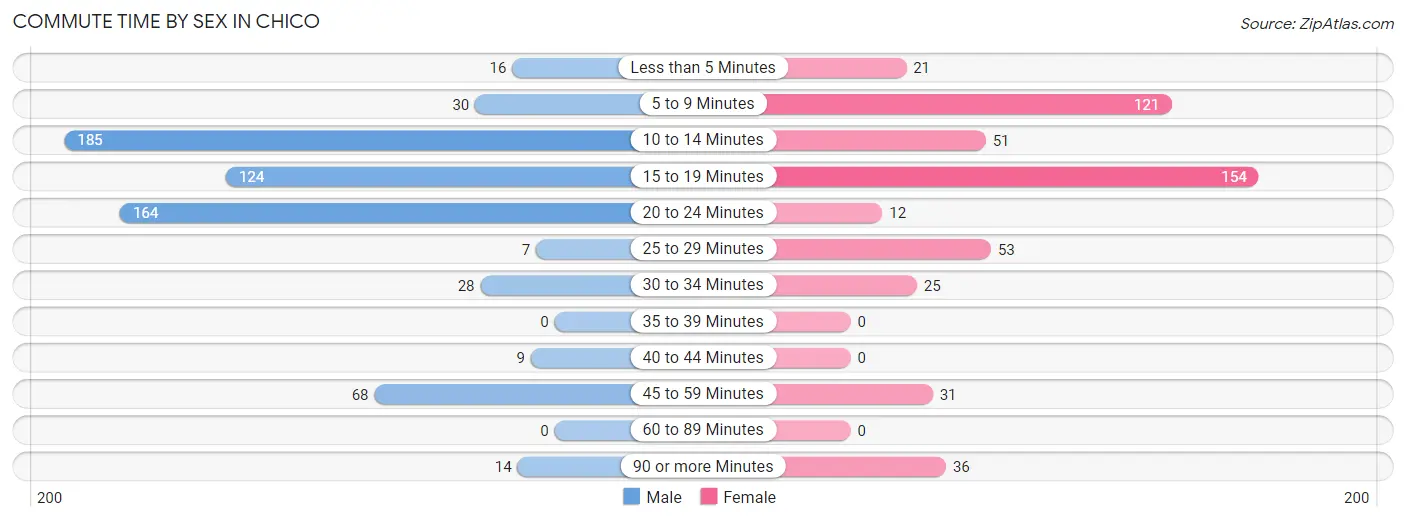
| Commute Time | Male | Female |
| Less than 5 Minutes | 16 (2.5%) | 21 (4.2%) |
| 5 to 9 Minutes | 30 (4.6%) | 121 (24.0%) |
| 10 to 14 Minutes | 185 (28.7%) | 51 (10.1%) |
| 15 to 19 Minutes | 124 (19.2%) | 154 (30.6%) |
| 20 to 24 Minutes | 164 (25.4%) | 12 (2.4%) |
| 25 to 29 Minutes | 7 (1.1%) | 53 (10.5%) |
| 30 to 34 Minutes | 28 (4.3%) | 25 (5.0%) |
| 35 to 39 Minutes | 0 (0.0%) | 0 (0.0%) |
| 40 to 44 Minutes | 9 (1.4%) | 0 (0.0%) |
| 45 to 59 Minutes | 68 (10.5%) | 31 (6.1%) |
| 60 to 89 Minutes | 0 (0.0%) | 0 (0.0%) |
| 90 or more Minutes | 14 (2.2%) | 36 (7.1%) |
Time of Departure to Work by Sex in Chico
The most frequent times of departure to work in Chico are 7:00 AM to 7:29 AM (131, 20.3%) for males and 7:30 AM to 7:59 AM (107, 21.2%) for females.
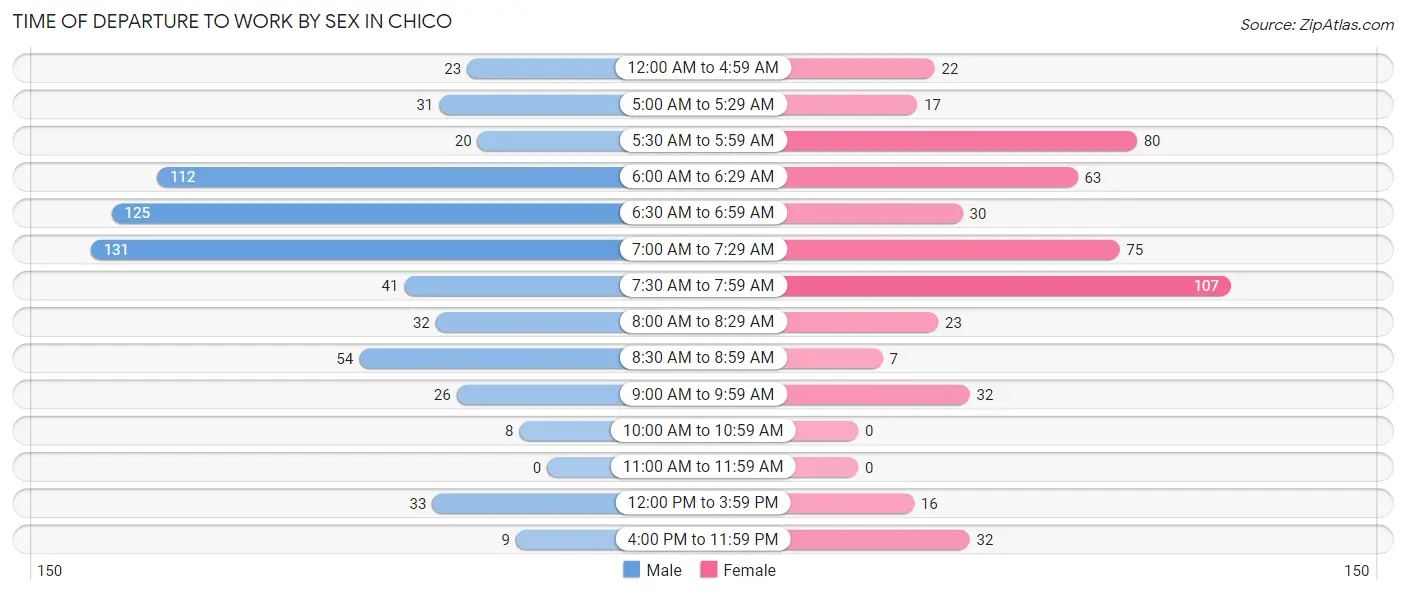
| Time of Departure | Male | Female |
| 12:00 AM to 4:59 AM | 23 (3.6%) | 22 (4.4%) |
| 5:00 AM to 5:29 AM | 31 (4.8%) | 17 (3.4%) |
| 5:30 AM to 5:59 AM | 20 (3.1%) | 80 (15.9%) |
| 6:00 AM to 6:29 AM | 112 (17.4%) | 63 (12.5%) |
| 6:30 AM to 6:59 AM | 125 (19.4%) | 30 (5.9%) |
| 7:00 AM to 7:29 AM | 131 (20.3%) | 75 (14.9%) |
| 7:30 AM to 7:59 AM | 41 (6.4%) | 107 (21.2%) |
| 8:00 AM to 8:29 AM | 32 (5.0%) | 23 (4.6%) |
| 8:30 AM to 8:59 AM | 54 (8.4%) | 7 (1.4%) |
| 9:00 AM to 9:59 AM | 26 (4.0%) | 32 (6.4%) |
| 10:00 AM to 10:59 AM | 8 (1.2%) | 0 (0.0%) |
| 11:00 AM to 11:59 AM | 0 (0.0%) | 0 (0.0%) |
| 12:00 PM to 3:59 PM | 33 (5.1%) | 16 (3.2%) |
| 4:00 PM to 11:59 PM | 9 (1.4%) | 32 (6.4%) |
| Total | 645 (100.0%) | 504 (100.0%) |
Housing Occupancy in Chico
Occupancy by Ownership in Chico
Of the total 1,165 dwellings in Chico, owner-occupied units account for 1,002 (86.0%), while renter-occupied units make up 163 (14.0%).
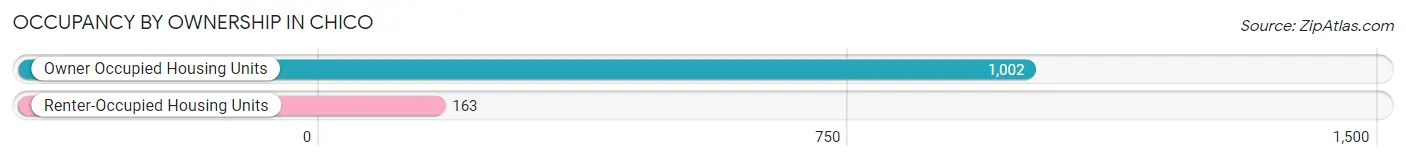
| Occupancy | # Housing Units | % Housing Units |
| Owner Occupied Housing Units | 1,002 | 86.0% |
| Renter-Occupied Housing Units | 163 | 14.0% |
| Total Occupied Housing Units | 1,165 | 100.0% |
Occupancy by Household Size in Chico
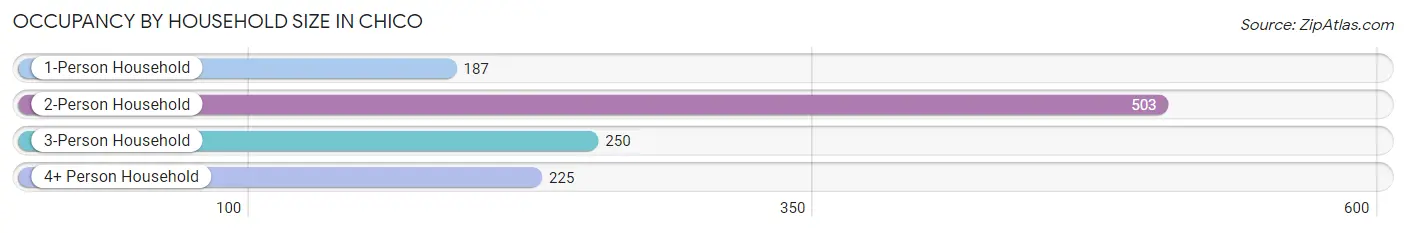
| Household Size | # Housing Units | % Housing Units |
| 1-Person Household | 187 | 16.1% |
| 2-Person Household | 503 | 43.2% |
| 3-Person Household | 250 | 21.5% |
| 4+ Person Household | 225 | 19.3% |
| Total Housing Units | 1,165 | 100.0% |
Occupancy by Ownership by Household Size in Chico
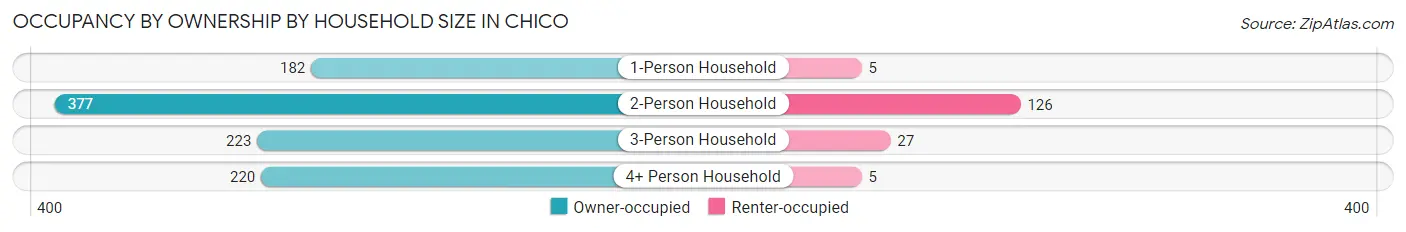
| Household Size | Owner-occupied | Renter-occupied |
| 1-Person Household | 182 (97.3%) | 5 (2.7%) |
| 2-Person Household | 377 (75.0%) | 126 (25.1%) |
| 3-Person Household | 223 (89.2%) | 27 (10.8%) |
| 4+ Person Household | 220 (97.8%) | 5 (2.2%) |
| Total Housing Units | 1,002 (86.0%) | 163 (14.0%) |
Occupancy by Educational Attainment in Chico
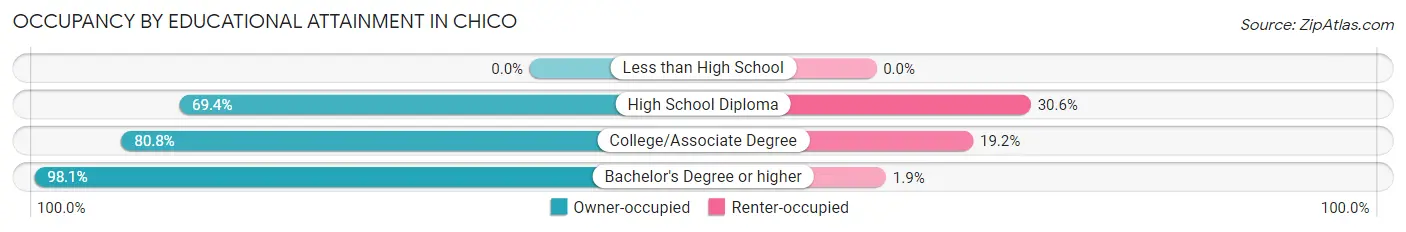
| Household Size | Owner-occupied | Renter-occupied |
| Less than High School | 0 (0.0%) | 0 (0.0%) |
| High School Diploma | 120 (69.4%) | 53 (30.6%) |
| College/Associate Degree | 425 (80.8%) | 101 (19.2%) |
| Bachelor's Degree or higher | 457 (98.1%) | 9 (1.9%) |
Occupancy by Age of Householder in Chico
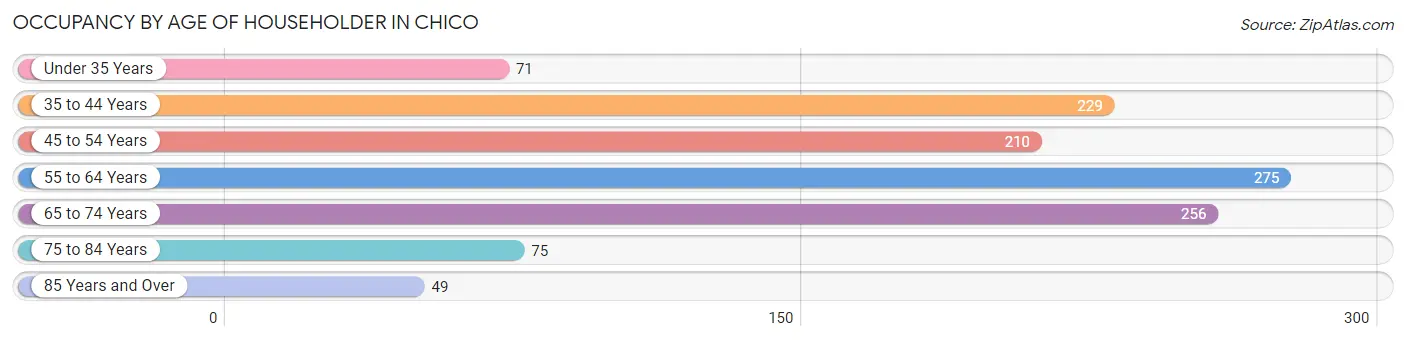
| Age Bracket | # Households | % Households |
| Under 35 Years | 71 | 6.1% |
| 35 to 44 Years | 229 | 19.7% |
| 45 to 54 Years | 210 | 18.0% |
| 55 to 64 Years | 275 | 23.6% |
| 65 to 74 Years | 256 | 22.0% |
| 75 to 84 Years | 75 | 6.4% |
| 85 Years and Over | 49 | 4.2% |
| Total | 1,165 | 100.0% |
Housing Finances in Chico
Median Income by Occupancy in Chico
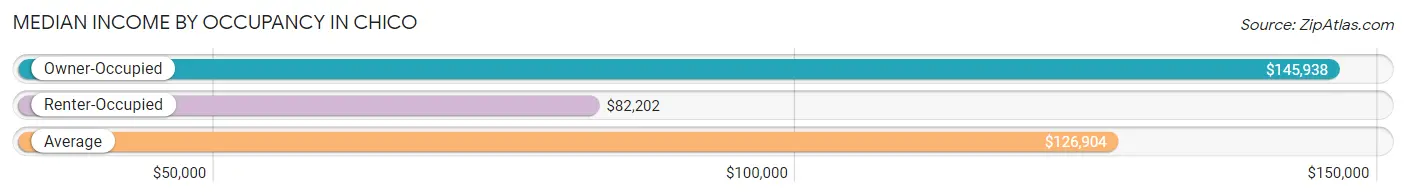
| Occupancy Type | # Households | Median Income |
| Owner-Occupied | 1,002 (86.0%) | $145,938 |
| Renter-Occupied | 163 (14.0%) | $82,202 |
| Average | 1,165 (100.0%) | $126,904 |
Occupancy by Householder Income Bracket in Chico
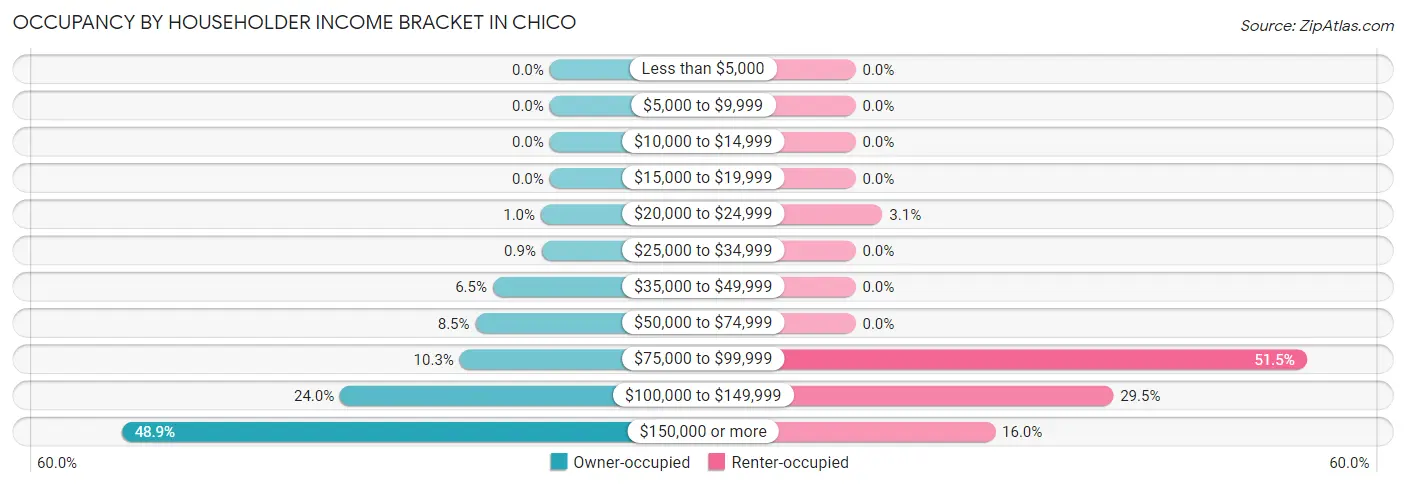
| Income Bracket | Owner-occupied | Renter-occupied |
| Less than $5,000 | 0 (0.0%) | 0 (0.0%) |
| $5,000 to $9,999 | 0 (0.0%) | 0 (0.0%) |
| $10,000 to $14,999 | 0 (0.0%) | 0 (0.0%) |
| $15,000 to $19,999 | 0 (0.0%) | 0 (0.0%) |
| $20,000 to $24,999 | 10 (1.0%) | 5 (3.1%) |
| $25,000 to $34,999 | 9 (0.9%) | 0 (0.0%) |
| $35,000 to $49,999 | 65 (6.5%) | 0 (0.0%) |
| $50,000 to $74,999 | 85 (8.5%) | 0 (0.0%) |
| $75,000 to $99,999 | 103 (10.3%) | 84 (51.5%) |
| $100,000 to $149,999 | 240 (23.9%) | 48 (29.4%) |
| $150,000 or more | 490 (48.9%) | 26 (16.0%) |
| Total | 1,002 (100.0%) | 163 (100.0%) |
Monthly Housing Cost Tiers in Chico
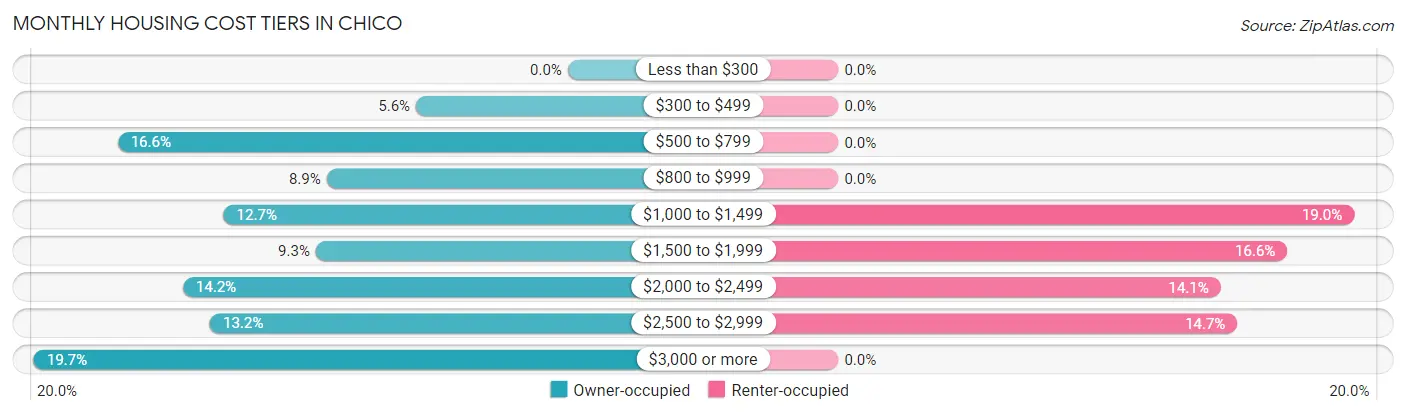
| Monthly Cost | Owner-occupied | Renter-occupied |
| Less than $300 | 0 (0.0%) | 0 (0.0%) |
| $300 to $499 | 56 (5.6%) | 0 (0.0%) |
| $500 to $799 | 166 (16.6%) | 0 (0.0%) |
| $800 to $999 | 89 (8.9%) | 0 (0.0%) |
| $1,000 to $1,499 | 127 (12.7%) | 31 (19.0%) |
| $1,500 to $1,999 | 93 (9.3%) | 27 (16.6%) |
| $2,000 to $2,499 | 142 (14.2%) | 23 (14.1%) |
| $2,500 to $2,999 | 132 (13.2%) | 24 (14.7%) |
| $3,000 or more | 197 (19.7%) | 0 (0.0%) |
| Total | 1,002 (100.0%) | 163 (100.0%) |
Physical Housing Characteristics in Chico
Housing Structures in Chico
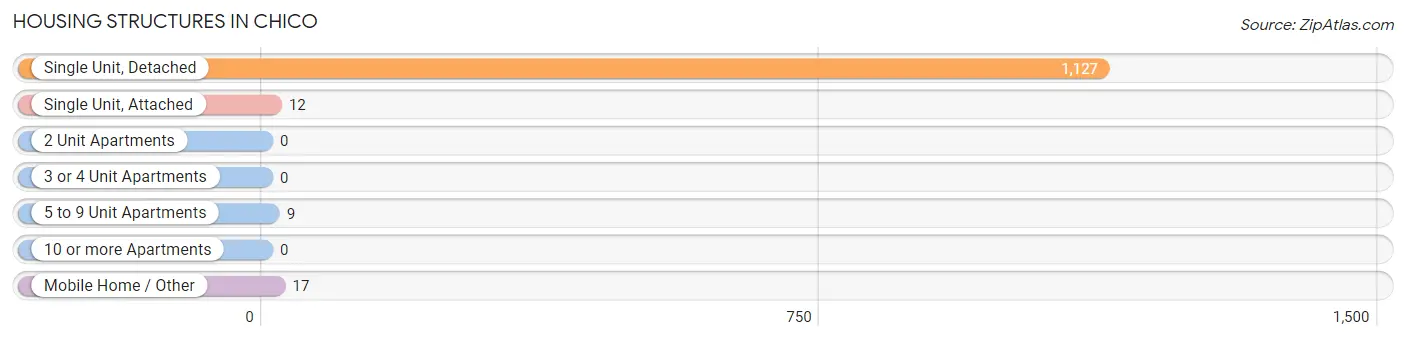
| Structure Type | # Housing Units | % Housing Units |
| Single Unit, Detached | 1,127 | 96.7% |
| Single Unit, Attached | 12 | 1.0% |
| 2 Unit Apartments | 0 | 0.0% |
| 3 or 4 Unit Apartments | 0 | 0.0% |
| 5 to 9 Unit Apartments | 9 | 0.8% |
| 10 or more Apartments | 0 | 0.0% |
| Mobile Home / Other | 17 | 1.5% |
| Total | 1,165 | 100.0% |
Housing Structures by Occupancy in Chico
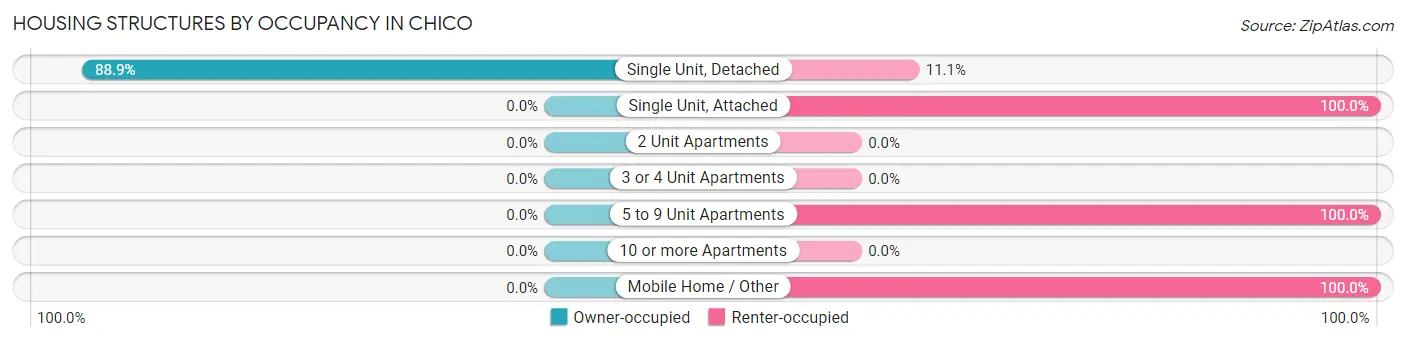
| Structure Type | Owner-occupied | Renter-occupied |
| Single Unit, Detached | 1,002 (88.9%) | 125 (11.1%) |
| Single Unit, Attached | 0 (0.0%) | 12 (100.0%) |
| 2 Unit Apartments | 0 (0.0%) | 0 (0.0%) |
| 3 or 4 Unit Apartments | 0 (0.0%) | 0 (0.0%) |
| 5 to 9 Unit Apartments | 0 (0.0%) | 9 (100.0%) |
| 10 or more Apartments | 0 (0.0%) | 0 (0.0%) |
| Mobile Home / Other | 0 (0.0%) | 17 (100.0%) |
| Total | 1,002 (86.0%) | 163 (14.0%) |
Housing Structures by Number of Rooms in Chico
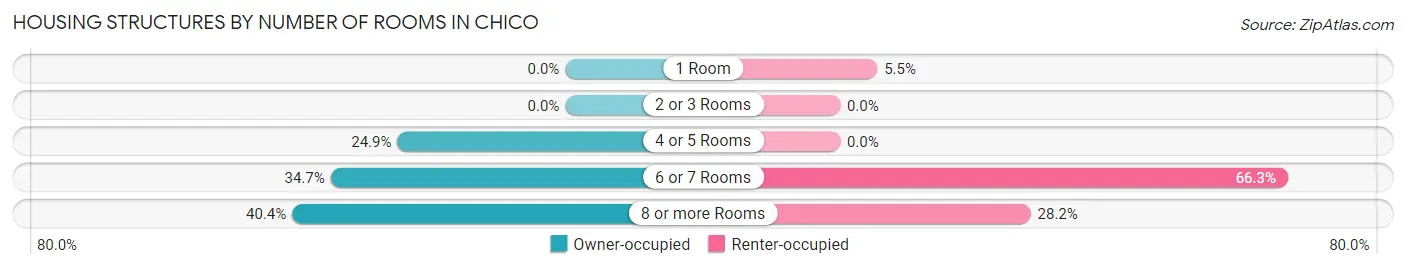
| Number of Rooms | Owner-occupied | Renter-occupied |
| 1 Room | 0 (0.0%) | 9 (5.5%) |
| 2 or 3 Rooms | 0 (0.0%) | 0 (0.0%) |
| 4 or 5 Rooms | 249 (24.8%) | 0 (0.0%) |
| 6 or 7 Rooms | 348 (34.7%) | 108 (66.3%) |
| 8 or more Rooms | 405 (40.4%) | 46 (28.2%) |
| Total | 1,002 (100.0%) | 163 (100.0%) |
Housing Structure by Heating Type in Chico
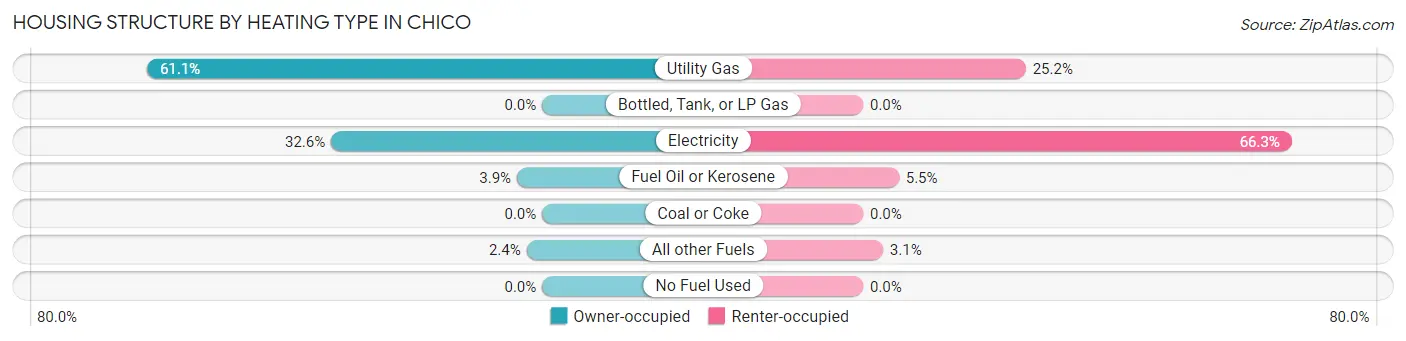
| Heating Type | Owner-occupied | Renter-occupied |
| Utility Gas | 612 (61.1%) | 41 (25.2%) |
| Bottled, Tank, or LP Gas | 0 (0.0%) | 0 (0.0%) |
| Electricity | 327 (32.6%) | 108 (66.3%) |
| Fuel Oil or Kerosene | 39 (3.9%) | 9 (5.5%) |
| Coal or Coke | 0 (0.0%) | 0 (0.0%) |
| All other Fuels | 24 (2.4%) | 5 (3.1%) |
| No Fuel Used | 0 (0.0%) | 0 (0.0%) |
| Total | 1,002 (100.0%) | 163 (100.0%) |
Household Vehicle Usage in Chico
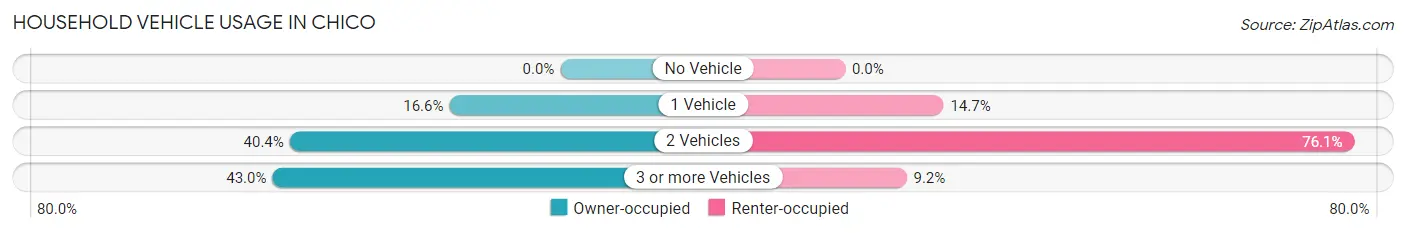
| Vehicles per Household | Owner-occupied | Renter-occupied |
| No Vehicle | 0 (0.0%) | 0 (0.0%) |
| 1 Vehicle | 166 (16.6%) | 24 (14.7%) |
| 2 Vehicles | 405 (40.4%) | 124 (76.1%) |
| 3 or more Vehicles | 431 (43.0%) | 15 (9.2%) |
| Total | 1,002 (100.0%) | 163 (100.0%) |
Real Estate & Mortgages in Chico
Real Estate and Mortgage Overview in Chico
| Characteristic | Without Mortgage | With Mortgage |
| Housing Units | 351 | 651 |
| Median Property Value | $605,800 | $590,100 |
| Median Household Income | $125,432 | $372 |
| Monthly Housing Costs | $769 | $197 |
| Real Estate Taxes | $5,558 | $0 |
Property Value by Mortgage Status in Chico
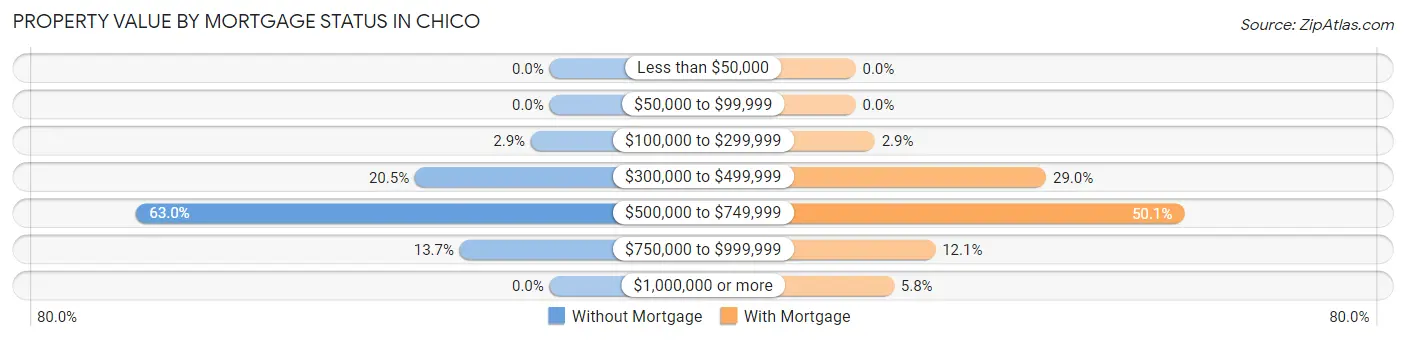
| Property Value | Without Mortgage | With Mortgage |
| Less than $50,000 | 0 (0.0%) | 0 (0.0%) |
| $50,000 to $99,999 | 0 (0.0%) | 0 (0.0%) |
| $100,000 to $299,999 | 10 (2.9%) | 19 (2.9%) |
| $300,000 to $499,999 | 72 (20.5%) | 189 (29.0%) |
| $500,000 to $749,999 | 221 (63.0%) | 326 (50.1%) |
| $750,000 to $999,999 | 48 (13.7%) | 79 (12.1%) |
| $1,000,000 or more | 0 (0.0%) | 38 (5.8%) |
| Total | 351 (100.0%) | 651 (100.0%) |
Household Income by Mortgage Status in Chico
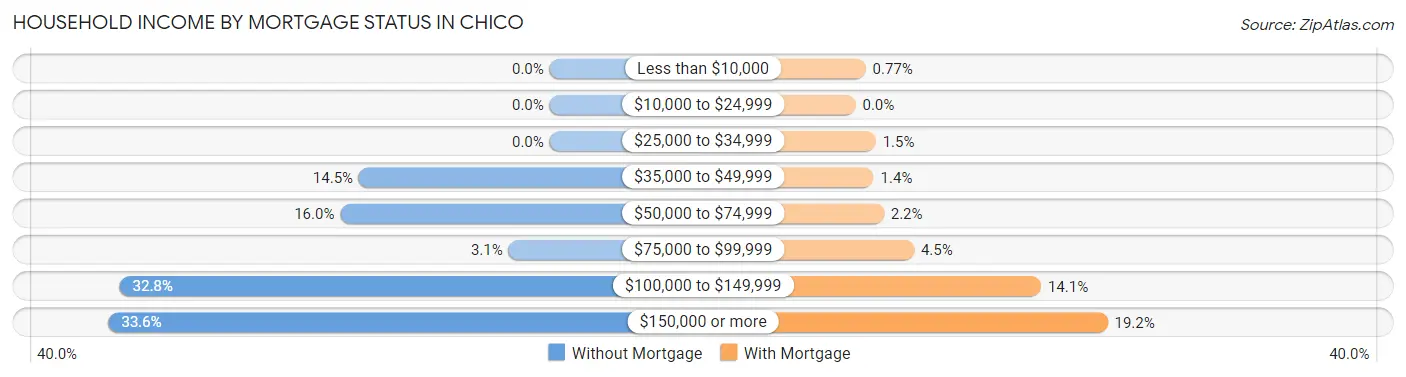
| Household Income | Without Mortgage | With Mortgage |
| Less than $10,000 | 0 (0.0%) | 5 (0.8%) |
| $10,000 to $24,999 | 0 (0.0%) | 0 (0.0%) |
| $25,000 to $34,999 | 0 (0.0%) | 10 (1.5%) |
| $35,000 to $49,999 | 51 (14.5%) | 9 (1.4%) |
| $50,000 to $74,999 | 56 (16.0%) | 14 (2.1%) |
| $75,000 to $99,999 | 11 (3.1%) | 29 (4.4%) |
| $100,000 to $149,999 | 115 (32.8%) | 92 (14.1%) |
| $150,000 or more | 118 (33.6%) | 125 (19.2%) |
| Total | 351 (100.0%) | 651 (100.0%) |
Property Value to Household Income Ratio in Chico
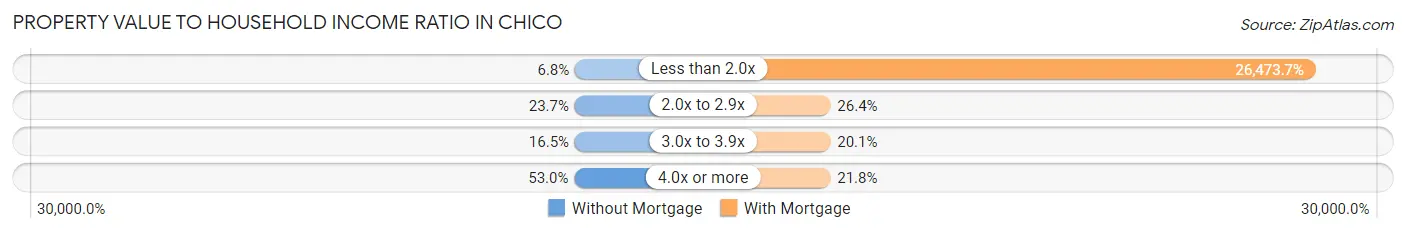
| Value-to-Income Ratio | Without Mortgage | With Mortgage |
| Less than 2.0x | 24 (6.8%) | 172,344 (26,473.7%) |
| 2.0x to 2.9x | 83 (23.6%) | 172 (26.4%) |
| 3.0x to 3.9x | 58 (16.5%) | 131 (20.1%) |
| 4.0x or more | 186 (53.0%) | 142 (21.8%) |
| Total | 351 (100.0%) | 651 (100.0%) |
Real Estate Taxes by Mortgage Status in Chico

| Property Taxes | Without Mortgage | With Mortgage |
| Less than $800 | 0 (0.0%) | 0 (0.0%) |
| $800 to $1,499 | 0 (0.0%) | 0 (0.0%) |
| $800 to $1,499 | 351 (100.0%) | 49 (7.5%) |
| Total | 351 (100.0%) | 651 (100.0%) |
Health & Disability in Chico
Health Insurance Coverage by Age in Chico
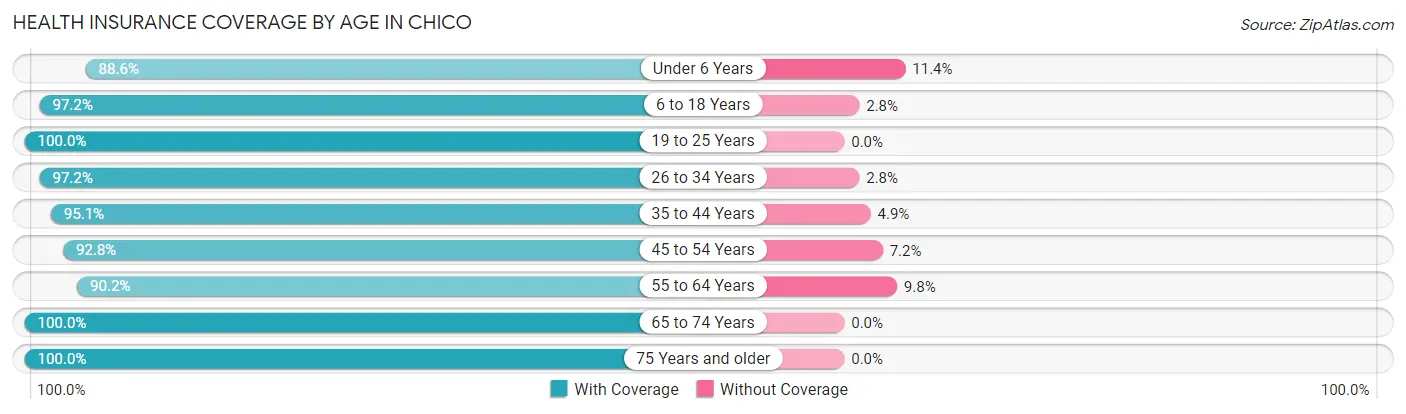
| Age Bracket | With Coverage | Without Coverage |
| Under 6 Years | 70 (88.6%) | 9 (11.4%) |
| 6 to 18 Years | 625 (97.2%) | 18 (2.8%) |
| 19 to 25 Years | 102 (100.0%) | 0 (0.0%) |
| 26 to 34 Years | 174 (97.2%) | 5 (2.8%) |
| 35 to 44 Years | 368 (95.1%) | 19 (4.9%) |
| 45 to 54 Years | 376 (92.8%) | 29 (7.2%) |
| 55 to 64 Years | 423 (90.2%) | 46 (9.8%) |
| 65 to 74 Years | 396 (100.0%) | 0 (0.0%) |
| 75 Years and older | 325 (100.0%) | 0 (0.0%) |
| Total | 2,859 (95.8%) | 126 (4.2%) |
Health Insurance Coverage by Citizenship Status in Chico
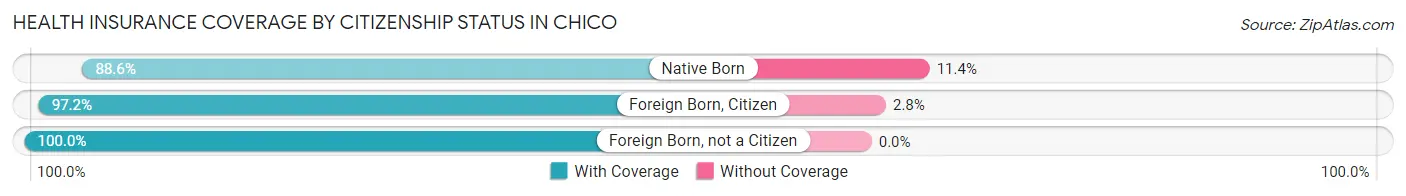
| Citizenship Status | With Coverage | Without Coverage |
| Native Born | 70 (88.6%) | 9 (11.4%) |
| Foreign Born, Citizen | 625 (97.2%) | 18 (2.8%) |
| Foreign Born, not a Citizen | 102 (100.0%) | 0 (0.0%) |
Health Insurance Coverage by Household Income in Chico
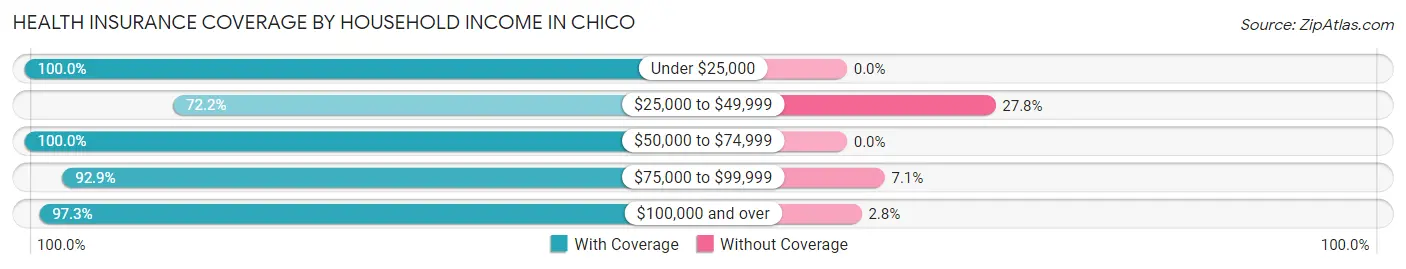
| Household Income | With Coverage | Without Coverage |
| Under $25,000 | 26 (100.0%) | 0 (0.0%) |
| $25,000 to $49,999 | 83 (72.2%) | 32 (27.8%) |
| $50,000 to $74,999 | 161 (100.0%) | 0 (0.0%) |
| $75,000 to $99,999 | 434 (92.9%) | 33 (7.1%) |
| $100,000 and over | 2,155 (97.3%) | 61 (2.8%) |
Public vs Private Health Insurance Coverage by Age in Chico
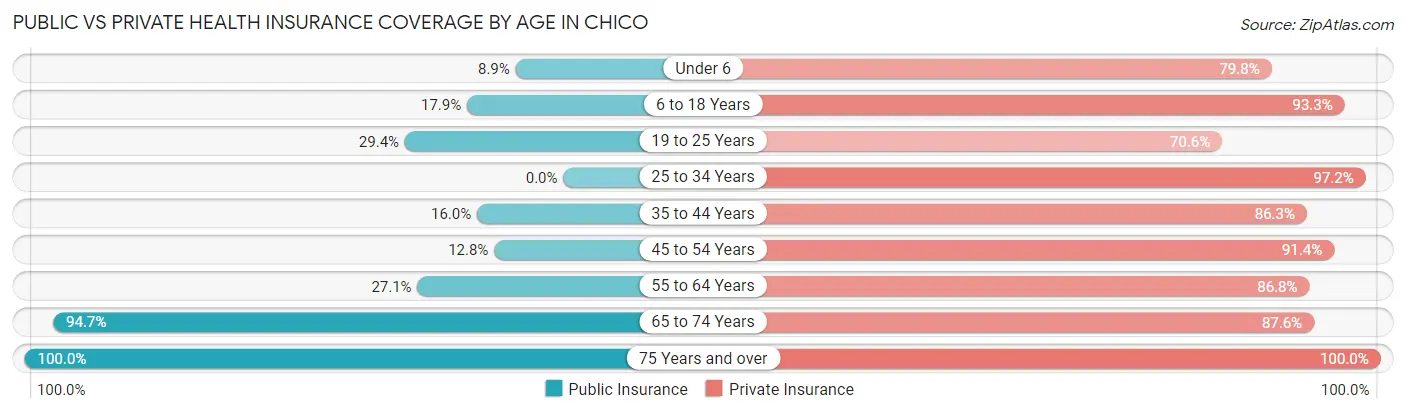
| Age Bracket | Public Insurance | Private Insurance |
| Under 6 | 7 (8.9%) | 63 (79.7%) |
| 6 to 18 Years | 115 (17.9%) | 600 (93.3%) |
| 19 to 25 Years | 30 (29.4%) | 72 (70.6%) |
| 25 to 34 Years | 0 (0.0%) | 174 (97.2%) |
| 35 to 44 Years | 62 (16.0%) | 334 (86.3%) |
| 45 to 54 Years | 52 (12.8%) | 370 (91.4%) |
| 55 to 64 Years | 127 (27.1%) | 407 (86.8%) |
| 65 to 74 Years | 375 (94.7%) | 347 (87.6%) |
| 75 Years and over | 325 (100.0%) | 325 (100.0%) |
| Total | 1,093 (36.6%) | 2,692 (90.2%) |
Disability Status by Sex by Age in Chico
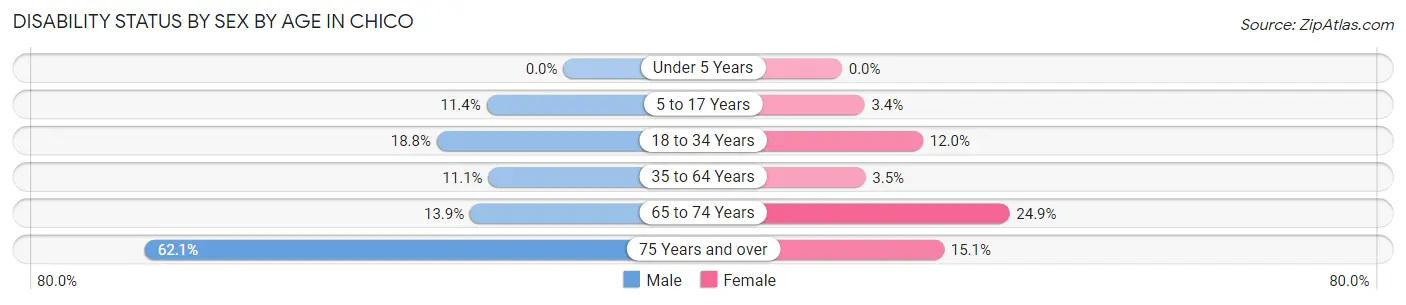
| Age Bracket | Male | Female |
| Under 5 Years | 0 (0.0%) | 0 (0.0%) |
| 5 to 17 Years | 49 (11.4%) | 7 (3.4%) |
| 18 to 34 Years | 31 (18.8%) | 16 (12.0%) |
| 35 to 64 Years | 64 (11.1%) | 24 (3.5%) |
| 65 to 74 Years | 27 (13.9%) | 50 (24.9%) |
| 75 Years and over | 87 (62.1%) | 28 (15.1%) |
Disability Class by Sex by Age in Chico
Disability Class: Hearing Difficulty
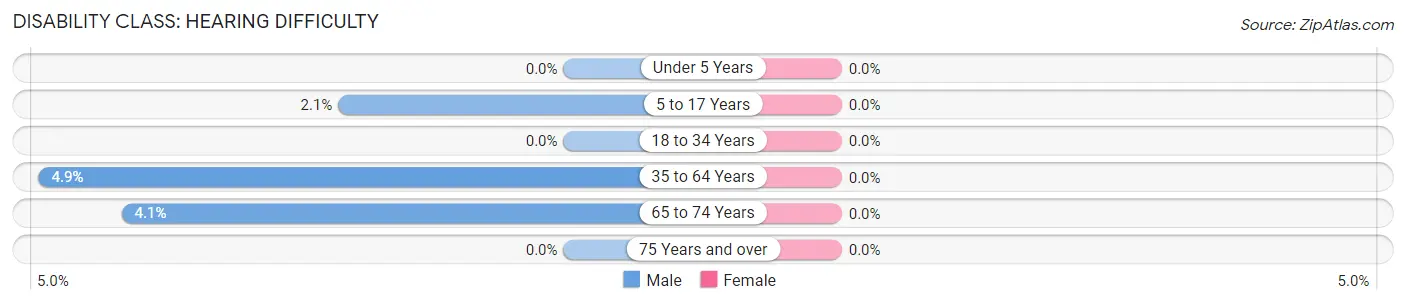
| Age Bracket | Male | Female |
| Under 5 Years | 0 (0.0%) | 0 (0.0%) |
| 5 to 17 Years | 9 (2.1%) | 0 (0.0%) |
| 18 to 34 Years | 0 (0.0%) | 0 (0.0%) |
| 35 to 64 Years | 28 (4.9%) | 0 (0.0%) |
| 65 to 74 Years | 8 (4.1%) | 0 (0.0%) |
| 75 Years and over | 0 (0.0%) | 0 (0.0%) |
Disability Class: Vision Difficulty
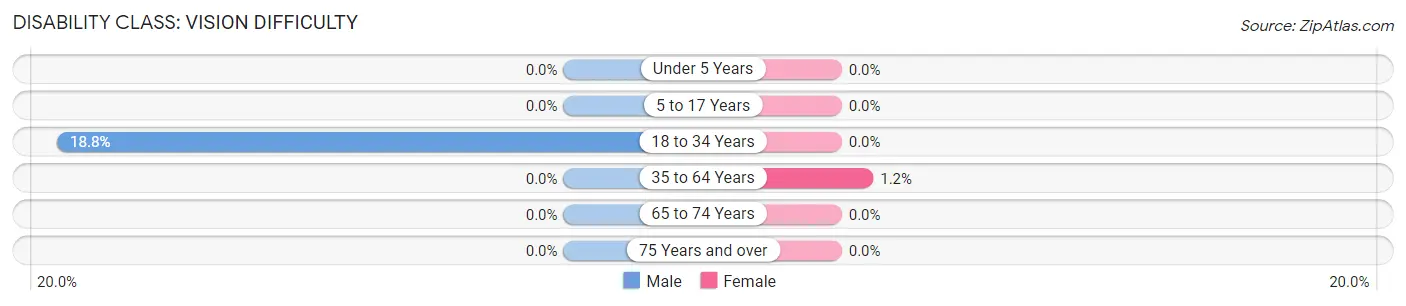
| Age Bracket | Male | Female |
| Under 5 Years | 0 (0.0%) | 0 (0.0%) |
| 5 to 17 Years | 0 (0.0%) | 0 (0.0%) |
| 18 to 34 Years | 31 (18.8%) | 0 (0.0%) |
| 35 to 64 Years | 0 (0.0%) | 8 (1.2%) |
| 65 to 74 Years | 0 (0.0%) | 0 (0.0%) |
| 75 Years and over | 0 (0.0%) | 0 (0.0%) |
Disability Class: Cognitive Difficulty
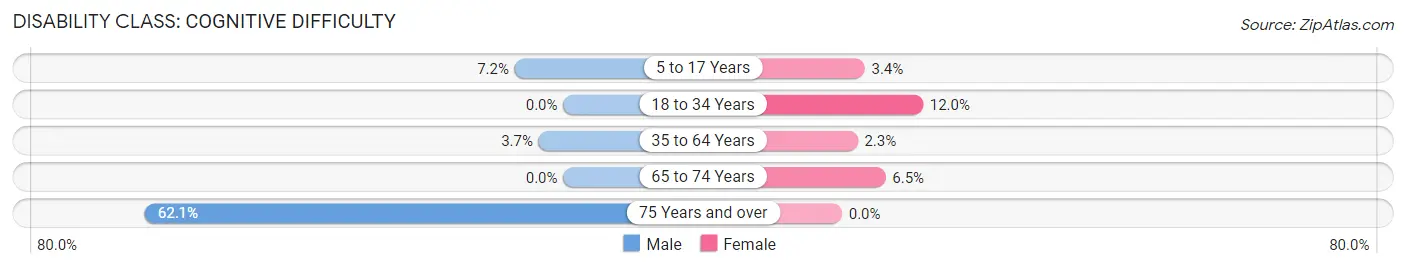
| Age Bracket | Male | Female |
| 5 to 17 Years | 31 (7.2%) | 7 (3.4%) |
| 18 to 34 Years | 0 (0.0%) | 16 (12.0%) |
| 35 to 64 Years | 21 (3.6%) | 16 (2.3%) |
| 65 to 74 Years | 0 (0.0%) | 13 (6.5%) |
| 75 Years and over | 87 (62.1%) | 0 (0.0%) |
Disability Class: Ambulatory Difficulty
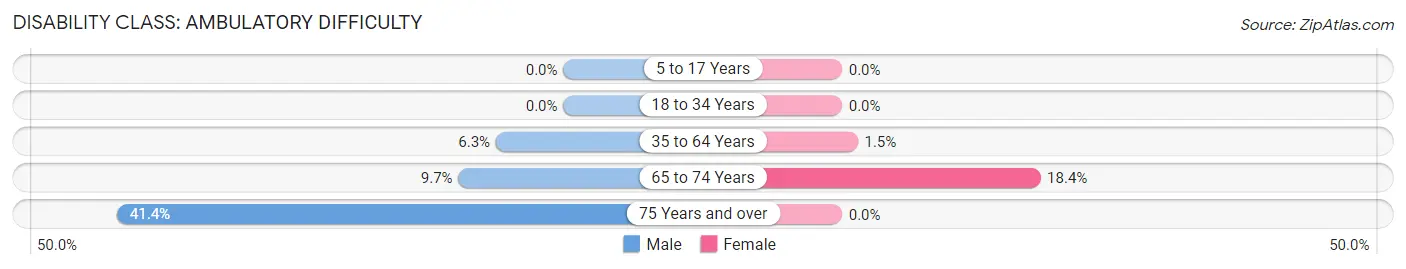
| Age Bracket | Male | Female |
| 5 to 17 Years | 0 (0.0%) | 0 (0.0%) |
| 18 to 34 Years | 0 (0.0%) | 0 (0.0%) |
| 35 to 64 Years | 36 (6.3%) | 10 (1.5%) |
| 65 to 74 Years | 19 (9.7%) | 37 (18.4%) |
| 75 Years and over | 58 (41.4%) | 0 (0.0%) |
Disability Class: Self-Care Difficulty
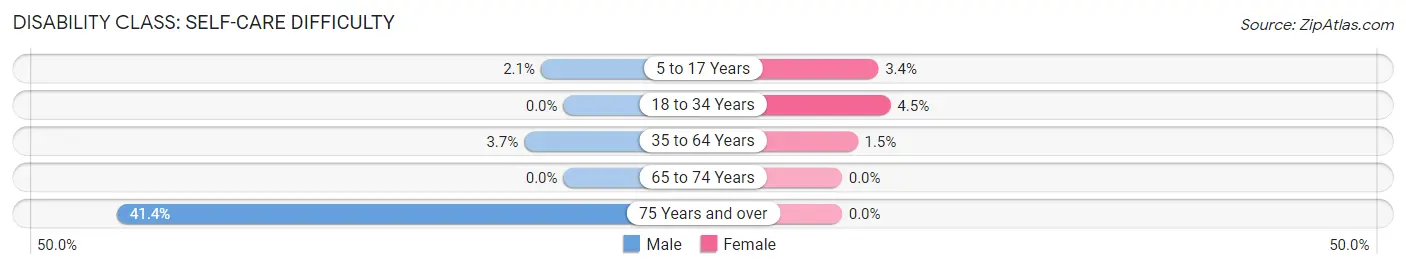
| Age Bracket | Male | Female |
| 5 to 17 Years | 9 (2.1%) | 7 (3.4%) |
| 18 to 34 Years | 0 (0.0%) | 6 (4.5%) |
| 35 to 64 Years | 21 (3.6%) | 10 (1.5%) |
| 65 to 74 Years | 0 (0.0%) | 0 (0.0%) |
| 75 Years and over | 58 (41.4%) | 0 (0.0%) |
Technology Access in Chico
Computing Device Access in Chico
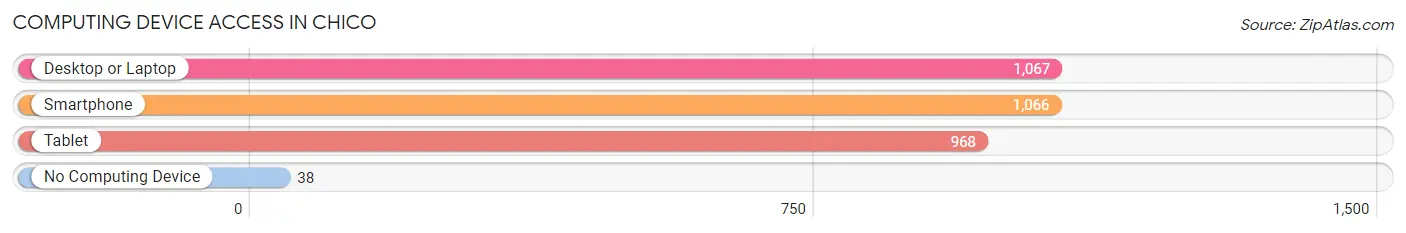
| Device Type | # Households | % Households |
| Desktop or Laptop | 1,067 | 91.6% |
| Smartphone | 1,066 | 91.5% |
| Tablet | 968 | 83.1% |
| No Computing Device | 38 | 3.3% |
| Total | 1,165 | 100.0% |
Internet Access in Chico
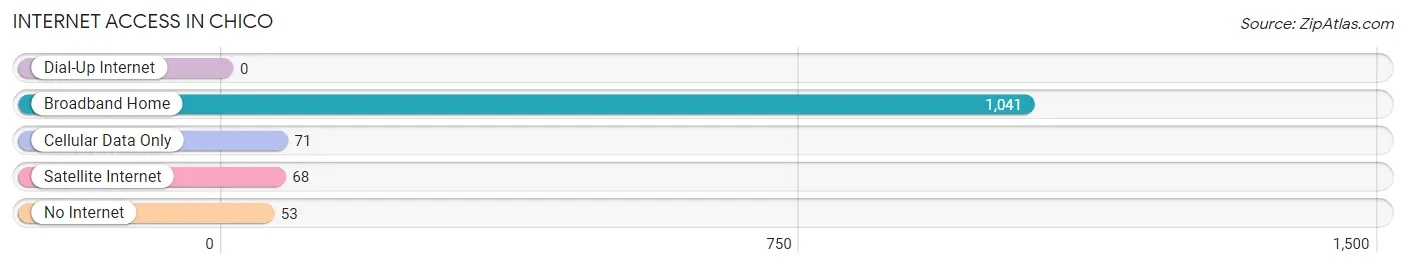
| Internet Type | # Households | % Households |
| Dial-Up Internet | 0 | 0.0% |
| Broadband Home | 1,041 | 89.4% |
| Cellular Data Only | 71 | 6.1% |
| Satellite Internet | 68 | 5.8% |
| No Internet | 53 | 4.5% |
| Total | 1,165 | 100.0% |
Chico Summary
Chico is a small town located in the state of Washington, United States. It is situated in the northern part of the state, in the county of Whatcom. The town is located on the banks of the Nooksack River, and is surrounded by the Cascade Mountains. The population of Chico was estimated to be 1,845 in the year 2000.
History
The area around Chico was first inhabited by the Lummi and Nooksack Native American tribes. The first European settlers arrived in the area in the late 1800s, and the town was officially founded in 1891. The town was named after the Chico River, which was named by the Spanish explorer Francisco de Eliza in 1790.
The town was initially a logging and farming community, and the first sawmill was built in 1892. The town grew rapidly in the early 1900s, and by 1910, the population had grown to over 1,000. The town was incorporated in 1912, and the first mayor was elected in 1913.
Geography
Chico is located in the northern part of Washington State, in the county of Whatcom. The town is situated on the banks of the Nooksack River, and is surrounded by the Cascade Mountains. The town is located at an elevation of 1,000 feet, and has a total area of 1.2 square miles.
The climate in Chico is mild and temperate, with warm summers and cool winters. The average annual temperature is around 50 degrees Fahrenheit, and the average annual precipitation is around 40 inches.
Economy
The economy of Chico is largely based on agriculture and tourism. The town is home to several farms, and the main crops grown in the area are apples, cherries, and blueberries. The town is also home to several wineries, and the local wine industry is a major contributor to the local economy.
Tourism is also an important part of the local economy. The town is home to several attractions, including the Nooksack Falls, the Chico River Trail, and the Chico State Park. The town also hosts several festivals and events throughout the year, including the Chico Apple Festival and the Chico Harvest Festival.
Demographics
As of the year 2000, the population of Chico was estimated to be 1,845. The racial makeup of the town was 94.3% White, 0.7% African American, 0.7% Native American, 0.7% Asian, 0.2% Pacific Islander, and 3.4% from other races. The median household income in Chico was $37,917, and the median family income was $45,917. The per capita income in Chico was $19,917.
Common Questions
What is Per Capita Income in Chico?
Per Capita income in Chico is $72,086.
What is the Median Family Income in Chico?
Median Family Income in Chico is $143,676.
What is the Median Household income in Chico?
Median Household Income in Chico is $126,904.
What is Income or Wage Gap in Chico?
Income or Wage Gap in Chico is 16.5%.
Women in Chico earn 83.5 cents for every dollar earned by a man.
What is Inequality or Gini Index in Chico?
Inequality or Gini Index in Chico is 0.42.
What is the Total Population of Chico?
Total Population of Chico is 3,076.
What is the Total Male Population of Chico?
Total Male Population of Chico is 1,627.
What is the Total Female Population of Chico?
Total Female Population of Chico is 1,449.
What is the Ratio of Males per 100 Females in Chico?
There are 112.28 Males per 100 Females in Chico.
What is the Ratio of Females per 100 Males in Chico?
There are 89.06 Females per 100 Males in Chico.
What is the Median Population Age in Chico?
Median Population Age in Chico is 47.8 Years.
What is the Average Family Size in Chico
Average Family Size in Chico is 2.9 People.
What is the Average Household Size in Chico
Average Household Size in Chico is 2.6 People.
How Large is the Labor Force in Chico?
There are 1,486 People in the Labor Forcein in Chico.
What is the Percentage of People in the Labor Force in Chico?
59.8% of People are in the Labor Force in Chico.
What is the Unemployment Rate in Chico?
Unemployment Rate in Chico is 3.7%.